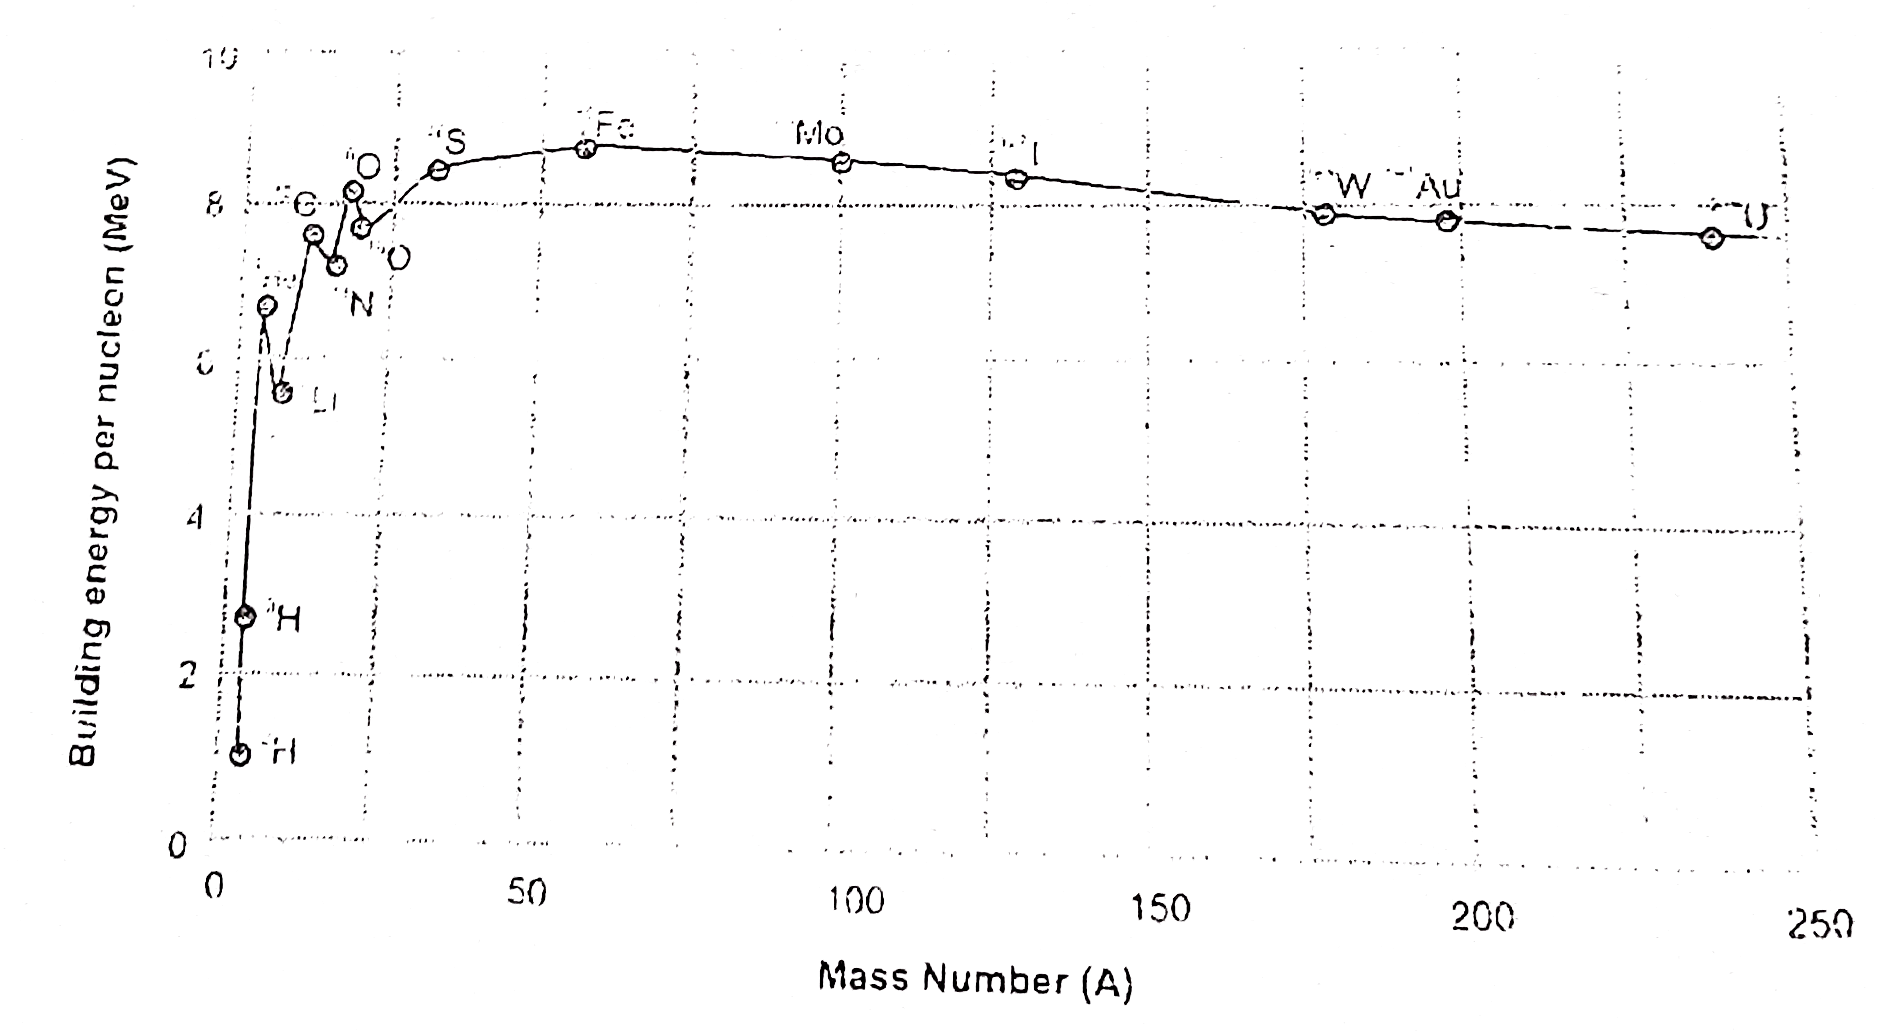
Draw the graph showing variation of binding energy per nucleon with mass number. Write the inferences drawn from the graph.Solution in Punjabi
Step by step video solution for Draw the graph showing variation of binding energy per nucleon with mass number. Write the inferences drawn from the graph. by Physics experts to help you in doubts & scoring excellent marks in Class 12 exams.
Updated on:21/07/2023Similar Questions
Draw a graph showing the variation of binding energy per nucleon with mass number of different nuclei. State two inferences from this graph.
View SolutionDraw the graph showing the variation of binding energy per nucleon with mass number. Give the reason for the decrease of binding energy per nucleon for nuclei with high mass numbers.
View SolutionDraw the graph showing variation of binding energy per nucleon with mass number. Write the inferences drawn from the graph.
View SolutionBinding energy curve shows the variation of Binding energy per nucleon of nuclei with mass number. Binding energy per nucleon is maximum for mass number..
View SolutionThe energy required to separate all the nucleons inside a nucleus is called binding energy of the nucleus. Draw the graph showing the variation of binding energy per nucleon as a function of mass number
View SolutionDraw the graph showing thervariation of binding energy per nucleon with mass number. Give therason for the decrease of binding energy per nucleon for nuclei with high mass numbers.

The binding energy per nucleon for nuclei with high mass number is low due to the large coulomb repulsion between the protons inside these nuclei.
View SolutionDraw the curve showing the variation of binding energy per nucleon as a function of mass number A. Explain the stability of the nucleus from the curve.
View SolutionThe graph between the binding energy per nucleon (E) and atomic mass number (A) is as-
View Solution
