Plot a graph showin the variation of Coulomb force (F) versus 1r2, where r is the distance between the two charges of each pair of charges (1μC,2μC) (1μC,−3μC). Interpret the graphs obtained.Solution in Punjabi
Step by step video & image solution for Plot a graph showin the variation of Coulomb force (F) versus 1/r^2, where r is the distance between the two charges of each pair of charges (1muC, 2muC) (1muC,-3muC). Interpret the graphs obtained. by Physics experts to help you in doubts & scoring excellent marks in Class 12 exams.
Updated on:21/07/2023Similar Questions
The graph which represents the correct relation between Coulomb force versus distance between two point charges is............
View SolutionPlot a graph showing the variation of coulomb force (F) versus (1r2), where r is the distance between the two charges of each pair of charges:
(1μC,2μC)and(2μC−3μC). Interpet the graphs obtained.
View SolutionTwo charges 2muC and 1muC are placed at a distance of 10cm. Where should a third charge be placed between them so that it does not experience any force.
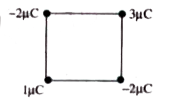
View SolutionFour point charges 1μC,3μC,−2μCand−2μC are arranged on the four vertices of a square of side 1 cm. The dipole moment of this charge assembly is

View SolutionCoulomb force (F) and ((1)/(r^2)) Draw a graph showing the transformation of: where each charge pair (1muC, 2mu C) And (2mu C , - 3mu C) Is the distance between the two charges, explain the graph obtained.
View SolutionFor charges q_1=1muC, q_2=2muC, q_3=-3muC and q_4=4muC are kept on the vertices of a square of side 1m . Find the electric potential energy of this system of charges.
View SolutionElectric charges of 1muC-1muC and 2muC are placed in air at the corners A, B and C respectively of an equilateral triangle ABC having length of each side 10cm. The resultant force on the charge at C is
View SolutionTwo charges each of 1muC are at m. Then the force between them is
View Solution
