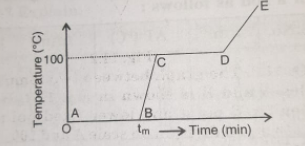
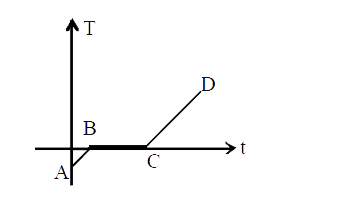
Refer to the plot of temperature versus time (shown in the figure) showing the changes in the state of ice on heating (not to scale).
Which of the following is correct?Solution in Punjabi
The region AB represents ice and water in thermal equilibrium
At B water starts boiling
At C all the water gets converted into steam.
C to D represents water and steam in equilibrium at boiling point.
Step by step video & image solution for Refer to the plot of temperature versus time (shown in the figure) showing the changes in the state of ice on heating (not to scale). Which of the following is correct? by Physics experts to help you in doubts & scoring excellent marks in Class 11 exams.
Updated on:21/07/2023Topper's Solved these Questions
Similar Questions
What is the value of Rydberg constant?
View SolutionWhat is science ?
View SolutionAn ideal gas with pressure P, volume V and temperature T is expanded isothermally to a volume 2V and a final pressure Pi, If the same gas is expanded adiabatically to a volume 2V and a final pressure Pα find the value of ratio PαPi. The ratio of the specific heats for the gas is 1.67.
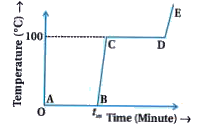
View SolutionRefer to the plot of temperature versus time (figure) showing the changes in the state if ice on heating (not to scale). Which of the following is correct ? .
View SolutionStatement-1: Latent heat of fusion of ice is 336000Jkg−1
Statement-2: Latent heat refers to change of state without any change in temperature.
View SolutionThe following figure represents the temperature versus time plot for a given amount of a substance when heat energy is supplied to it at a fixed rate and at a constant pressure. Which part of plot represent a phase change?
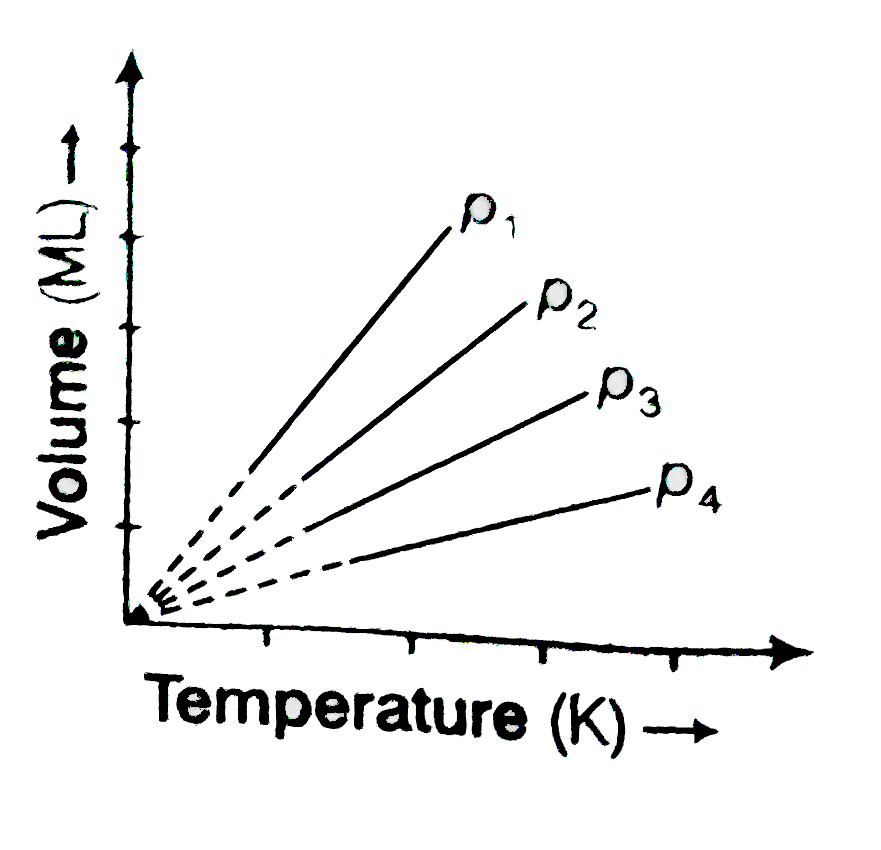
View SolutionA plot of volume (V) versus temperature (T) for a gas at constant pressure is a straight line passing through the origin. The plots at different values of pressure are shown in figure. Which of the following order of pressure is correct for this gas ?
View SolutionRefer to the plot of temperature versus time showing the changes in the state of ice on heating (not to scale). Which of the following is correct ?
View Solution(1) Take a few pieces of ice in a glass beaker as shown in figure.
(2) Insert the bulb of a thermometer in ice and measure its temperature.
(3) Put the beaker on a stand and heat the ice using a burner.
(4) Record the temperature using the thermometer after every minute.
(5) As the ice is heated,it starts melting. Stir the mixture of ice and water.
(6) Continue the heating even after ice starts melting.
(7) Draw a graph of temperature versus time.
Explain the role of latent heat in the change of state of a substance.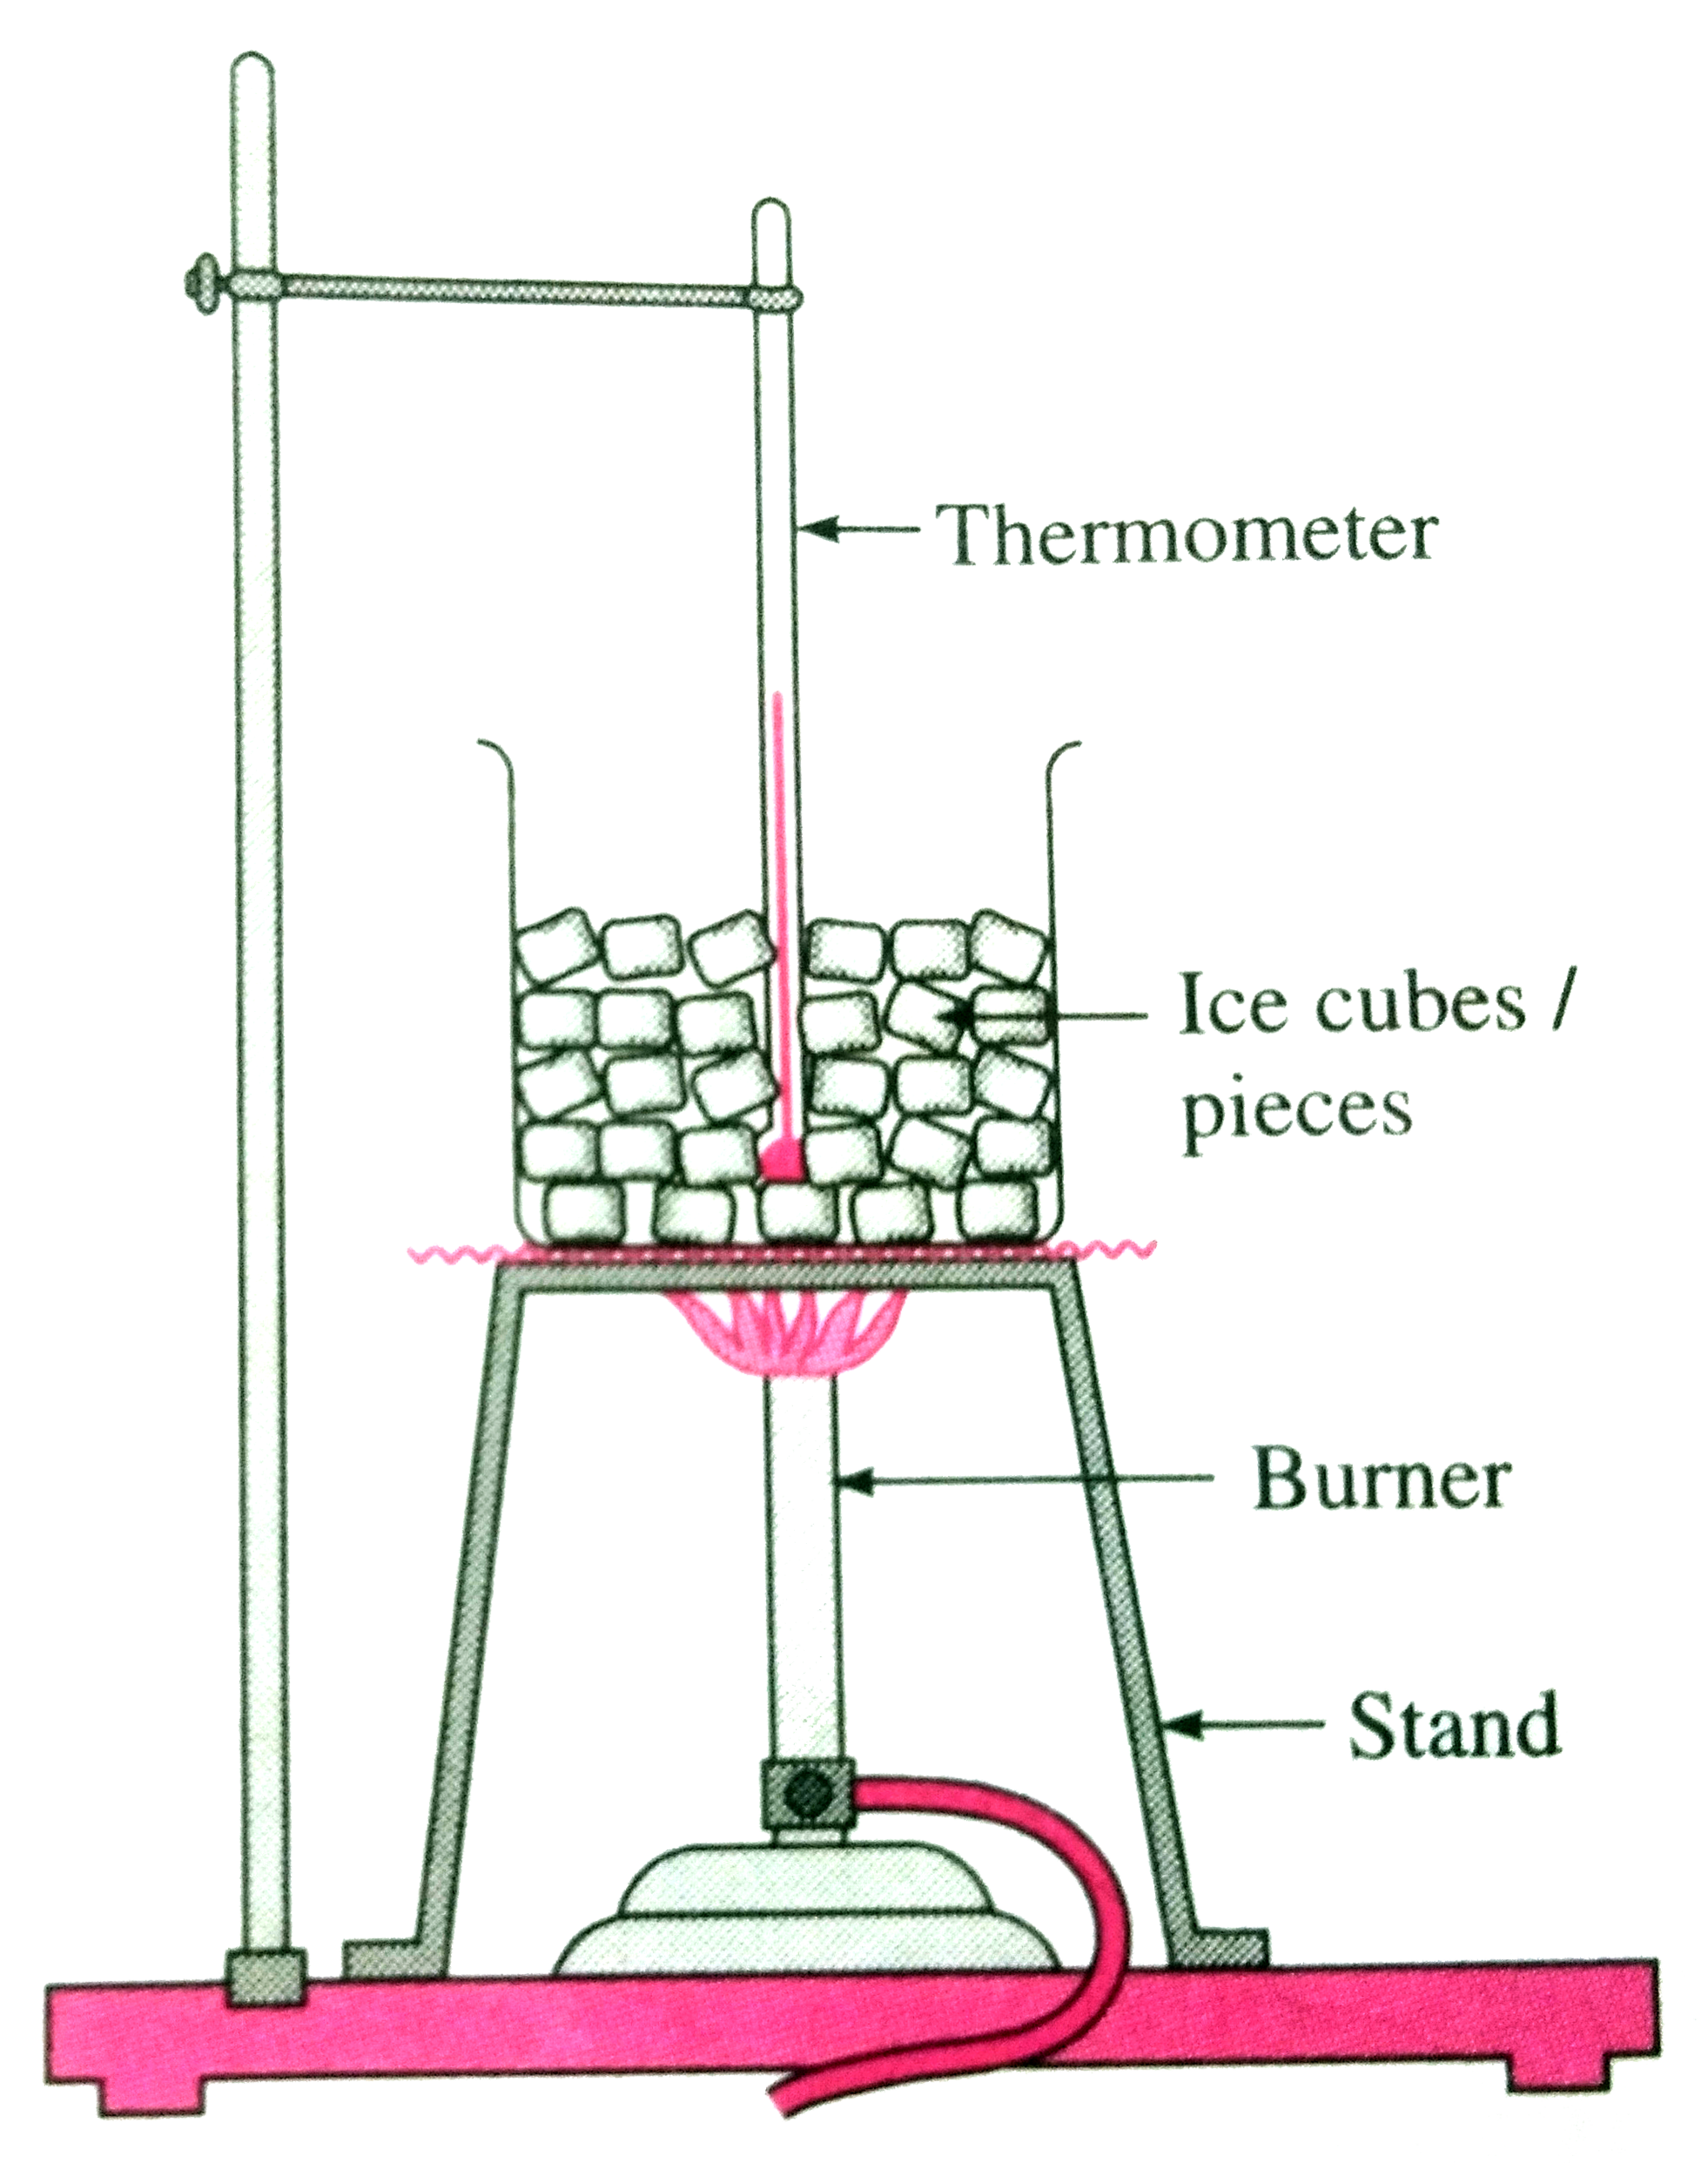
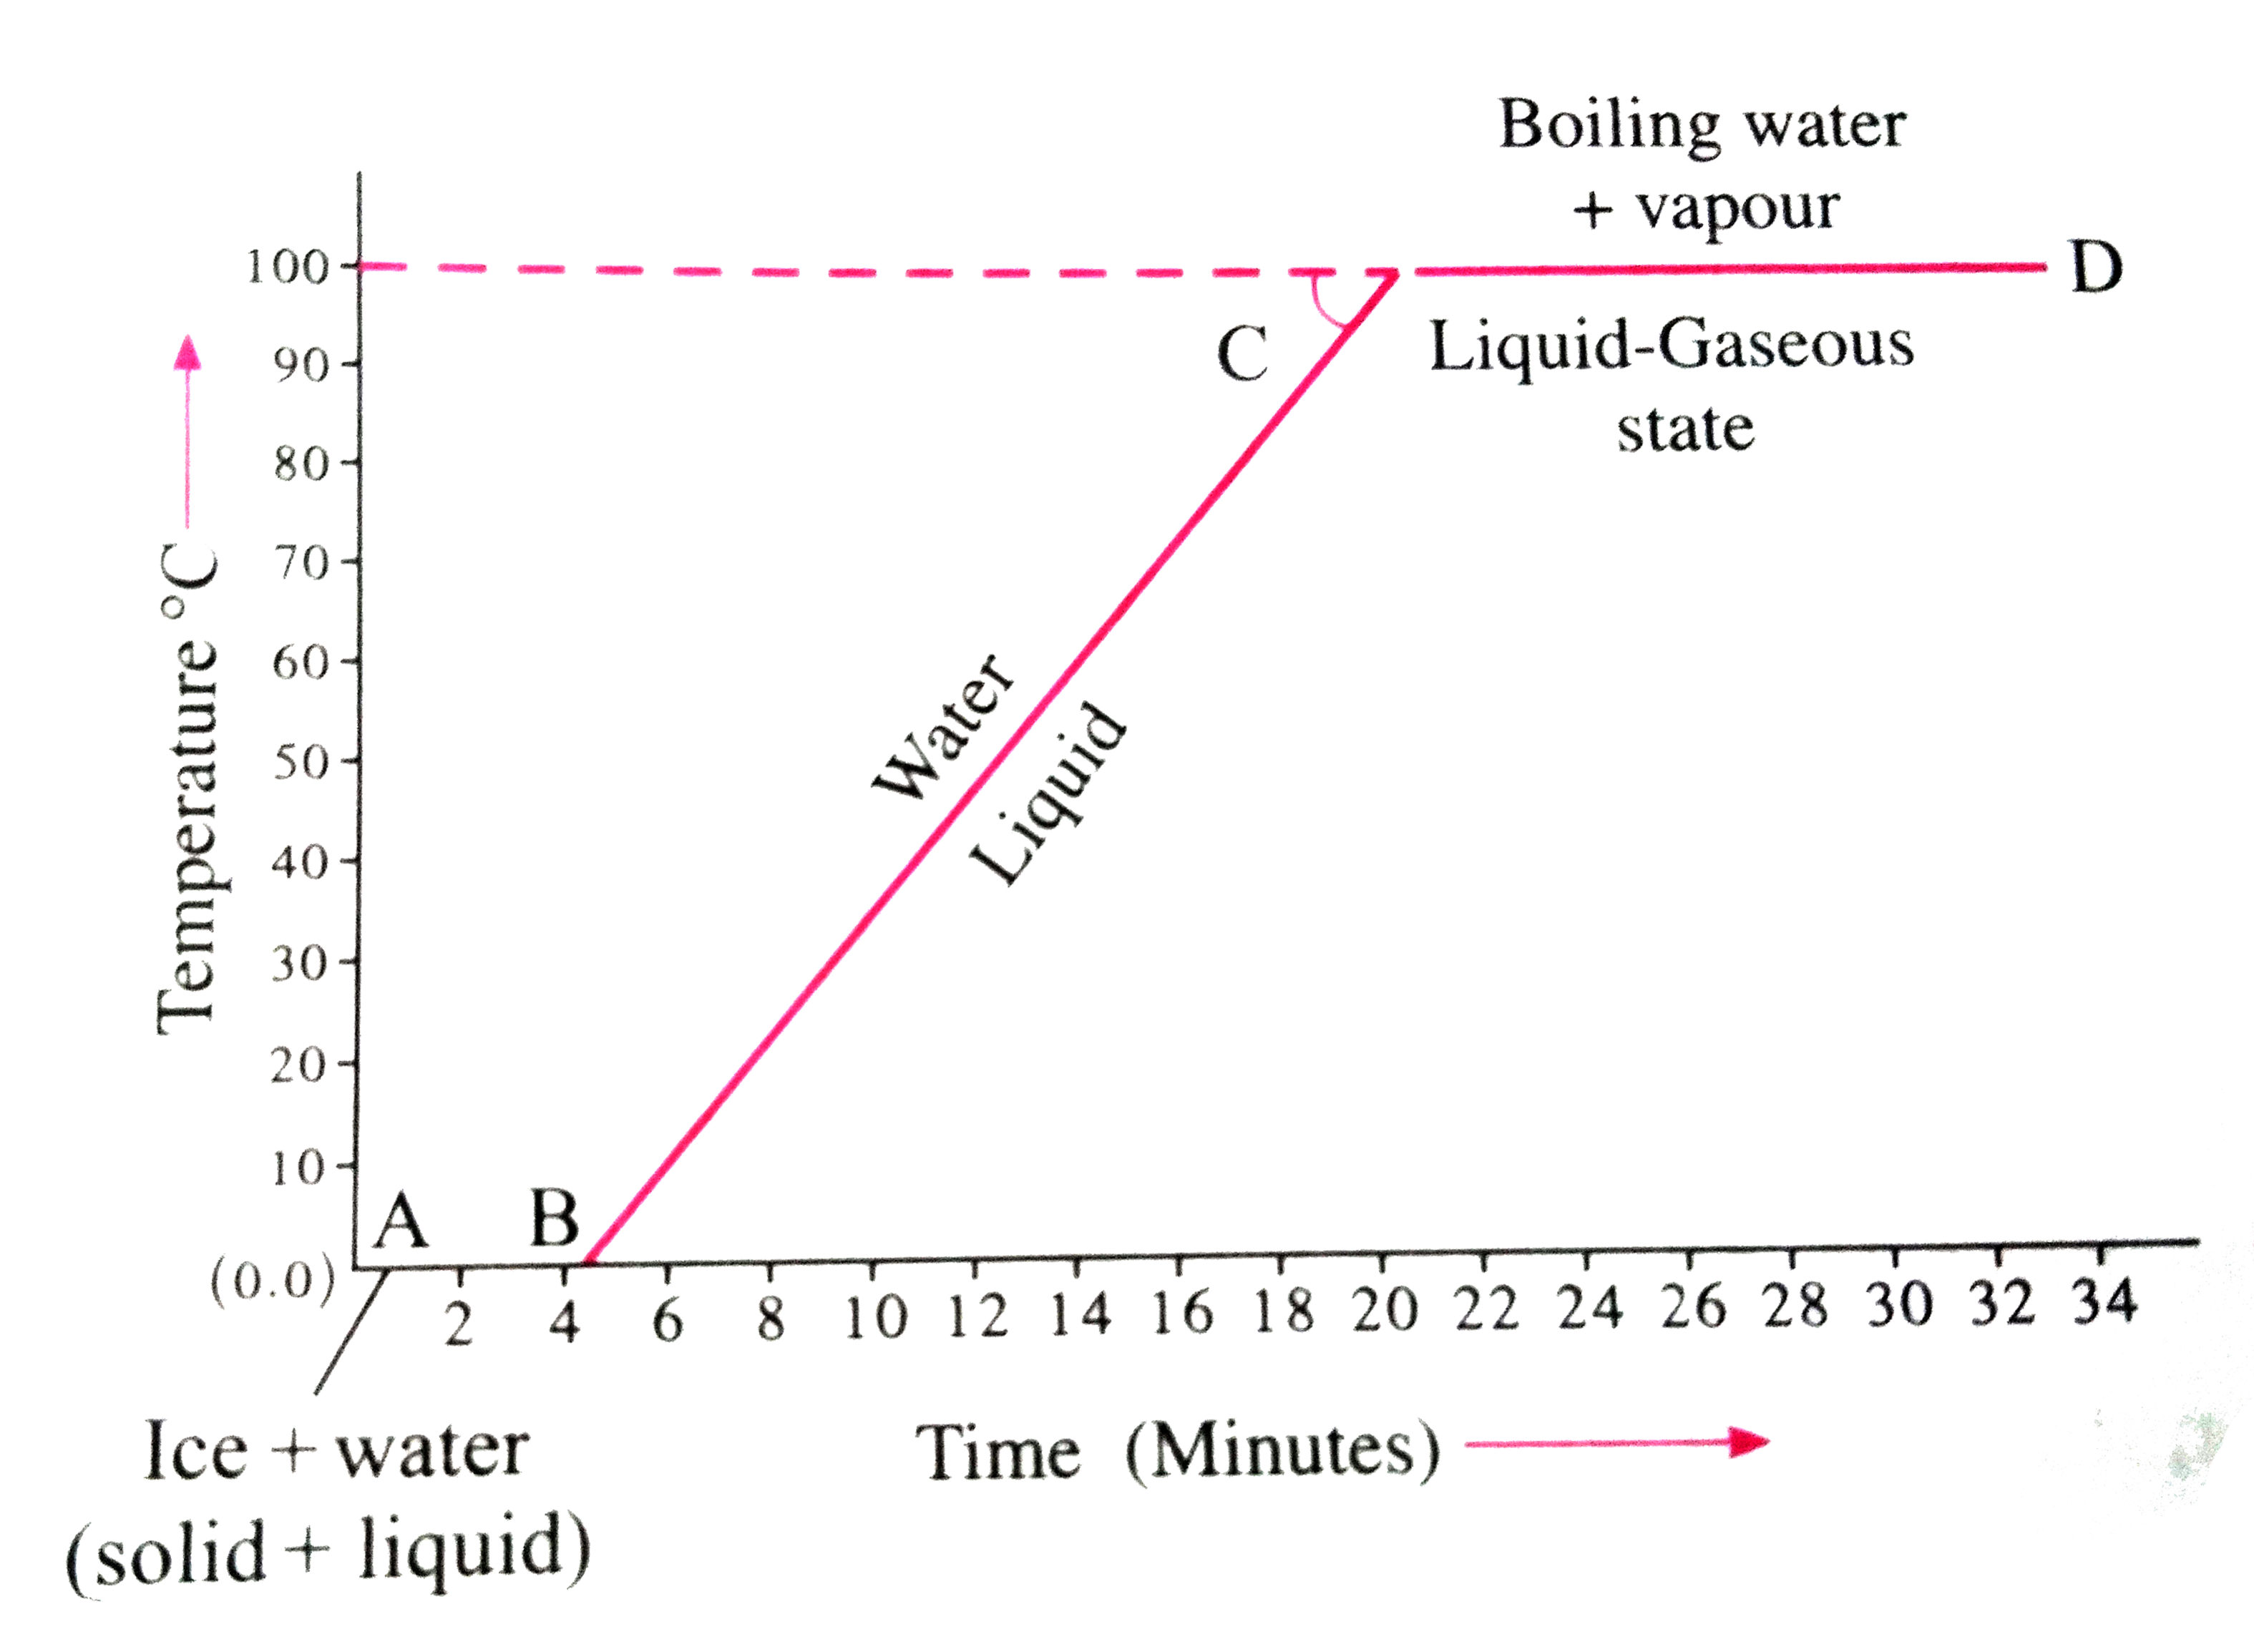
View SolutionHeat is supplied to a ice at a constant rate Temperature variation with time is as shown in figure. Then –
View Solutionदिया गया आरेख एक बर्फ को गर्म करने पर उसकी अवस्था में हुए परिवर्तन को समय के साथ दर्शाता है। निम्न में से कौन-सा निष्कर्ष सही है?

View SolutionRefer to the plot of temperature versus time, showing the changes in the state of ice on heating (not to scale). which of the following is correct ?
View SolutionSome ice pieces kept at a temperature −5∘C are heated gradually to 100∘C in a beaker. The temperature of the contents are plotted against time. The correct plot is -
View SolutionRefer to the plot of temperature versus time figure showing the changes in the state of ice on heating (not to scale). Which of the following is correct ?
View SolutionRefer to the plot of temperature versus time (figure) showing the changes in the state if ice on heating (not to scale). Which of the following is correct ? .
View SolutionA plot of volume (V) versus temperature (T) for a gas at constant pressure is a straight line passing through the origin. The plots at different values of pressure are shown in figure. Which of the following order of pressure is correct for this gas ?

View Solution
