दिया गया चित्र एक हृद चक्र की कुल अवधि को निरूपित करता है, अर्थात् 0.8 सेकण्ड तथा A, B एवं C इसकी विभिन्न अवस्थाओं को। A, B एवं c को पहचानिए तथा उनके बारे में सही कथन को चुनिए।
0.6 सेकण्ड
0.7 सेकण्ड
0.8 सेकण्ड
0.9 सेकण्ड
The correct Answer is:C
हृदय चक्र की अवधि 0.8 सेकण्ड होती है। इसमें से अलिन्द प्रकुंचन में 0.1 सेकण्ड, निलय प्रकुंचन में 0.3 सेकण्ड तथा पूर्ण हृदय प्रकुंचन (cardiac systole) में 0.4 सेकण्ड का समय लगता है।
Similar Questions
A sells an article to B at a loss of 20%. B sells it to C at a profit of 12.5% and C sells it to D at a loss of 8%. If D buys it for ₹ 248.40, then what is the difference between the loss incurred by A and C?
A ने एक वस्तु B को 20% की हानि पर बेची | B ने उस वस्तु को C को 12.5% लाभ पर बेच दिया तथा C ने वह वस्तु D को 8% की हानि पर बेची | यदि D ने उसे 248.40 रुपये में ख़रीदा, तो A और C को हुई हानि के बीच कया अंतर है ?
View SolutionA and B have to do 1315 part of a work together and B and C have to do 1120 th part of the work together. If the difference between the wages of A and C is Rs. 7600, then the total wages of A, B and C is:
A तथा B को एक साथ मिलकर 1315 भाग कार्य करना है और B तथा C को मिलकर 1120 भाग कार्य करना है | यदि A तथा C की मजदूरी का अंतर 7600 है, तो A, B तथा C की कुल मजदूरी है :
View SolutionIn triangle ABC , AD bisects angle A and intersects BC at D. If BC = a ,AC = b and AB = c, then BD = ? त्रिभुज ABC में, AD कोण A को समद्विभाजित करता है तथा BC को D पर काटता है | यदि BC = a, AC = b और AB = c है, तो BD = ?
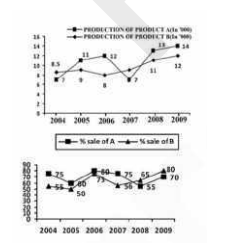
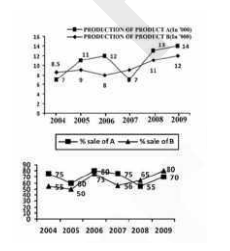
View SolutionThe line graph shows the production of product A and B (in thousands) during the period 2004 to 2009 and the second line Graph shows the percentage sale of these products.
यह पंक्ति आलेख 2004 से 2009 की अवधि के दौरान वस्तु A एवं B के उत्पादन ( हज़ार में ) को दर्शाता है तथा दूसरा पंक्ति आलेख इन वस्तुओं की प्रतिशत बिक्री को दर्शाता है | In the given line graph, what is the total sale of Product B in the year 2004 and 2008 together?
दिए गए पंक्ति आलेख के अनुसार, वर्ष 2004 एवं 2008 को मिलाकर वस्तु B की कुल बिक्री ज्ञात करें |
View SolutionThe line graph shows the production of product A and B (in thousands) during the period 2004 to 2009 and the second line Graph shows the percentage sale of these products.
यह पंक्ति आलेख 2004 से 2009 की अवधि के दौरान वस्तु A एवं B के उत्पादन ( हज़ार में ) को दर्शाता है तथा दूसरा पंक्ति आलेख इन वस्तुओं की प्रतिशत बिक्री को दर्शाता है | In the given line graph, what is the total sale of Product A in the year 2005 and 2009 taken together?
दिए गए पंक्ति आलेख के अनुसार, वर्ष 2005 तथा 2009 को मिलाकर वस्तु A की कुल बिक्री कितनी है ?
View SolutionA total sum of ₹153 is distributed among three friends A, B and C in such a way that C gets 5 times as much money than A gets and B gets 3 times as much money than A gets. How many rupees does B get? 153 रुपये की एक राशि को A, B और C में इस प्रकार वितरित किया जाता है कि C को A की तुलना में 5 गुनी राशि मिलती है तथा B को A की तुलना में तिगुनी राशि मिलती है | B को कितने रुपये मिले ?
View SolutionIn a college, 40% of the students were allotted group A, 75% of the remaining were given group B and the remaining 12 students. were given group C. Then the number of students who applied for the group is
View SolutionIf A denotes - C denotes × D denotes :− E denotes + then 14C3A12E4D2=?
यदि A- को प्रदर्शित करता है C,× को प्रदर्शित करता है D :− को प्रदर्शित करता है E + को प्रदर्शित करता है तो 14C3A12E4D2=?
View Solution
