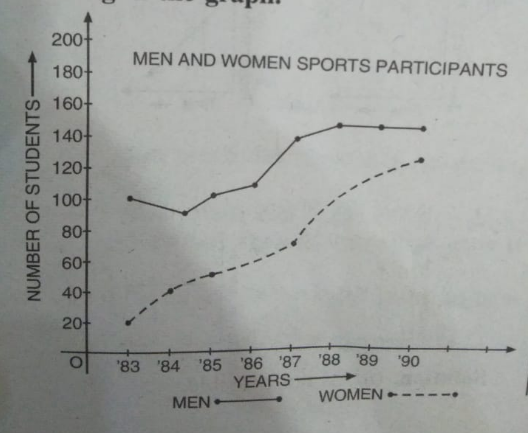
Answer the following question looking at the graph.
Between which years did number of women paricipants increase the most ?
 Solution in Punjabi
Step by step video & image solution for Answer the following question looking at the graph.Between which years did number of women paricipants increase the most ? by Maths experts to help you in doubts & scoring excellent marks in Class 8 exams.
Updated on:21/07/2023Topper's Solved these Questions
Similar Questions
Plot the points(5,0),(0.5),(2,5),(5,2)and (6,3) in the cartesian plane by using a graph paper.
View SolutionFind the H.C.F. of the following :
2xy,6x2y3,8x3y2.
View SolutionWhen water freezes its volume increases by 4%.What volumeof water is required to make 221cm3 of ice?
View SolutionMatch the following lists:

View SolutionHow many lines of symmetry does the above figure have ?
View SolutionWhich of the following are correct chain isomers of butane ? (i)
View SolutionDetermine the point of symmetry of a regular hexagon.
View SolutionDtermine the images of the following figure about the given line :
View SolutionMatch the following Column A to Column B

View SolutionMatch the following Column A to Column B

View SolutionMatch the following Column A to Column B

View SolutionThe inequation represented by the graph given below is :
View SolutionThe inequation that best describes the graph given below is _________
View SolutionThe inequation that best describes the following graph is _________
View SolutionWhich inequations represent the shaded region in the given figure
View Solution
