The pie charts A and B shown in Fig. 16.1 are based on waste segregation method adopted by two families X and Y respectively.
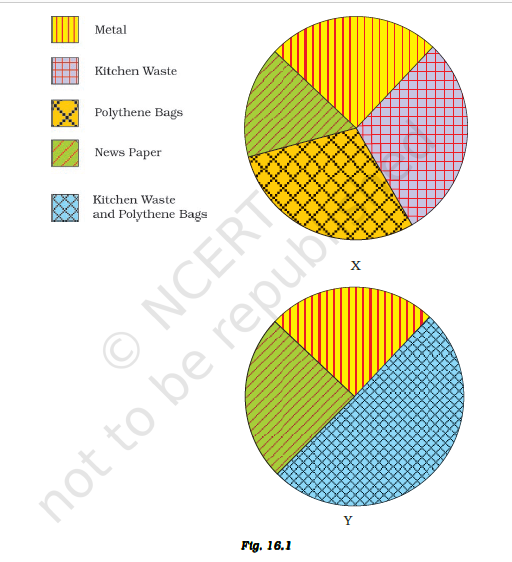
Family X is more environment friendly and aware of the effects of disposing waste materials in a wrongful manner. So, it disposes non-biodegradable waste like polythene bags and biodegradable waste like kitchen wastes separately.
Topper's Solved these Questions
- GARBAGE IN , GARBAGE OUTBOOK - NCERT EXEMPLARCHAPTER - GARBAGE IN , GARBAGE OUTEXERCISE - SHORT ANSWER QUESTIONS
4 Videos
- FOOD: WHERE DOES IT COME FROM?BOOK - NCERT EXEMPLARCHAPTER - FOOD: WHERE DOES IT COME FROM?EXERCISE - LONG ANSWER QUESTIONS
1 Videos
- GETTING TO KNOW PLANTS BOOK - NCERT EXEMPLARCHAPTER - GETTING TO KNOW PLANTS EXERCISE - LONG ANSWER QUESTIONS
5 Videos
Similar Questions
The following pie chart shows friuit tree distribution in a farm land. Consider the chart and answer questions based on it.
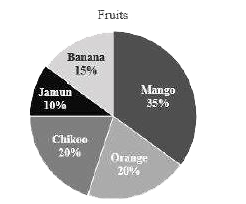
What is the ration of Chikoo and Mango trees to that Jamu, Orange and Banana trees in the farm land?
A. 1
B. 1:3
C. 11:9
D. 3:1
View SolutionA nonmetal X forms two oxides, A and B. The ratio of weight of the element X to the weight of oxygen in A and B is 7 : 20 and 7 : 16 respectively. If the molecular mass of the oxide, A is 1 08, identify A and B.
View Solution
Knowledge Check
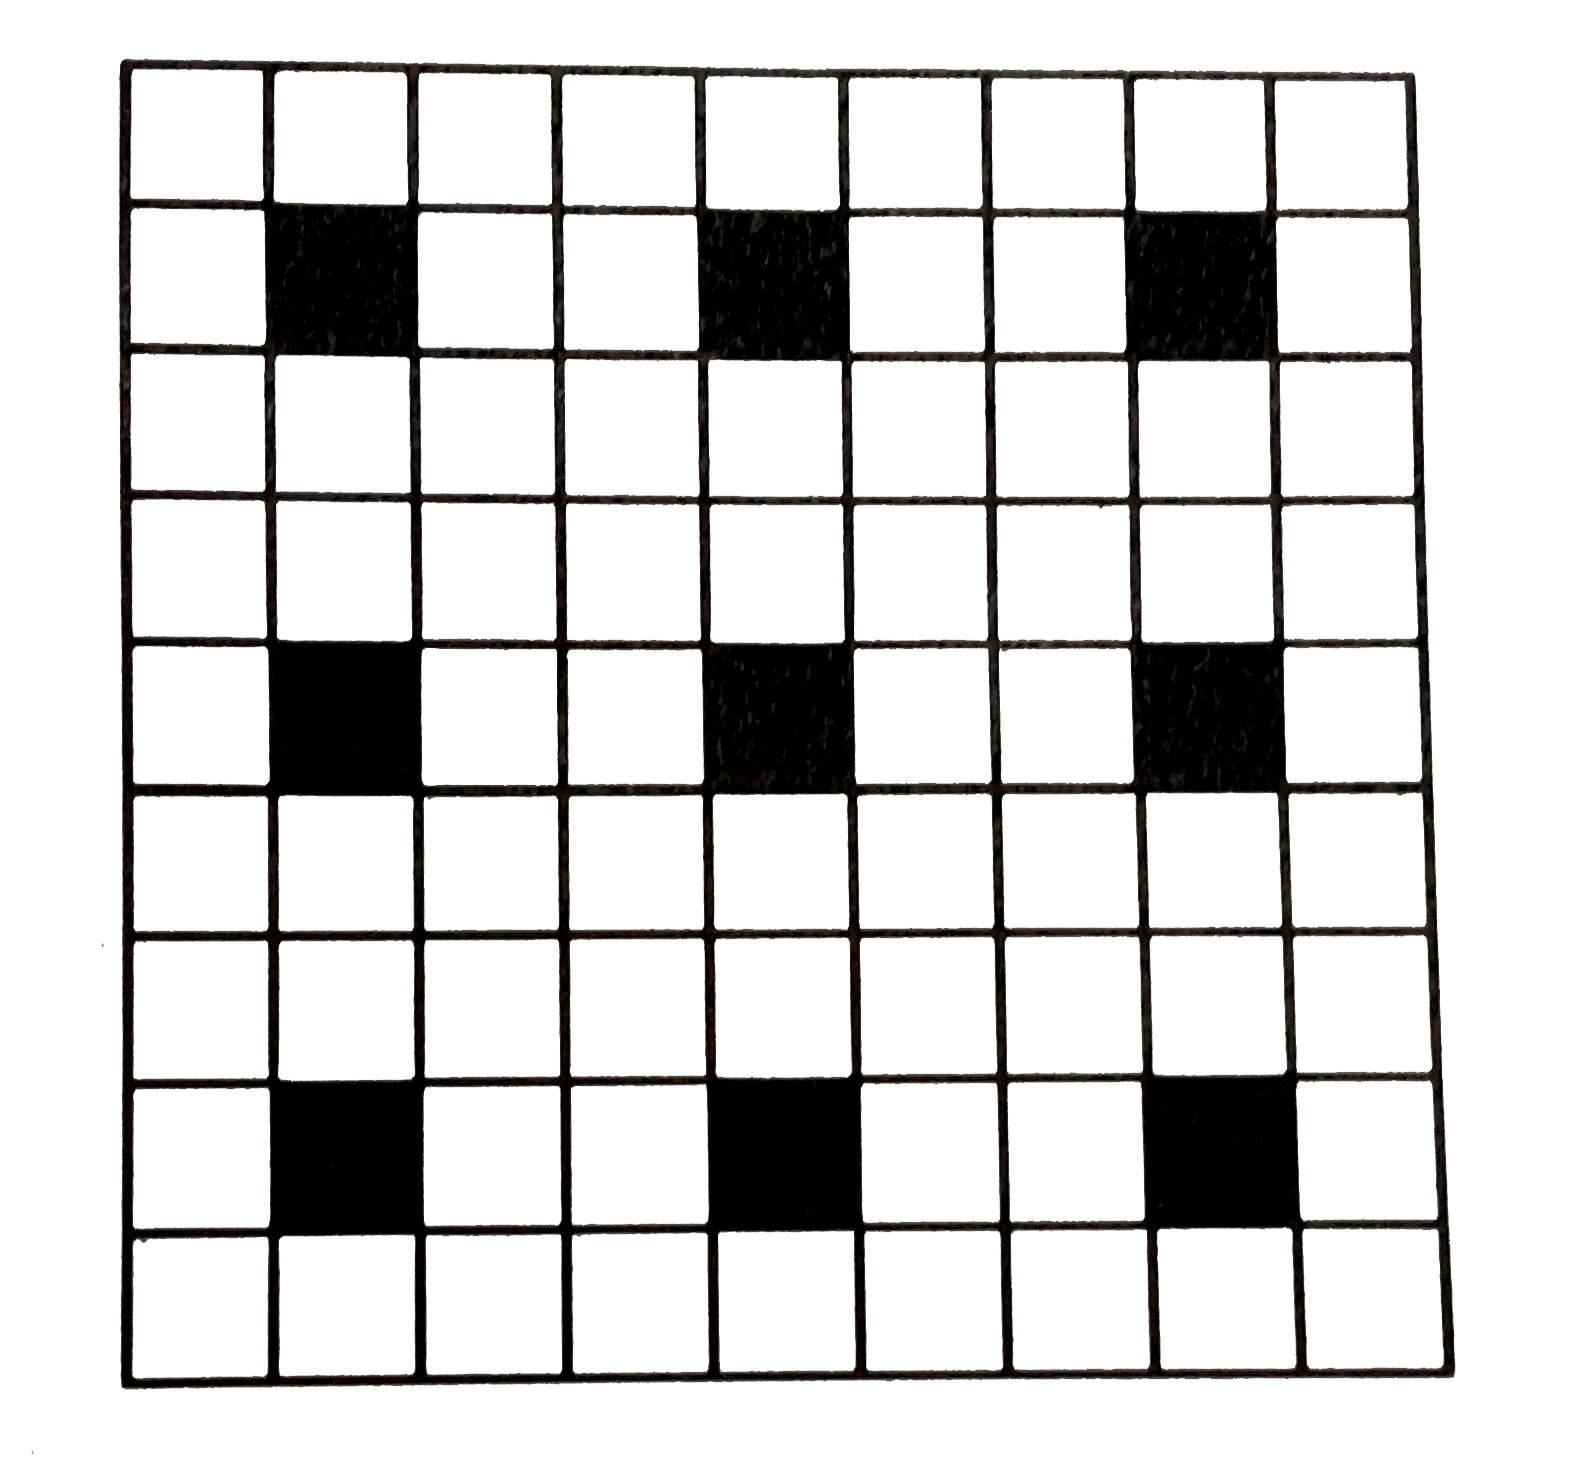
A two-dimensional solid pattern formed by two different atoms X and Y is shown below. The black and white squares represent atoms X and Y, respectively. The simplest formula for the compound based on the unit cell from the pattern is
 AXY8BX4Y9CXY2DXY4
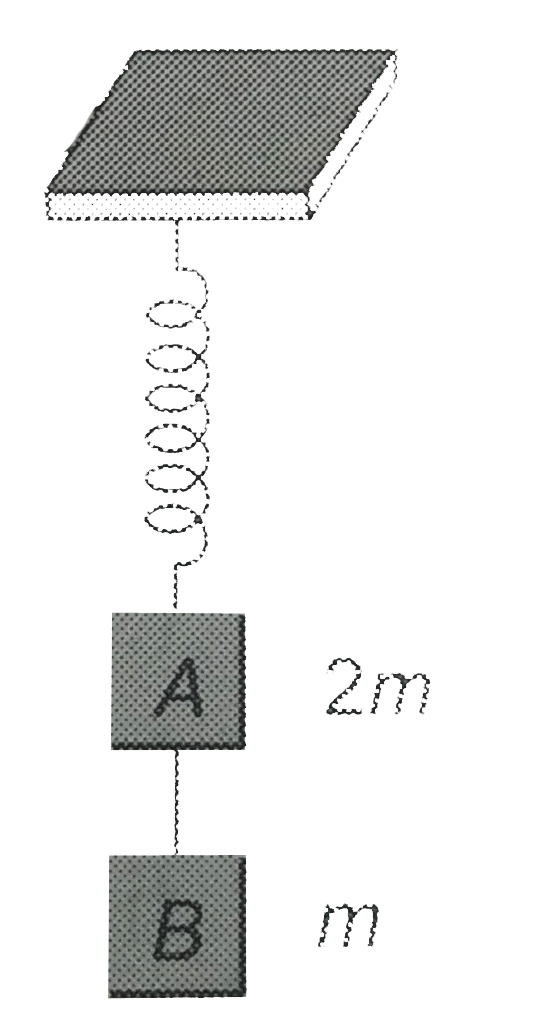
Two blocks A and B of masses 2m and respectively, are connected by a massless and inextensible string. The whole system is suspended by a masslessspring as shown in the figure. The magnitude of acceleration of A and B, immediately after the string is cut, are respectively
 Ag,g/2Bg/2,gCg,gDg/2,g/2
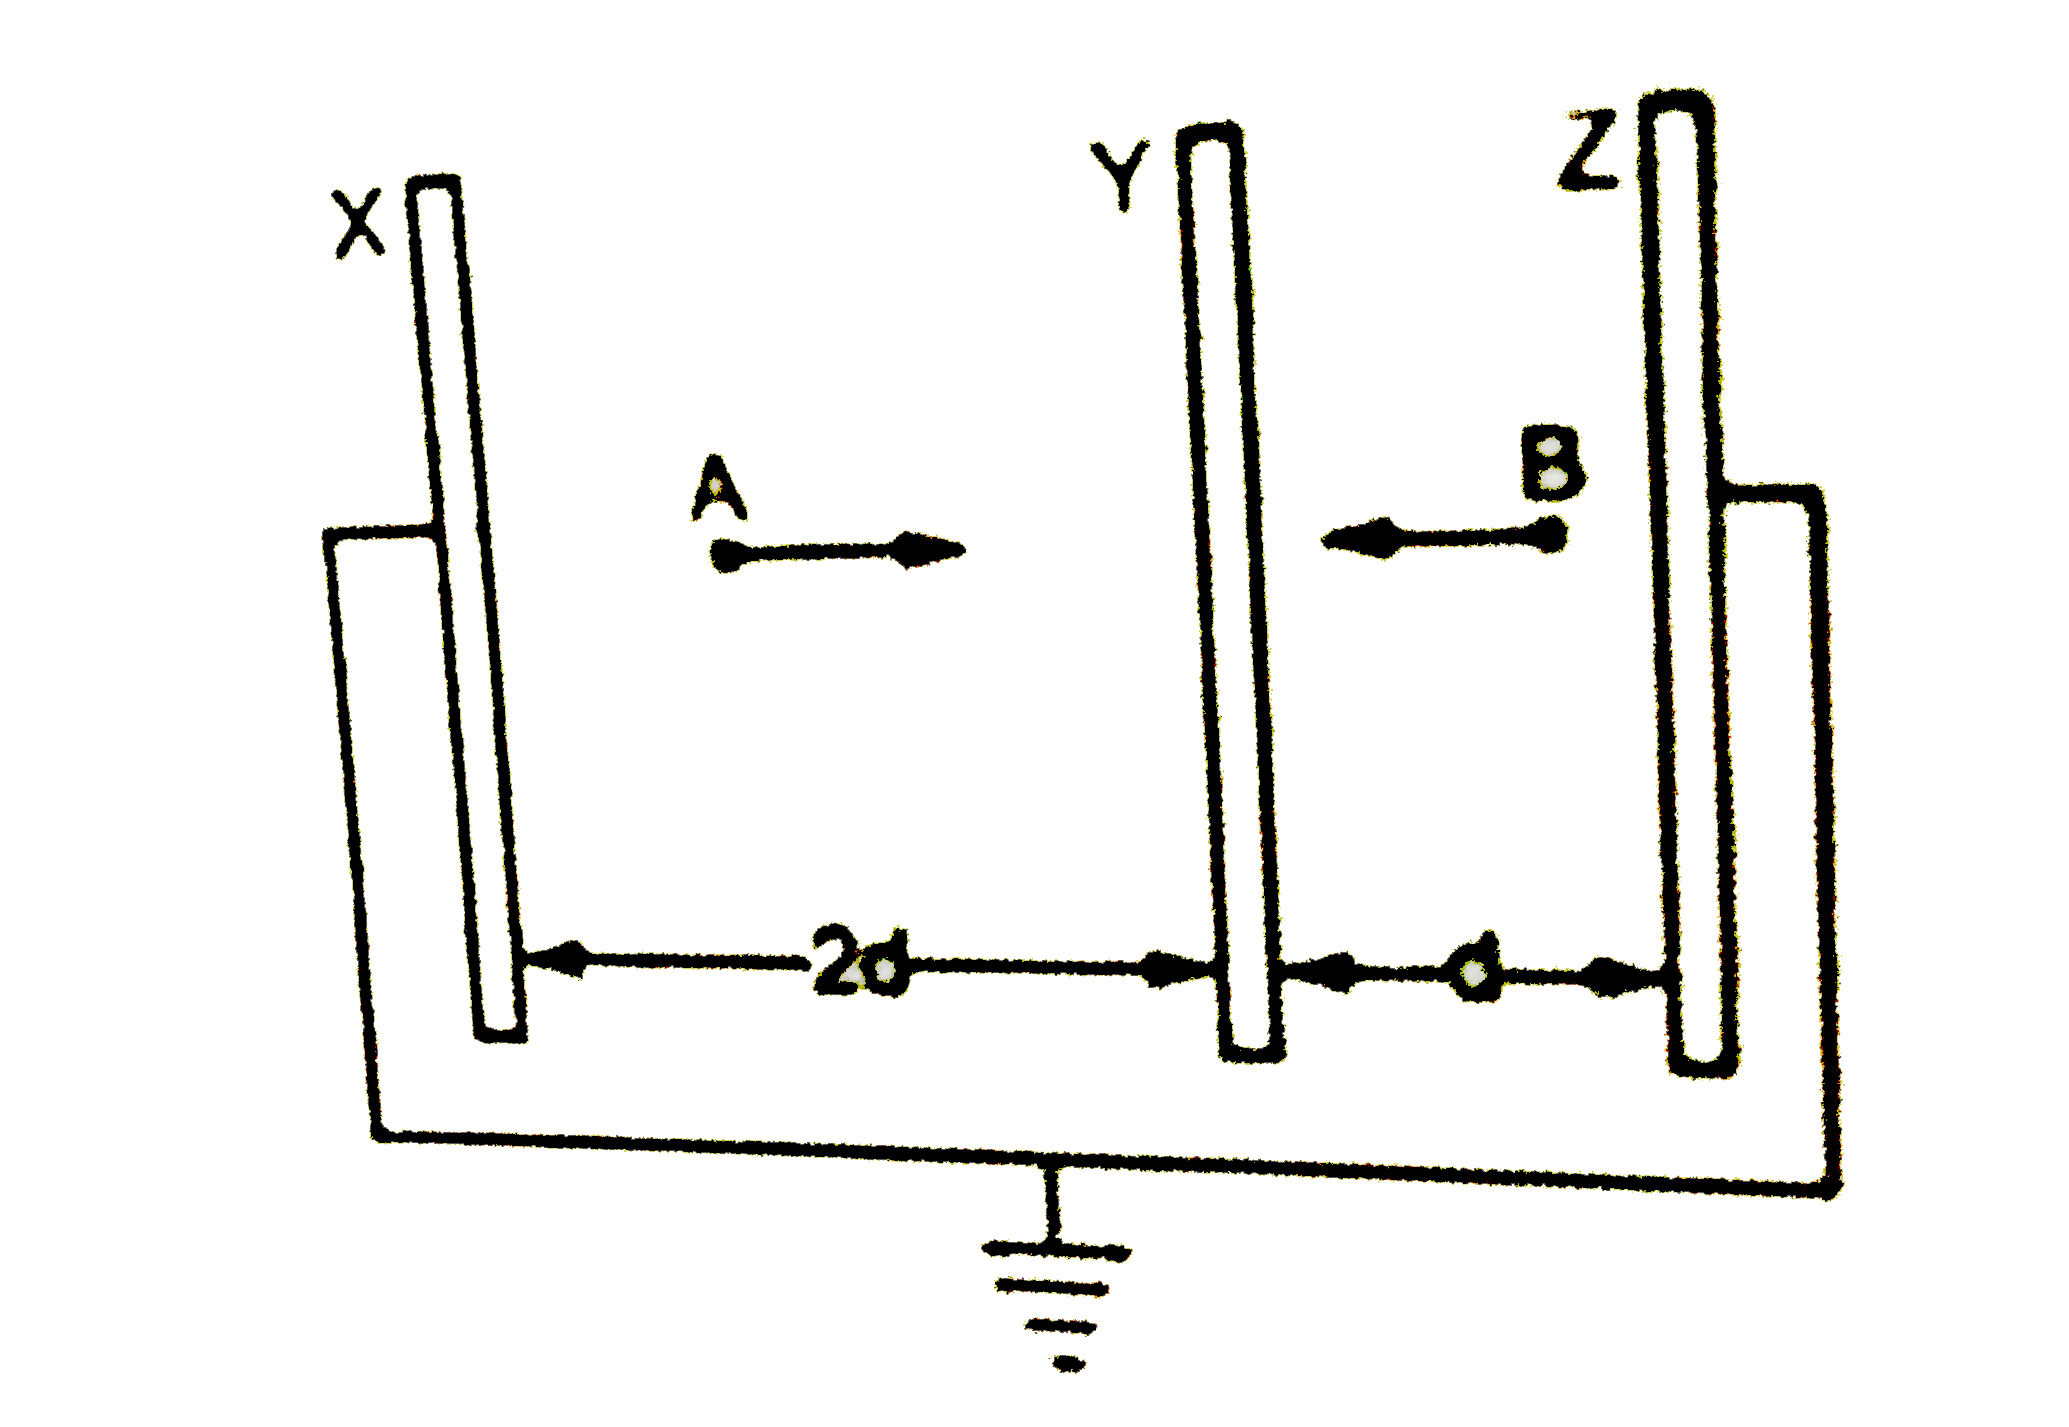
X,Y and Z are parallel plates. Y is given some positive charge. Two electrons A and B start form X and Z respectively and reach Y in times tA and tB respectively.AtA=tBBtA=√2tBC2tA=tBDtA=2tB
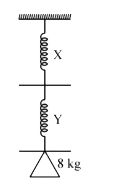
A body of mass 8 kg is suspended through two light springs X and Y connected in series as shown in figure. The readings is X and Y respectively are :
View SolutionComprehension:
The pie chart represents the favourite stars (Bollywood stars SRK, SK, AK, HR and VD) of the people of a family.
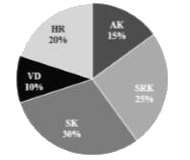
Consider the pie chart and answer questions based on it.
The ratio of people who like SRK to those who like SK is
A. 6/5
B. 5/6
C. 1/2
D. 2/1
View SolutionA body of mass 8kg is suspended through two light springs X and Y connected in series as shown in figure the readings in X and Y respectively are
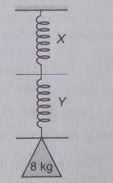
View SolutionA body of mass 8kg is suspended through two light springs X and Y connected in series as shown in figure the readings in X and Y respectively are

View SolutionXA and XB are the mole fraction of A and B respectively in liquid phase yA and yB are the mole fraction of A and B respective in vapour phase. Find out the slope of straight line if a graph is plotted 1yA along Y-axis against 1xA along X-axis gives straight line [p∘A and p∘B are vapour pressure of pure components A and B].
View Solution
