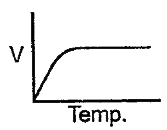
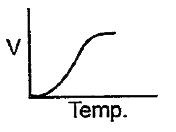
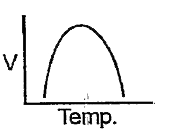
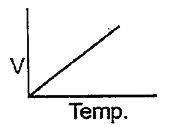
Which one of the graphs show the effect of temperature on the velocity of a typical enzymatic reaction?


The correct Answer is:C
To determine which graph shows the effect of temperature on the velocity of a typical enzymatic reaction, we can follow these steps:
Step 1: Understand the Relationship
Enzymatic reactions are influenced by temperature. As temperature increases, the reaction velocity typically increases up to a certain point, known as the optimum temperature. Beyond this point, the velocity decreases due to enzyme denaturation.
Step 2: Identify the Axes
In the graphs provided, the x-axis represents temperature, while the y-axis represents the velocity of the enzymatic reaction.
Step 3: Recognize the Typical Graph Shape
The typical graph showing the effect of temperature on enzymatic activity is usually bell-shaped. It starts with a gradual increase in velocity as temperature rises, reaches a peak at the optimum temperature, and then declines as the temperature continues to rise due to enzyme denaturation.
Step 4: Analyze the Options
Look at each of the provided graphs:
- Option 1: Check if it shows a gradual increase, a peak, and then a decline.
- Option 2: Look for a linear increase or a flat line, which would not represent the typical enzymatic reaction.
- Option 3: Similar to option 2, check for linearity or lack of a peak.
- Option 4: Again, check for the characteristic bell shape.
Step 5: Select the Correct Graph
The graph that displays a bell-shaped curve, indicating an increase in reaction velocity with temperature up to an optimum point, followed by a decrease, is the correct representation of the effect of temperature on enzymatic activity.
Conclusion
After analyzing the options, you would select the graph that shows this bell-shaped curve as the correct answer.
---
Enzymatic reactions are influenced by temperature. As temperature increases, the reaction velocity typically increases up to a certain point, known as the optimum temperature. Beyond this point, the velocity decreases due to enzyme denaturation.
In the graphs provided, the x-axis represents temperature, while the y-axis represents the velocity of the enzymatic reaction.
The typical graph showing the effect of temperature on enzymatic activity is usually bell-shaped. It starts with a gradual increase in velocity as temperature rises, reaches a peak at the optimum temperature, and then declines as the temperature continues to rise due to enzyme denaturation.
Look at each of the provided graphs:
- Option 1: Check if it shows a gradual increase, a peak, and then a decline.
- Option 2: Look for a linear increase or a flat line, which would not represent the typical enzymatic reaction.
- Option 3: Similar to option 2, check for linearity or lack of a peak.
- Option 4: Again, check for the characteristic bell shape.
The graph that displays a bell-shaped curve, indicating an increase in reaction velocity with temperature up to an optimum point, followed by a decrease, is the correct representation of the effect of temperature on enzymatic activity.
After analyzing the options, you would select the graph that shows this bell-shaped curve as the correct answer.
Similar Questions
Knowledge Check
- Question 1 - Select One
Which graph represents the effect of pHk/temp on the velocity of a typical enzymatic reaction (V)
A B
B C
C D
D
- Question 2 - Select One
The effect of temperature on reaction rate is given by
AClausius Clapeyron equationBArrhenius equationCGibb's Helmholtz equationDKirchoff's equation - Question 3 - Select One
The effect of temperature on the rate constant of a reaction is given by
AArrhenius EquationBNernst EquationCVant Hoff EquationDGibb's Helmholtz Equation
Which one of the given graphs shows the effect of pH on the velocity of a typical enzymatic reaction (V) ?
View SolutionWhich one of the given graph shows the effect of pH on the velocity of a typical enzymatic reaction (V)?
View SolutionWhat is the effect of temperature on the rate of a reaction.
View SolutionWhat is the effect of temperature on reaction rate?
View SolutionDiscuss the effect of temperature and density on the velocity of sound in air.
View Solution
