A person walks along an east-west street and a graph of his displacement from home is shown in figure. His average velocity for the whole time interval is:-
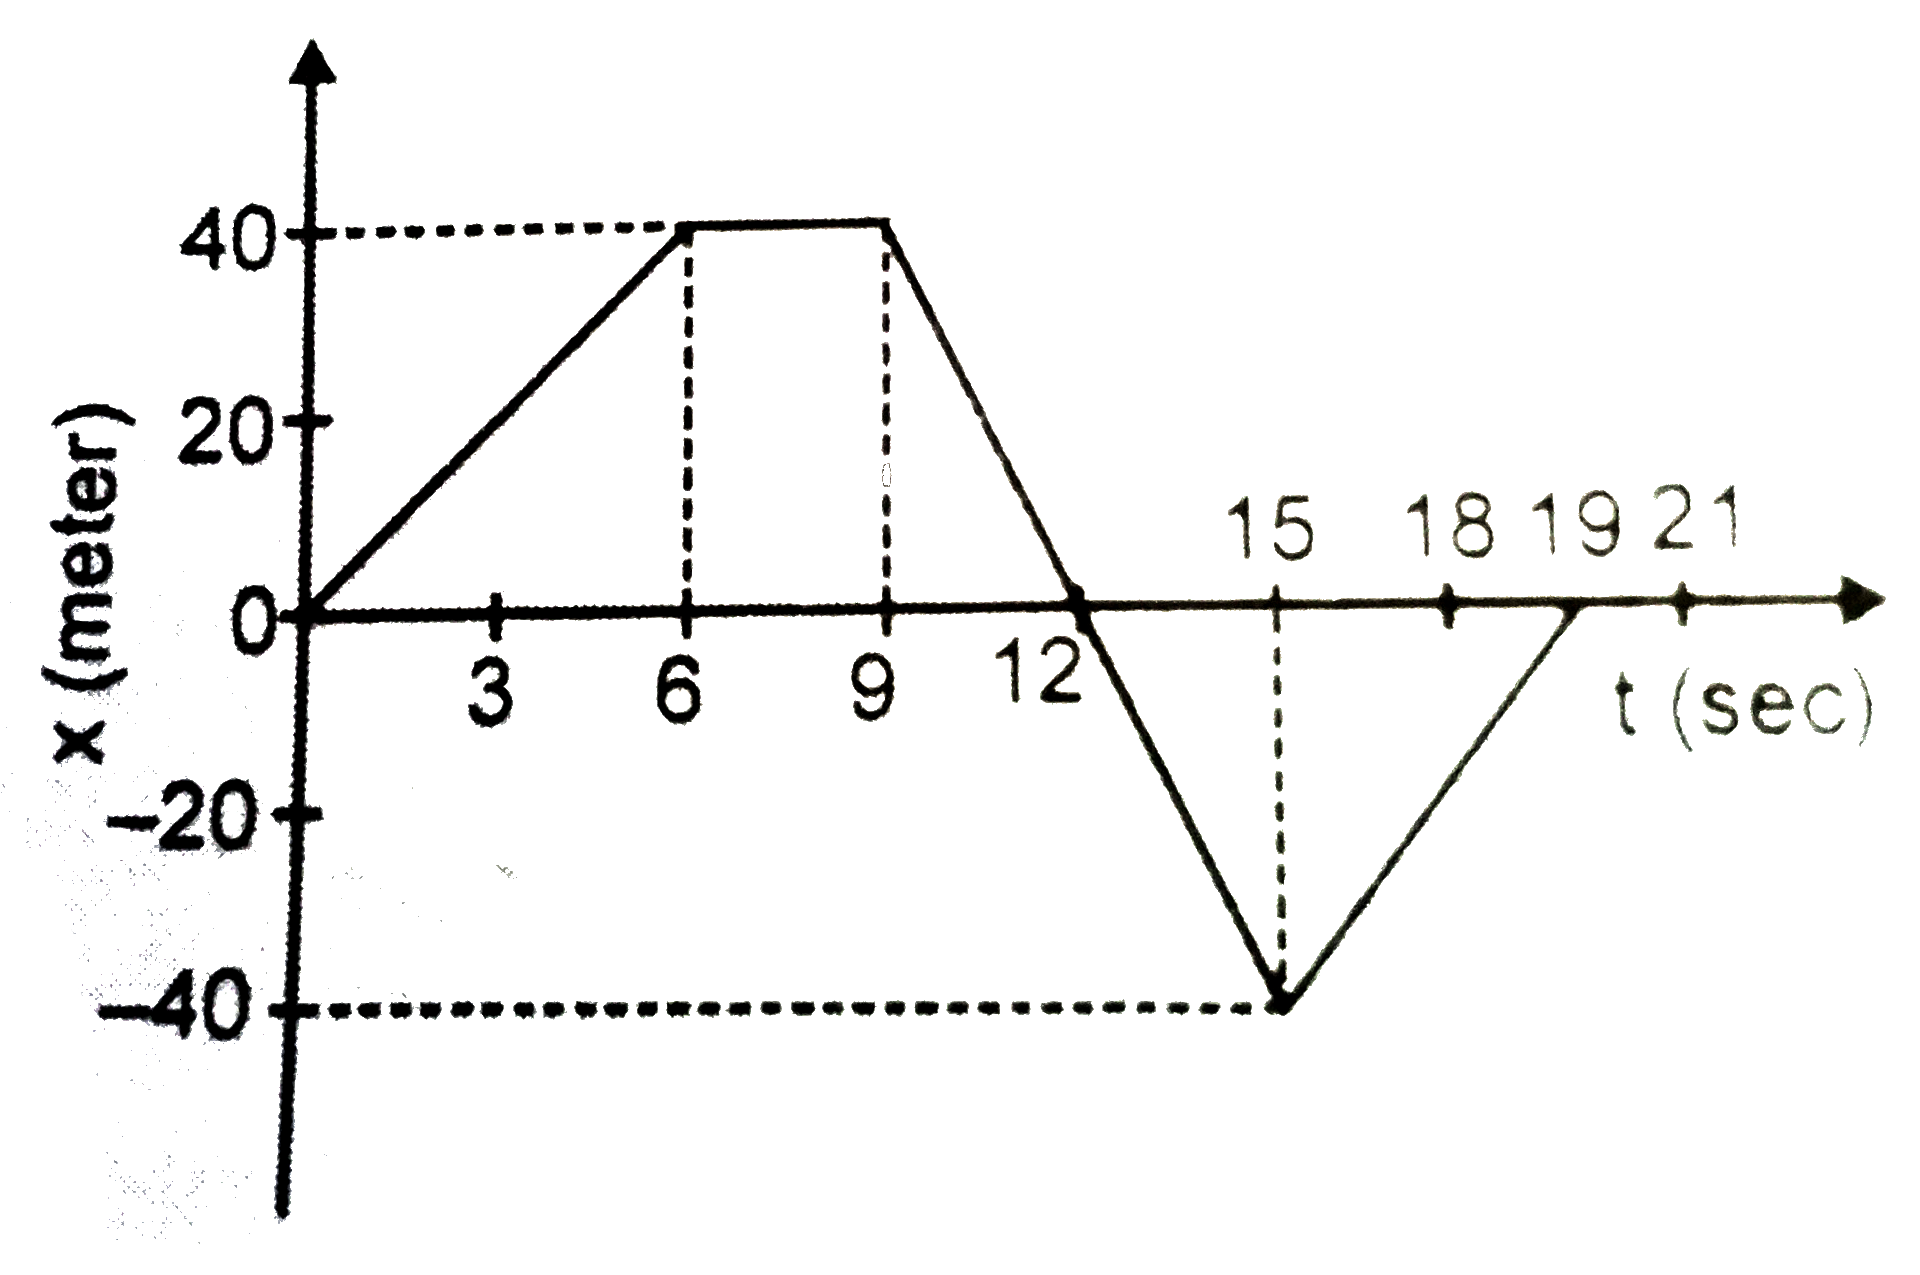
The average velocity is zero, since the displacement vector is zero. The instantaneous velocities are just the slopes of the curve at each point. At A the velocity is 40=6.76 m/min east. At B, it is zero. At C it is −655=−13 m/min east, or + 13 m/min west.
Topper's Solved these Questions
- Motion in Straight Line BOOK - VMC MODULES ENGLISHCHAPTER - Motion in Straight Line EXERCISE - SOLVED EXAMPLES
20 Videos
- Motion in Straight Line BOOK - VMC MODULES ENGLISHCHAPTER - Motion in Straight Line EXERCISE - PRACTICE EXERCISE
80 Videos
- MOTION IN A STRAIGHT LINE & PLANE BOOK - VMC MODULES ENGLISHCHAPTER - MOTION IN A STRAIGHT LINE & PLANE EXERCISE - IMPECCABLE
52 Videos
- Motion in Two DimensionsBOOK - VMC MODULES ENGLISHCHAPTER - Motion in Two DimensionsEXERCISE - MCQ
2 Videos
Similar Questions
The velocity − time graph of a particle is as shown in figure

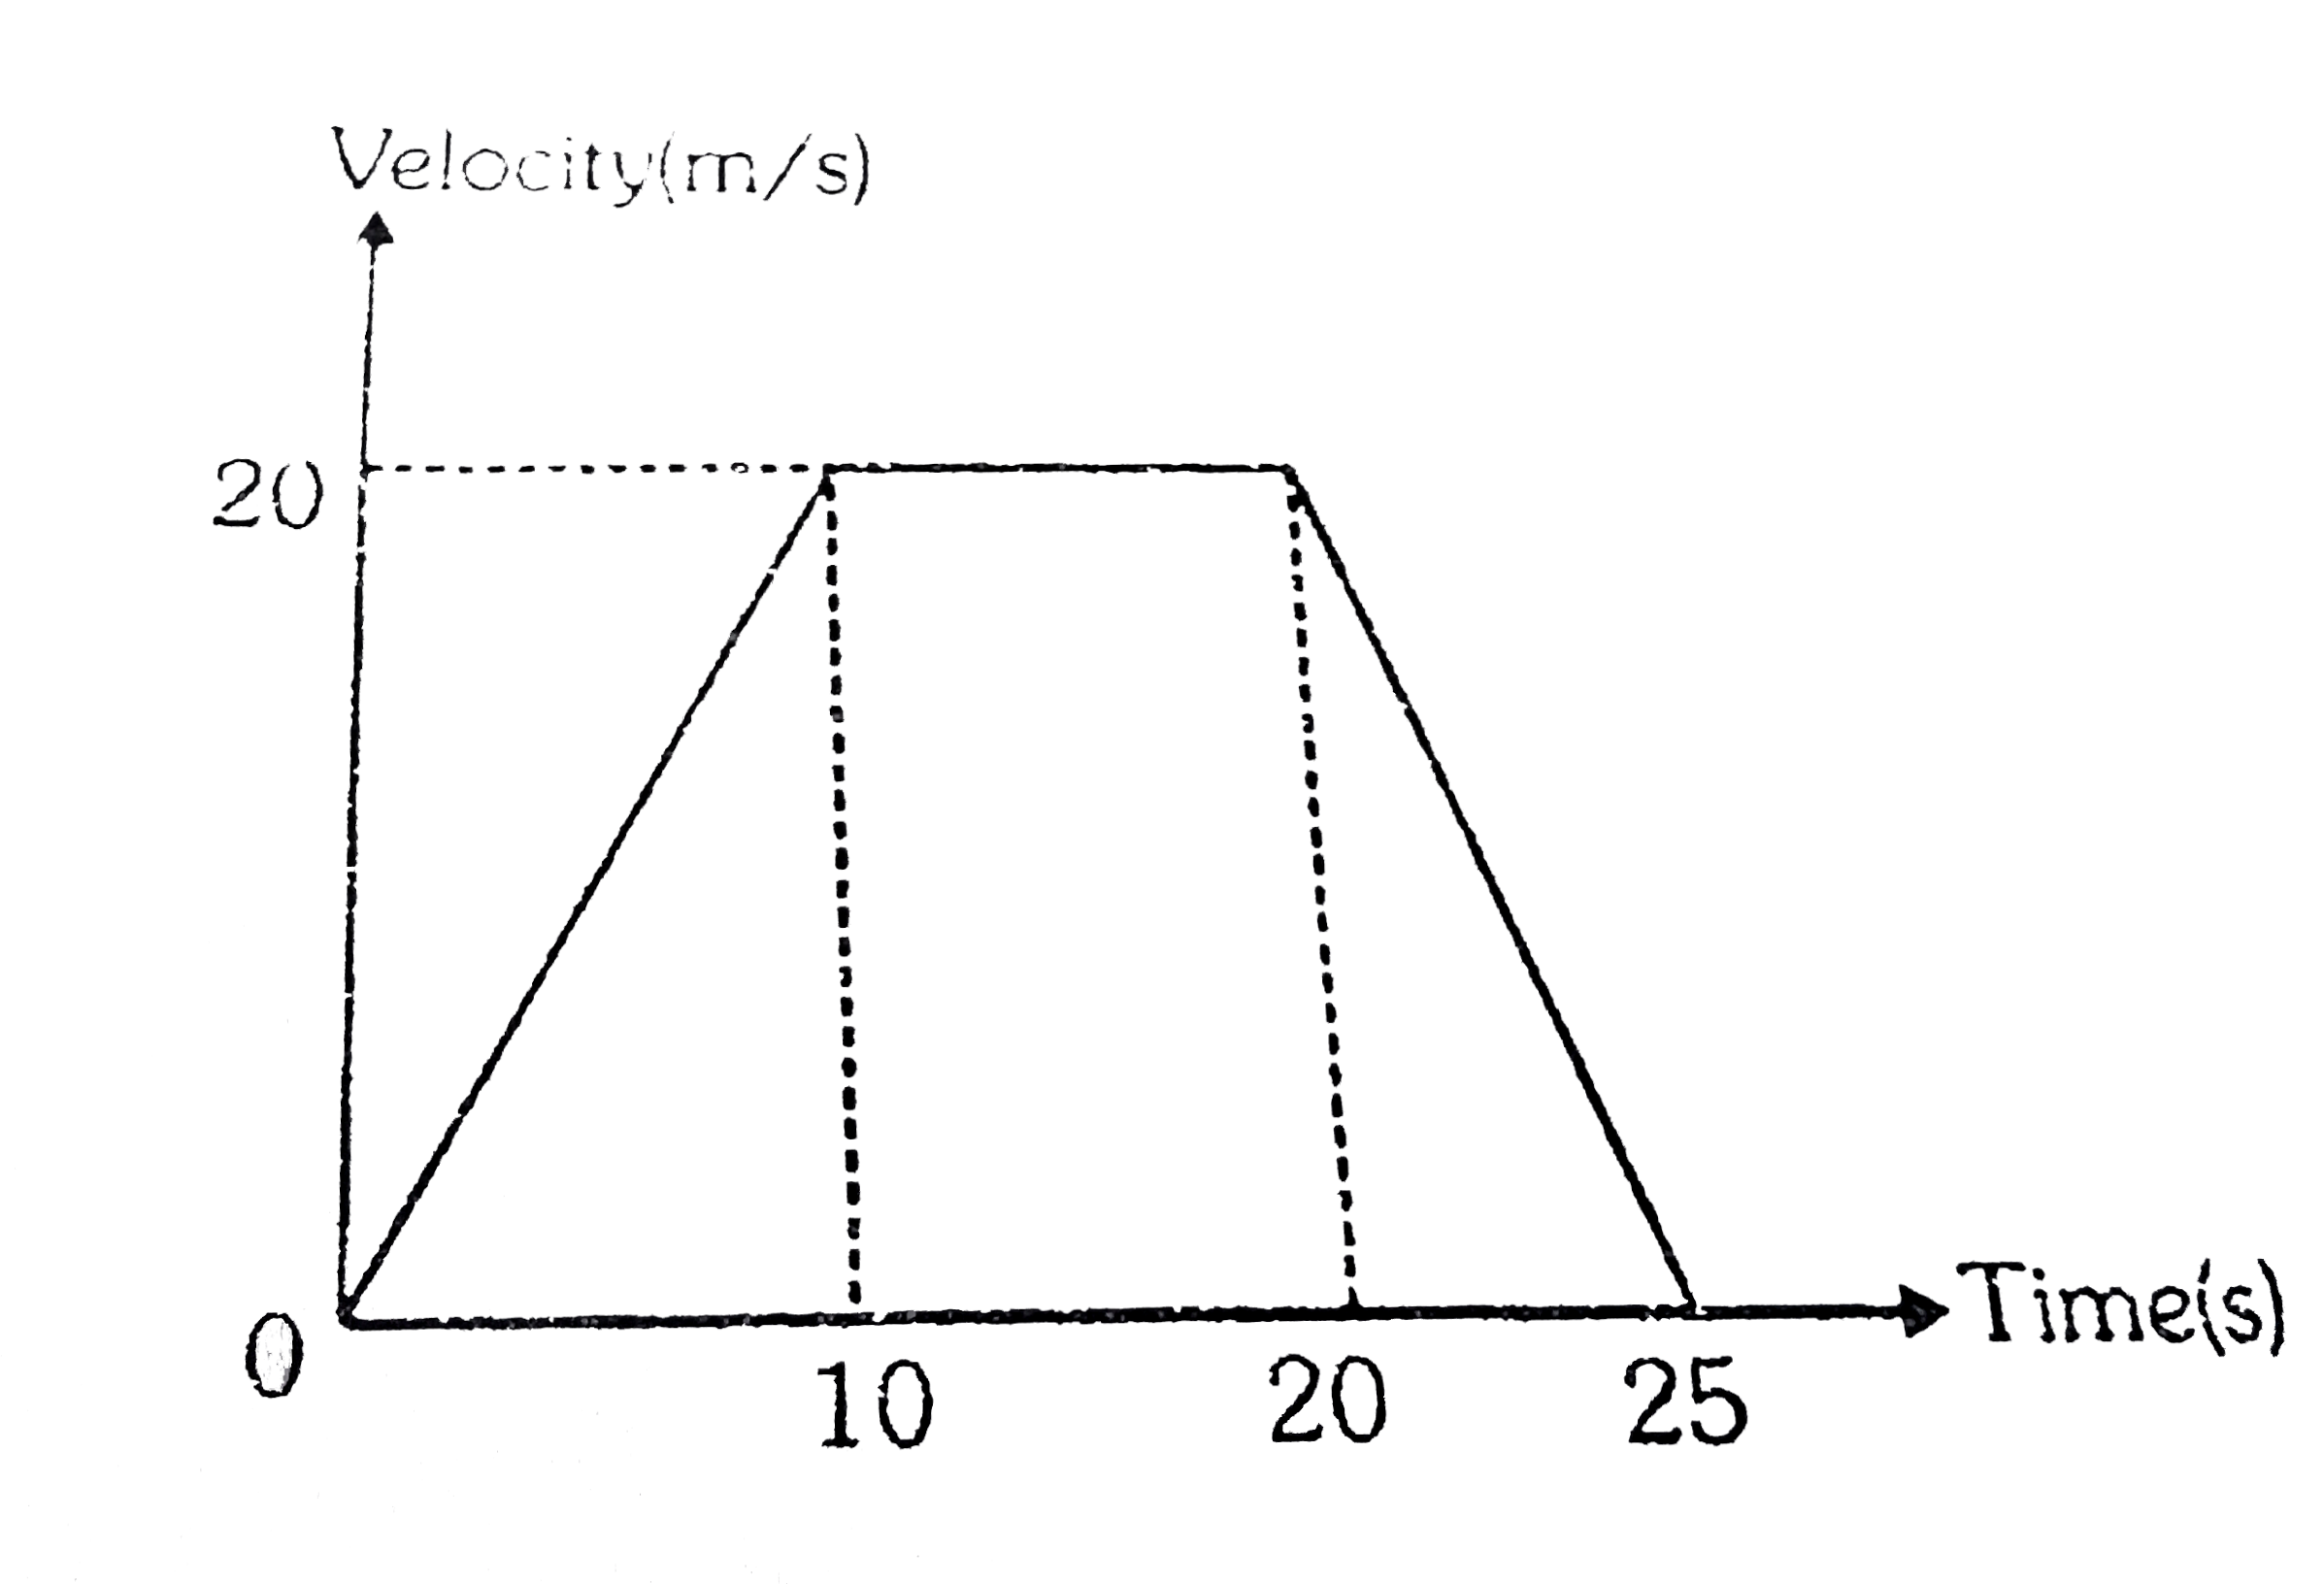
View SolutionThe velocity-time graph of a car moving along a straight road is shown in figure. The average velocity of the car is first 25 seconds is
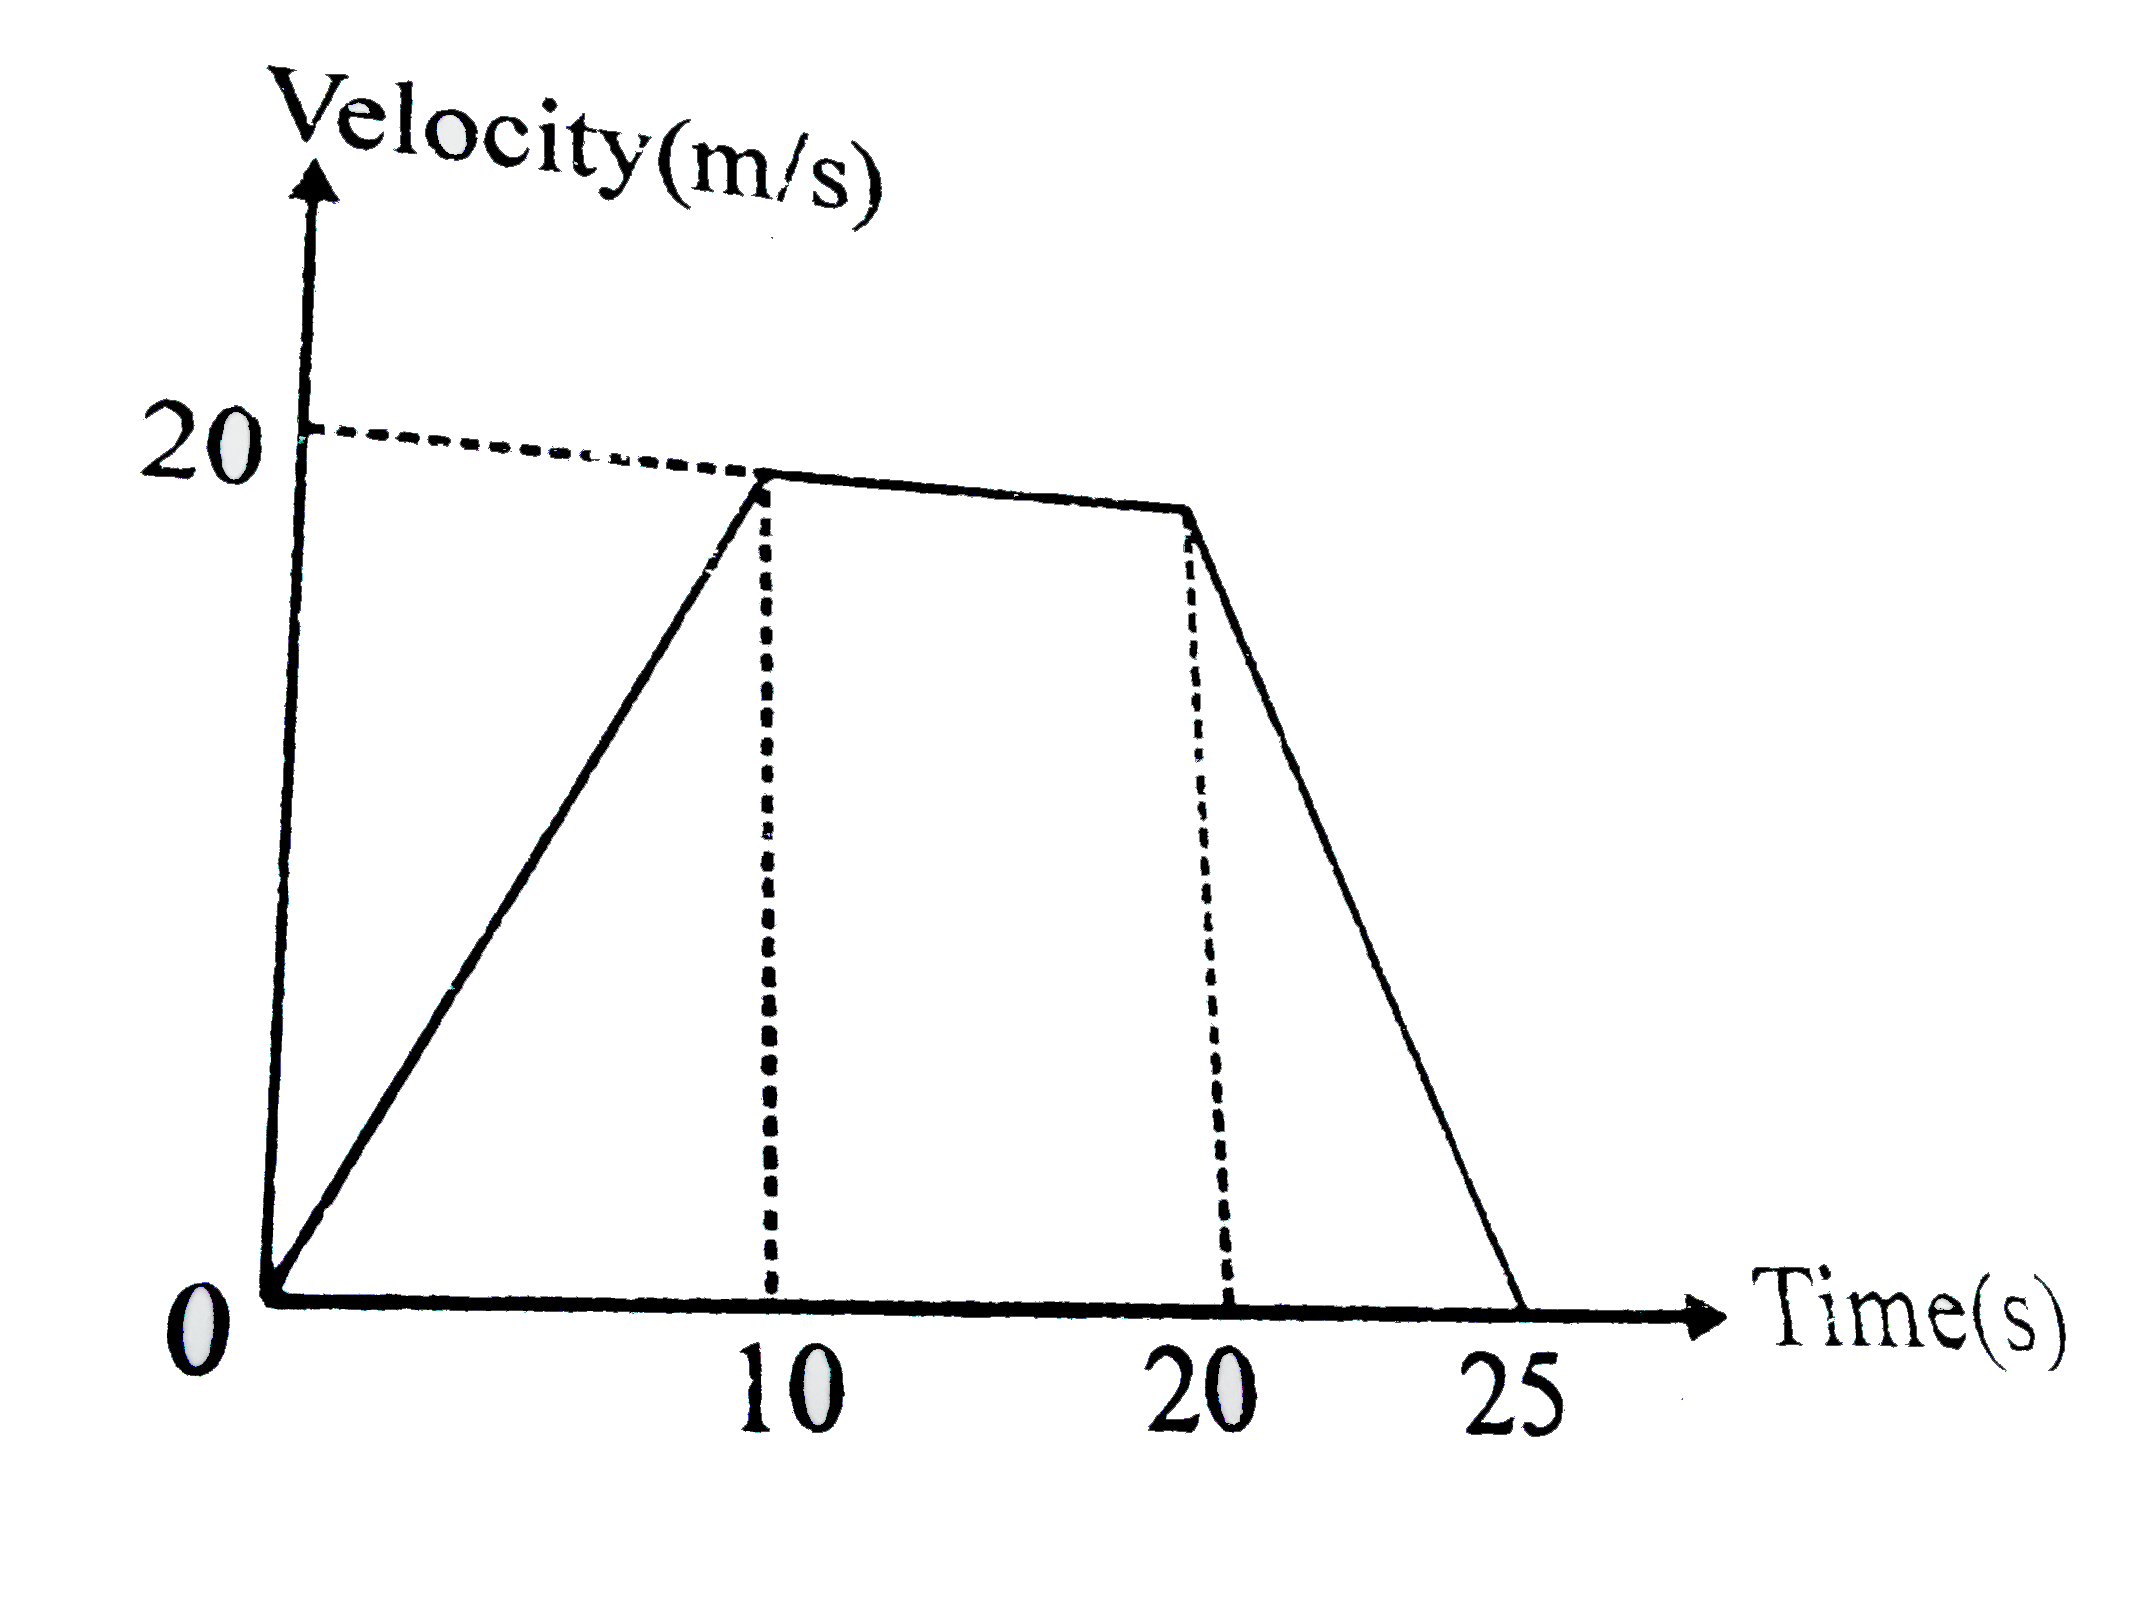
View SolutionThe velocity-time graph of a car moving along a straight road is shown in figure. The average velocity of the car in first 25 seconds is
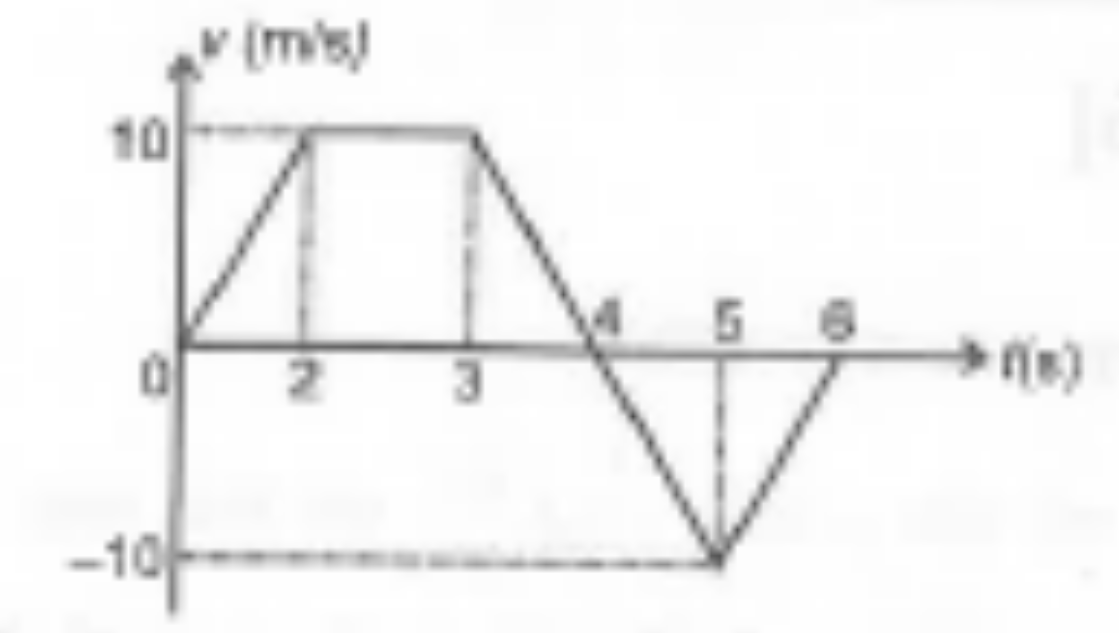
View SolutionThe velocity (v)-time (t) graph of a partide moving along a straight line is as shown in the figure. The displacement of the particle from t = 0 to t = 4 is
View SolutionThe velocity (v) - time (t) graph for a particle moving along x -axis is shown in the figure.The average velocity in the time interval t=0 to t=8s is
1)4.5ms
2) 2.5ms
3) 5ms
4)2ms
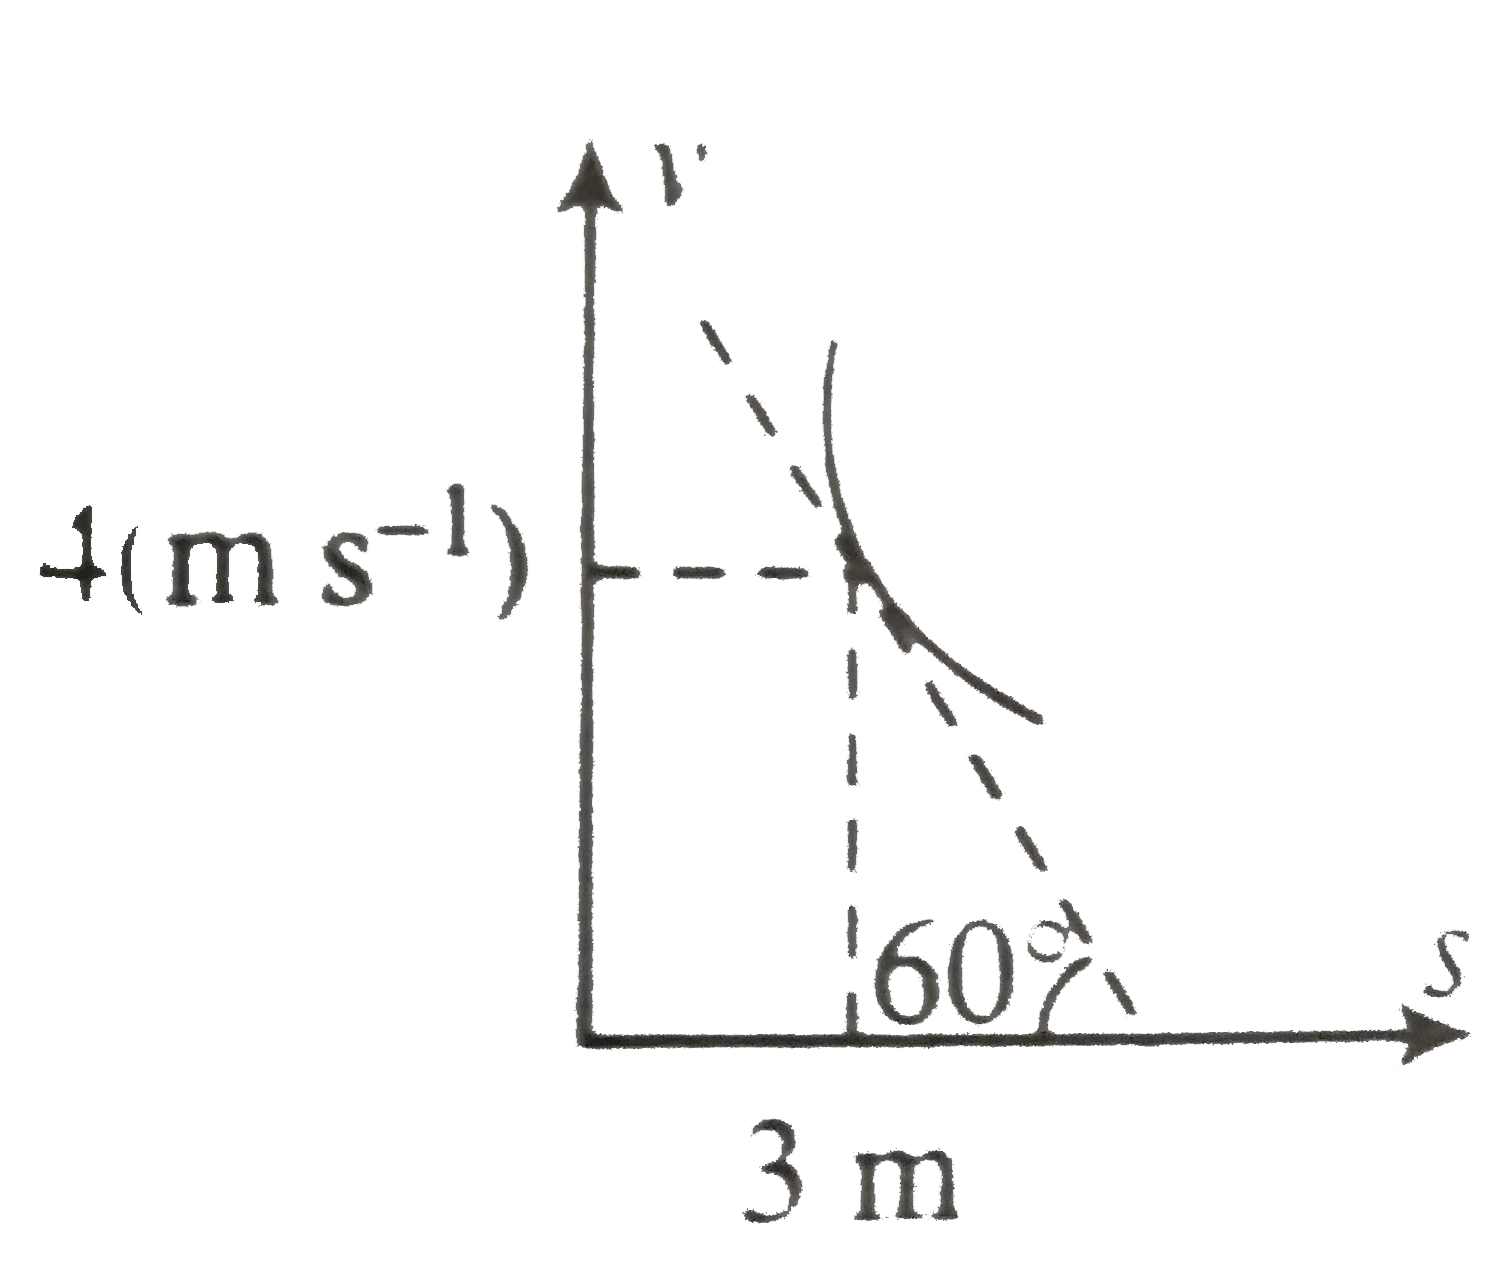
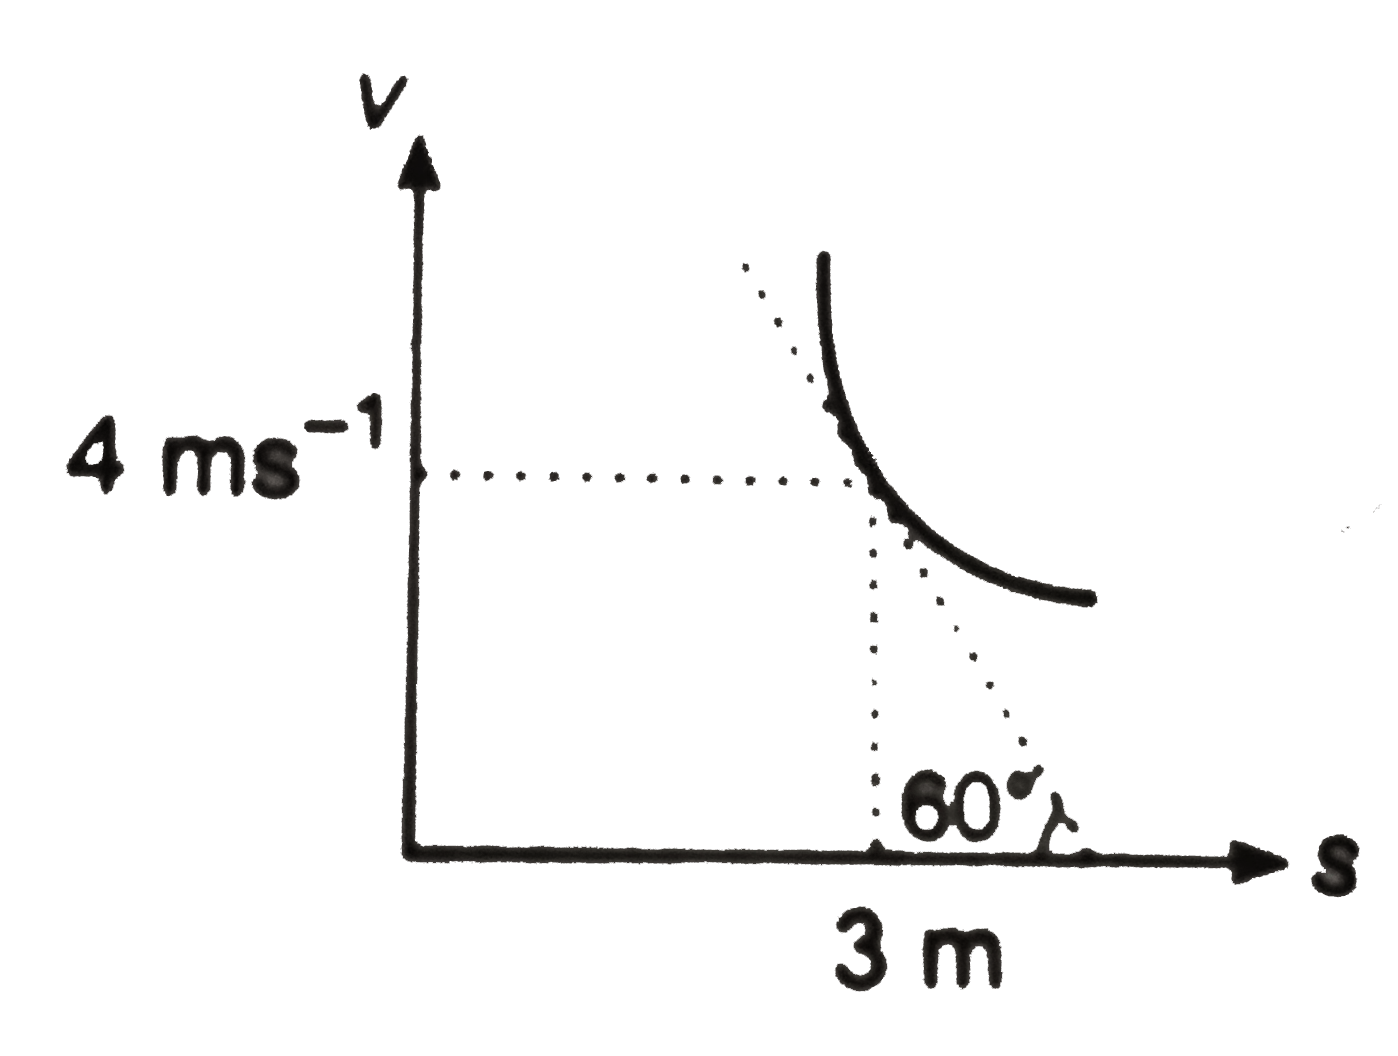
View SolutionA particle is moving along a straight line whose velocity - displacement graph is shown in figure. What is the acceleration when displacement is 3 m?
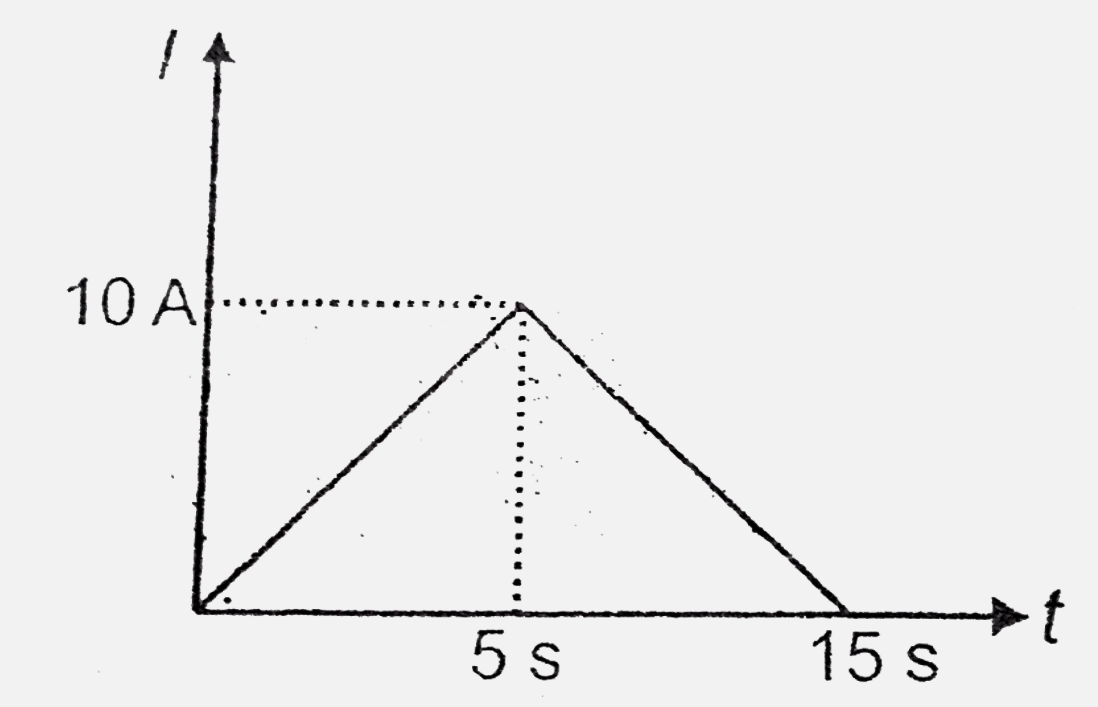
View SolutionCurrent l versus time t graph through a conductor is shown in the figure. Average current through the conductor in the interval 0 to 15 s is
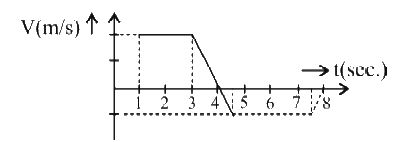
View SolutionThe velocity-time graph of a linear motion is shown in figure. The displacement from the origin after 8 sec is :
View SolutionThe displacement-time graph of a body is shown in.
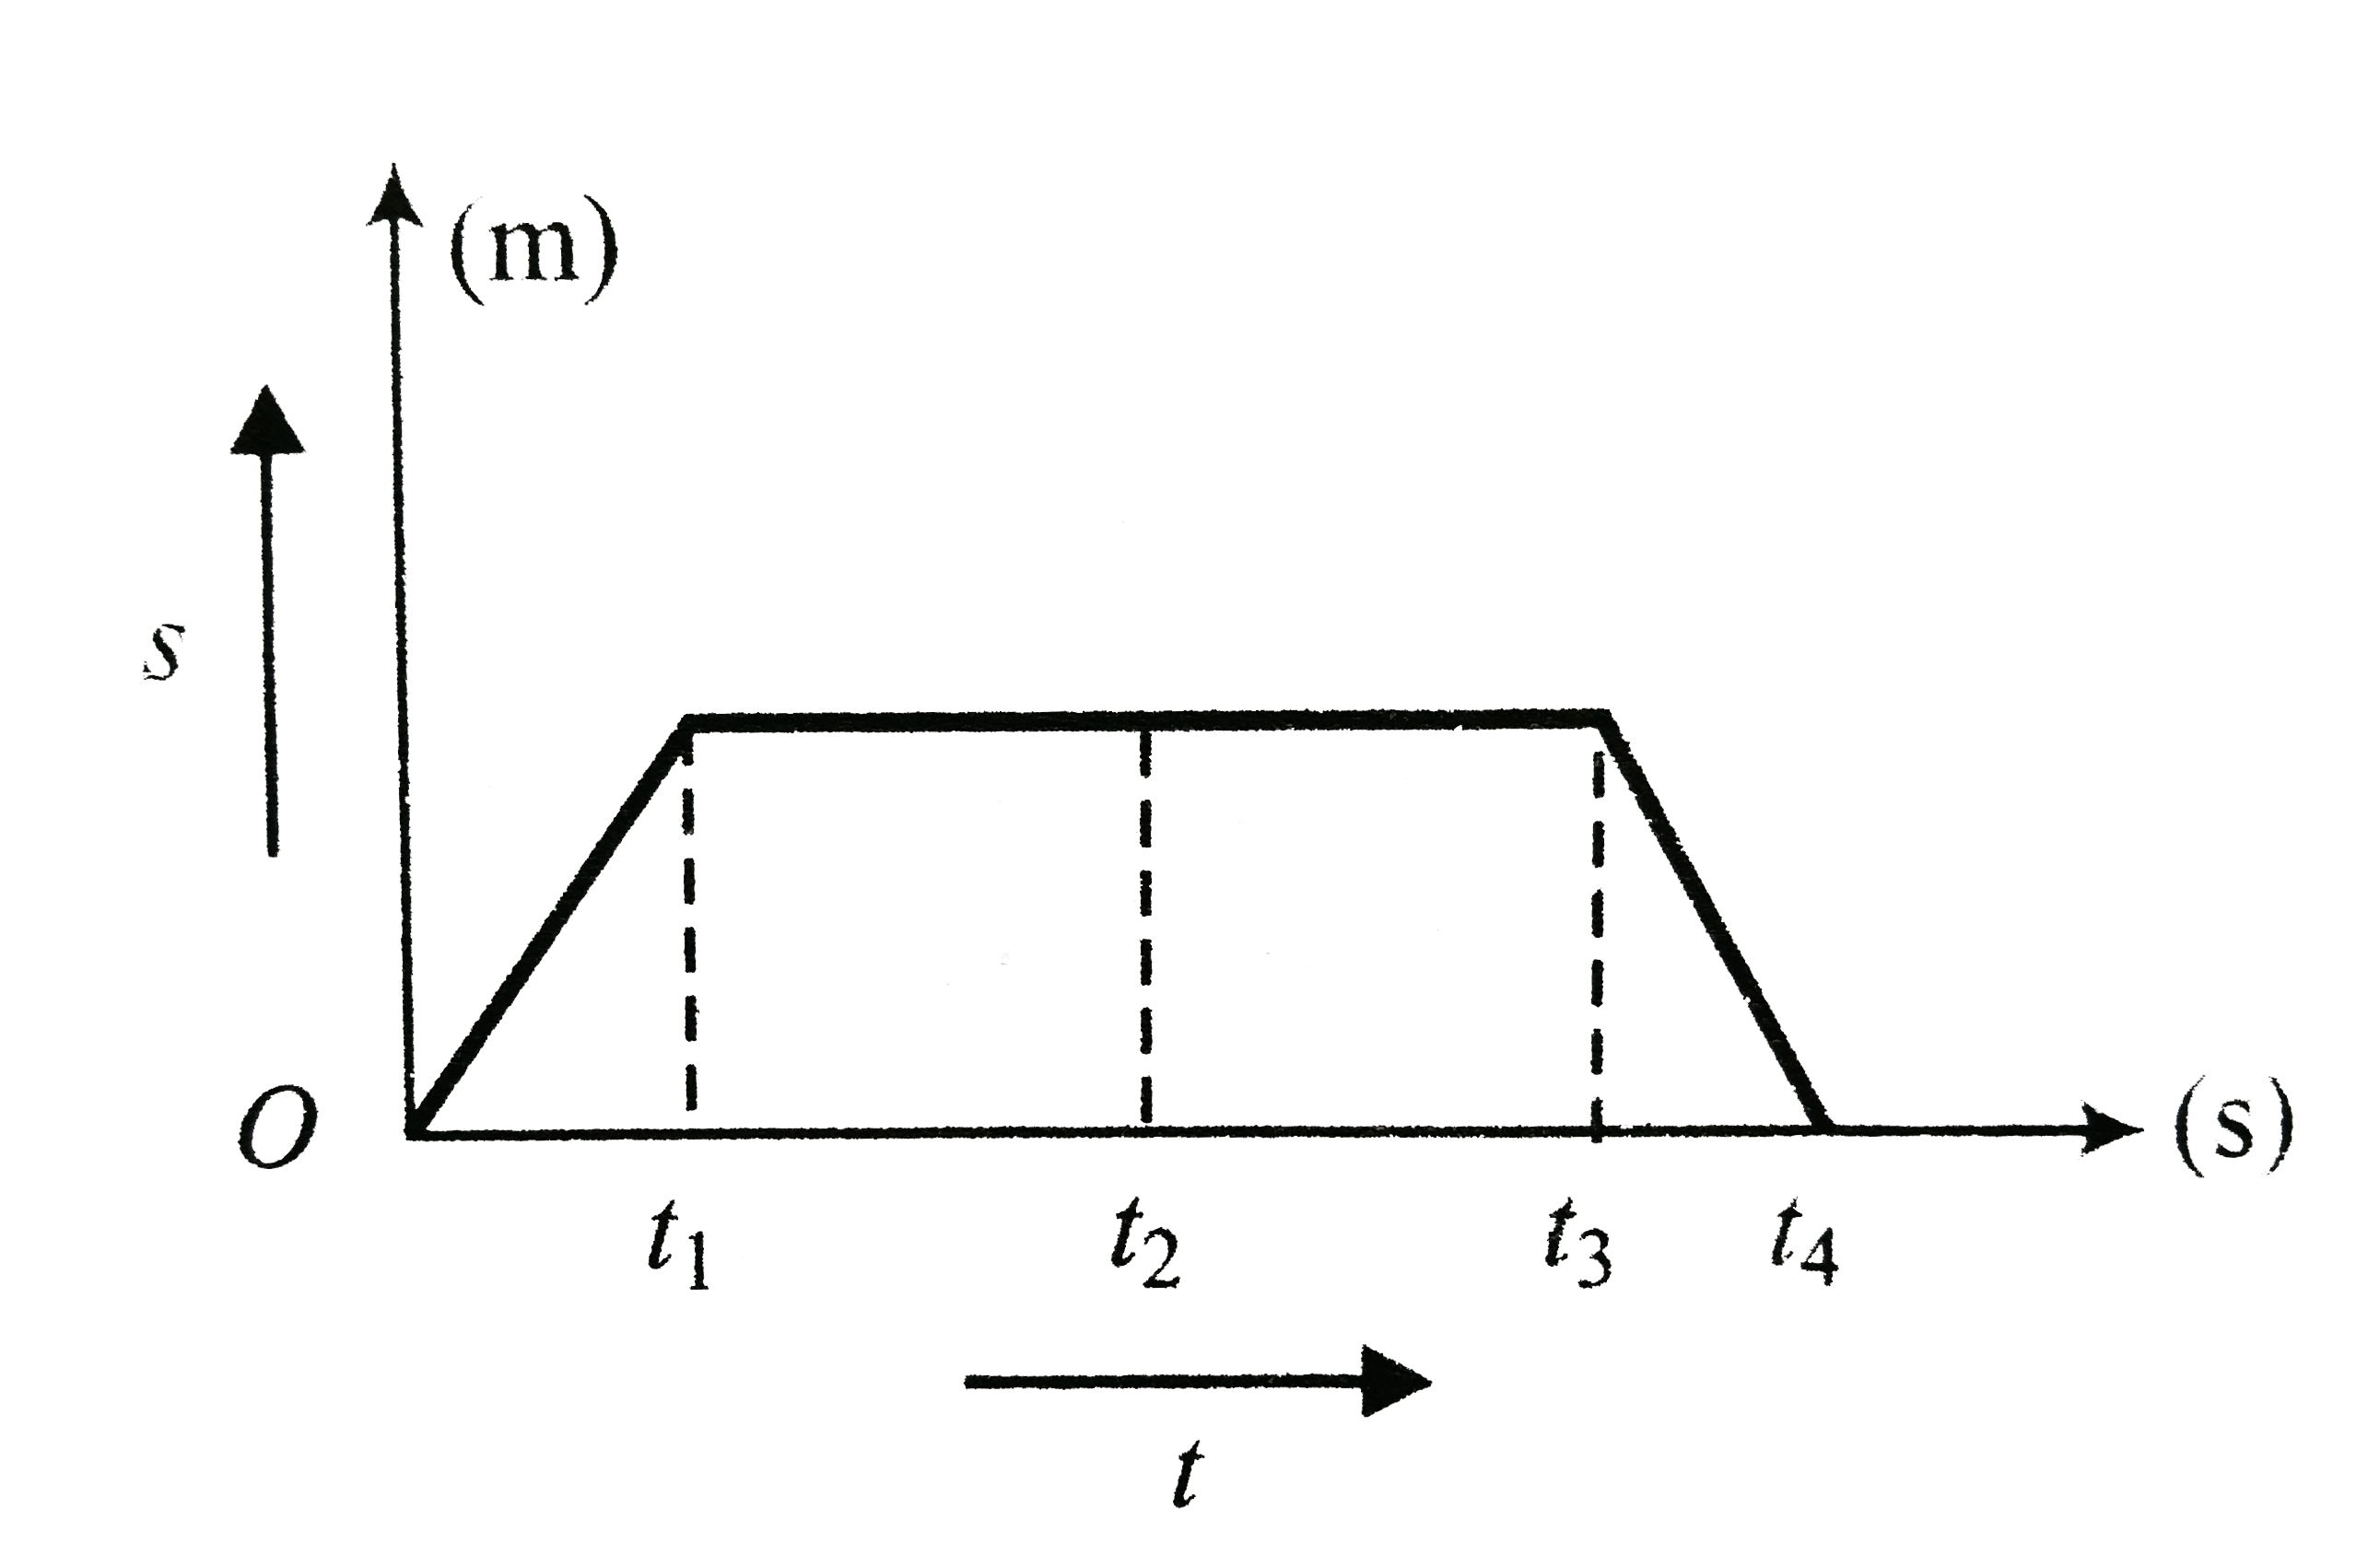 .
.
The velocity-time graph of the motion of the body will be .
View SolutionA partial along a straight line whose velocity-displacement graph is as shown in the figure. What is the magnitude of acceleration when displacement is 3 m ?
View Solution
