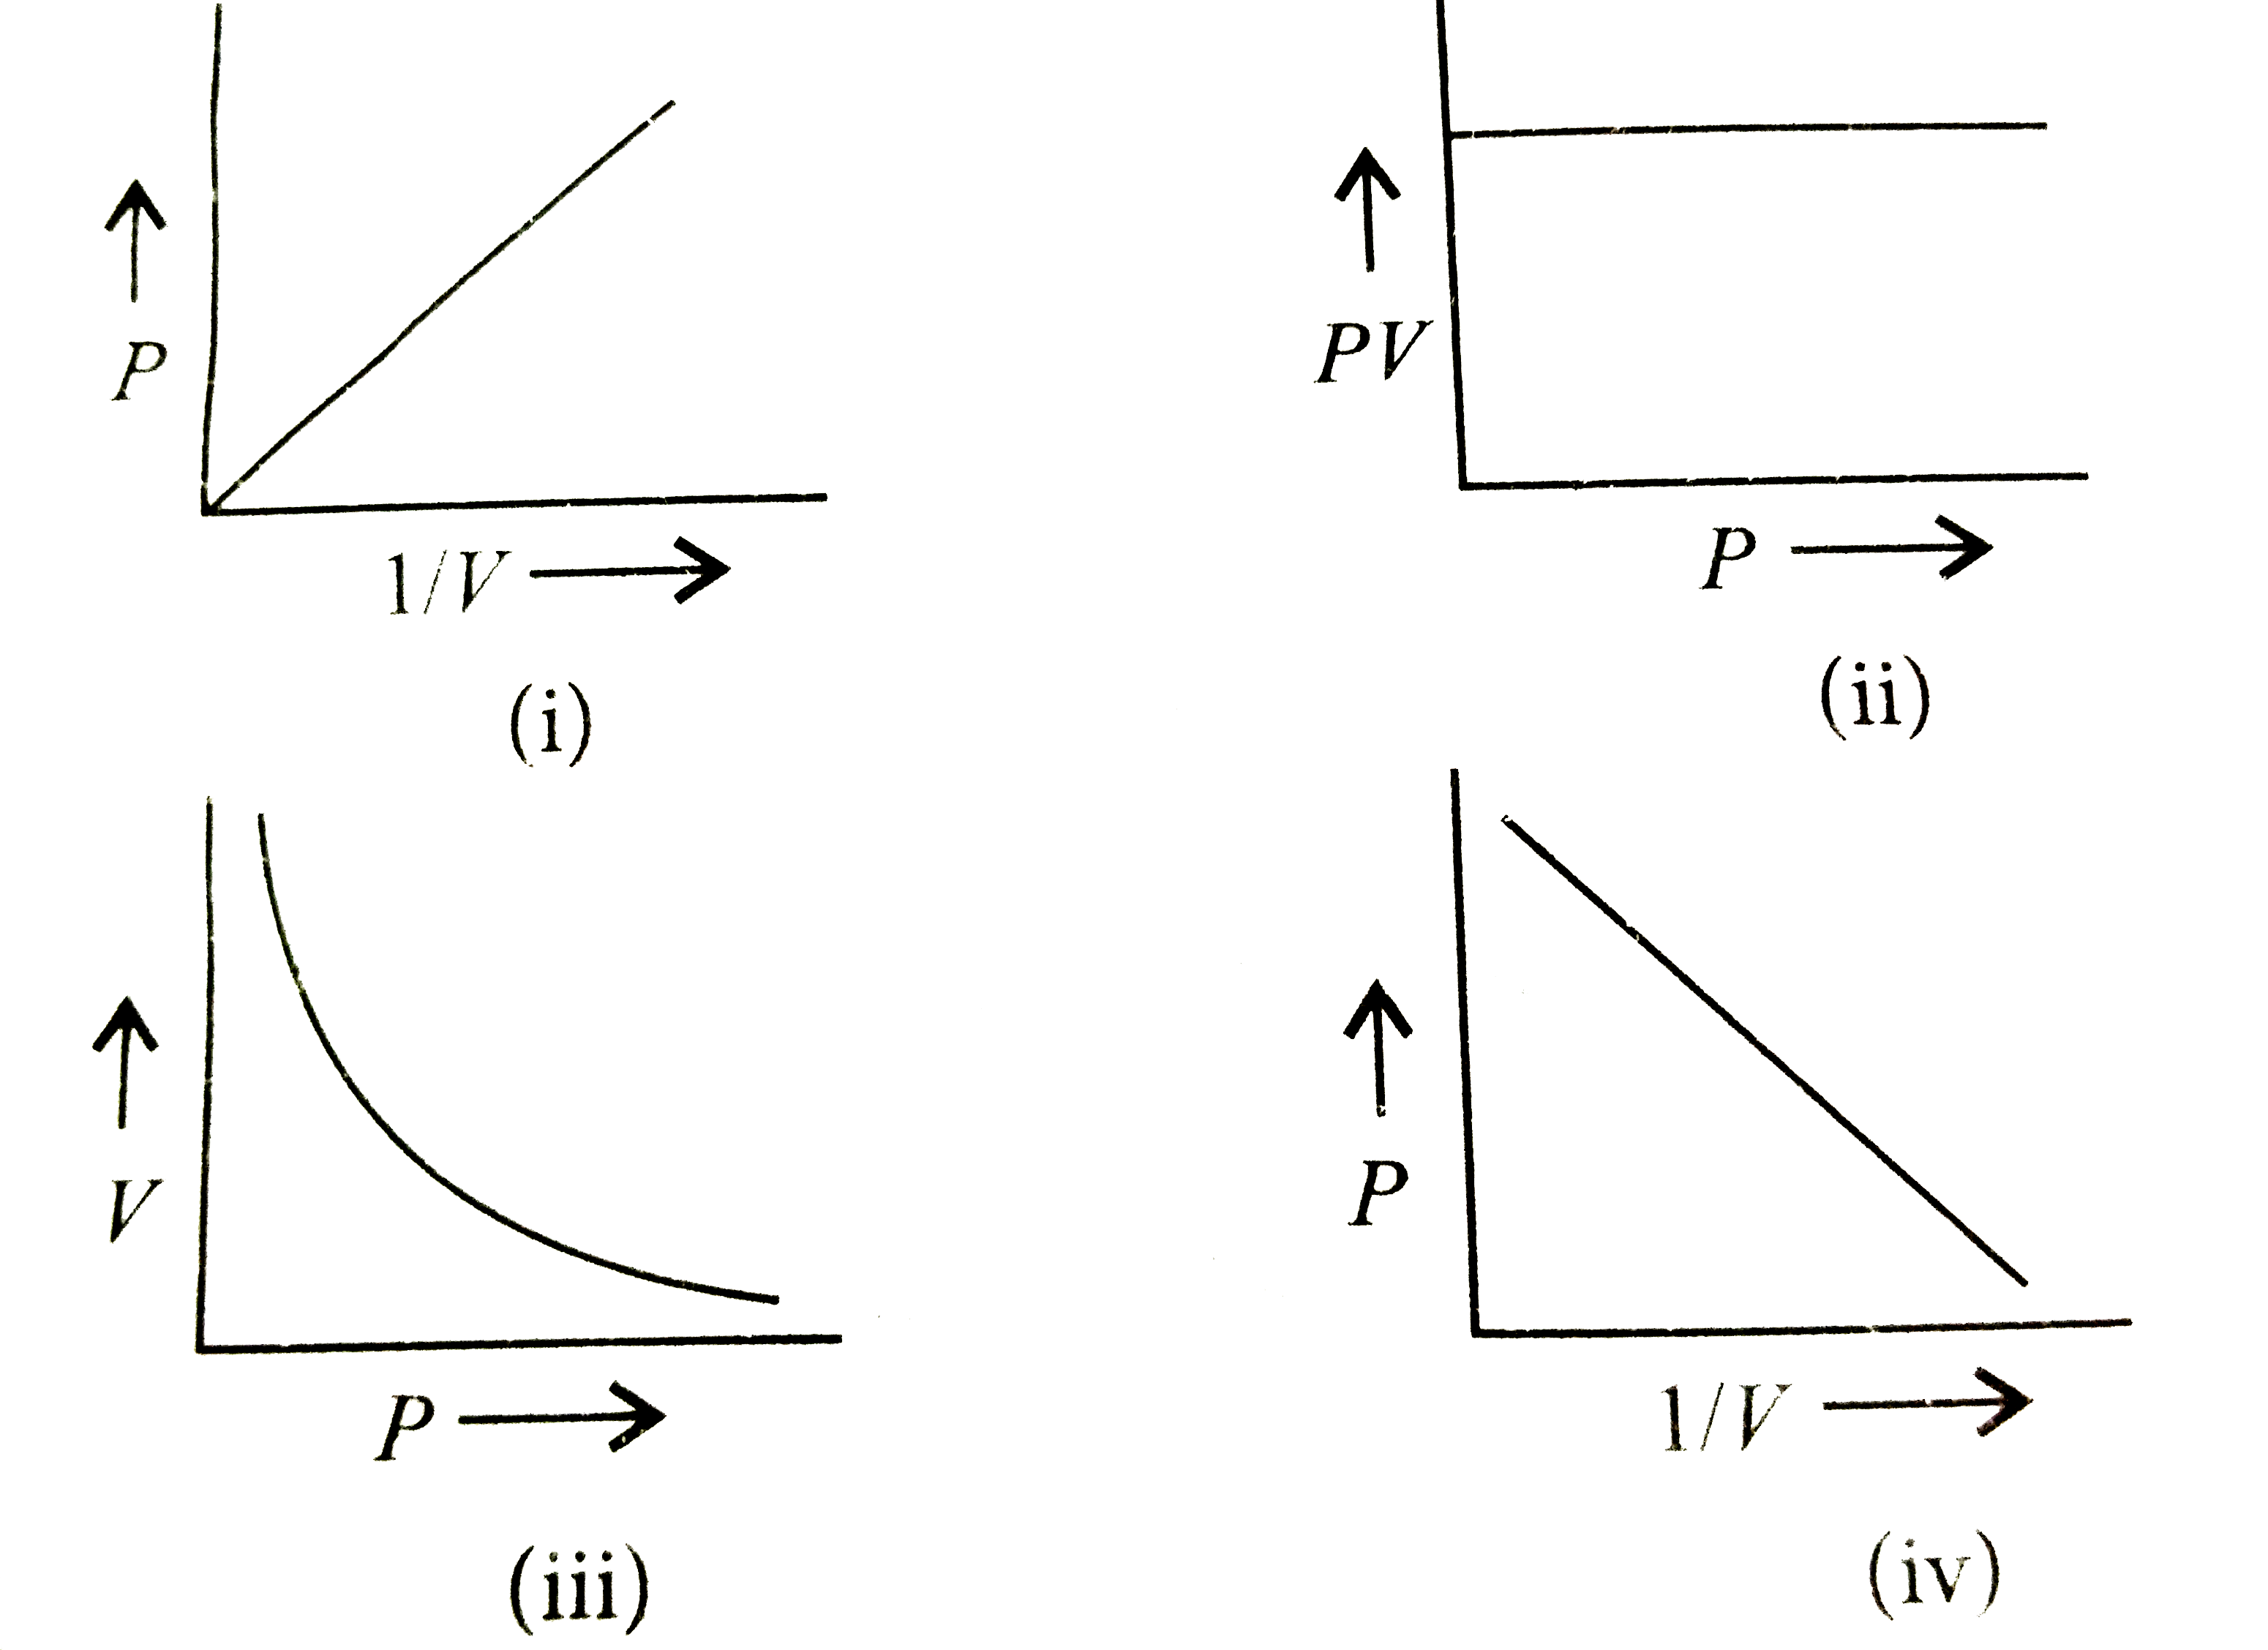
Which of the following graphs represent the behaviour of an ideal gas ?
A
Plot of PtotalvsyA (mole fraction of A in vapour) is linear
B
Plot ofPtotalvsyB is linear
C
plot of 1/PtotalvsyA is linear
D
Plot of 1/PtotalvsyB is non linear.
Video Solution
Text Solution
YA=P∘AXAPtotal
|
Topper's Solved these Questions
- THEORY OF SOLUTIONSBOOK - VMC MODULES ENGLISHCHAPTER - THEORY OF SOLUTIONSEXERCISE - LEVEL 2
65 Videos
- THEORY OF SOLUTIONSBOOK - VMC MODULES ENGLISHCHAPTER - THEORY OF SOLUTIONSEXERCISE - JEE Main (Archive)
57 Videos
- THEORY OF SOLUTIONSBOOK - VMC MODULES ENGLISHCHAPTER - THEORY OF SOLUTIONSEXERCISE - JEE Advanced (Archive)
31 Videos
- THE SOLID STATEBOOK - VMC MODULES ENGLISHCHAPTER - THE SOLID STATEEXERCISE - EXERCISE-J
10 Videos
- THERMOCHEMISTRYBOOK - VMC MODULES ENGLISHCHAPTER - THERMOCHEMISTRYEXERCISE - JEE ADVANCED (ARCHIVE)
31 Videos
Similar Questions
Knowledge Check
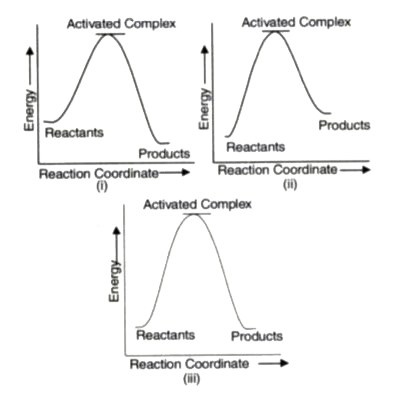
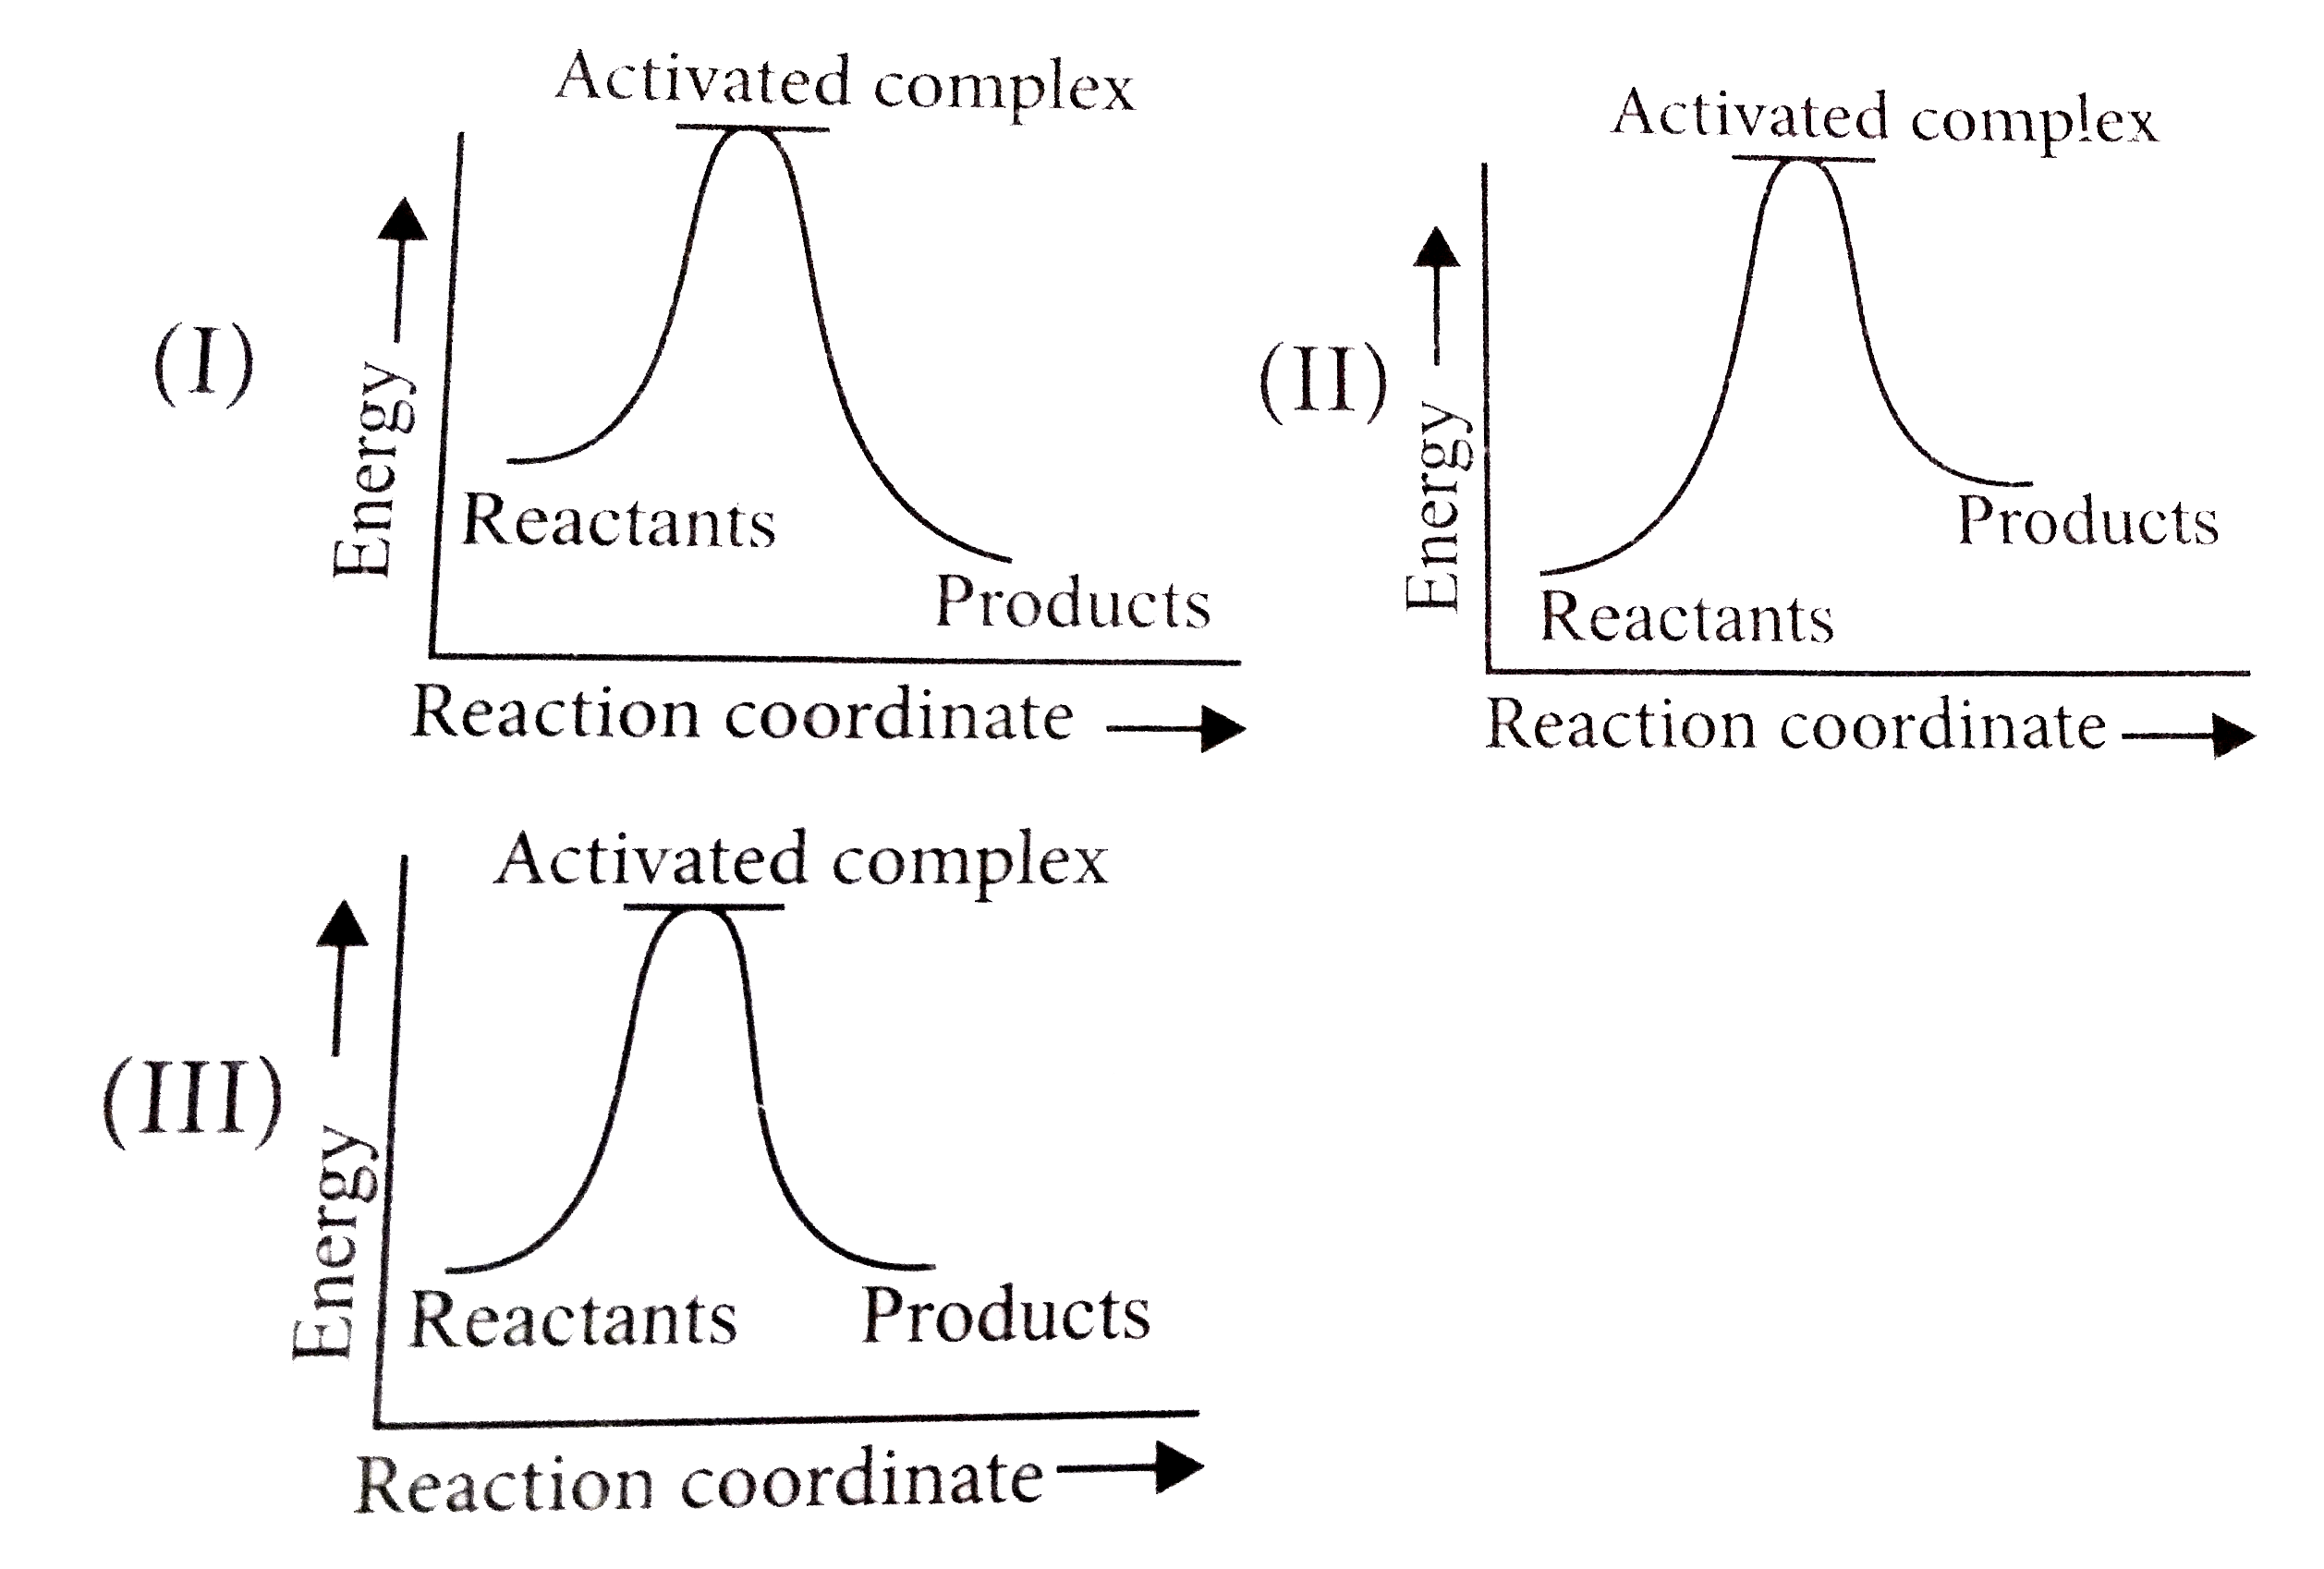
Which of the following graphs represents exothermic reaction ?
 A(i) onlyB(ii) onlyC(iii) onlyD(i) and (ii)
Which of the following graphs represents exothermic reaction ?
 A(i) onlyB(ii) onlyC(iii) onlyD(i) and (ii)
Which of the following graphs represents exothermic reaction ?
 A(i) onlyB(ii) onlyC(iii) onlyD(i) and (ii)
Which of the following graph represents uniform motion
View SolutionWhich of the following graph represents Boyle's law ?
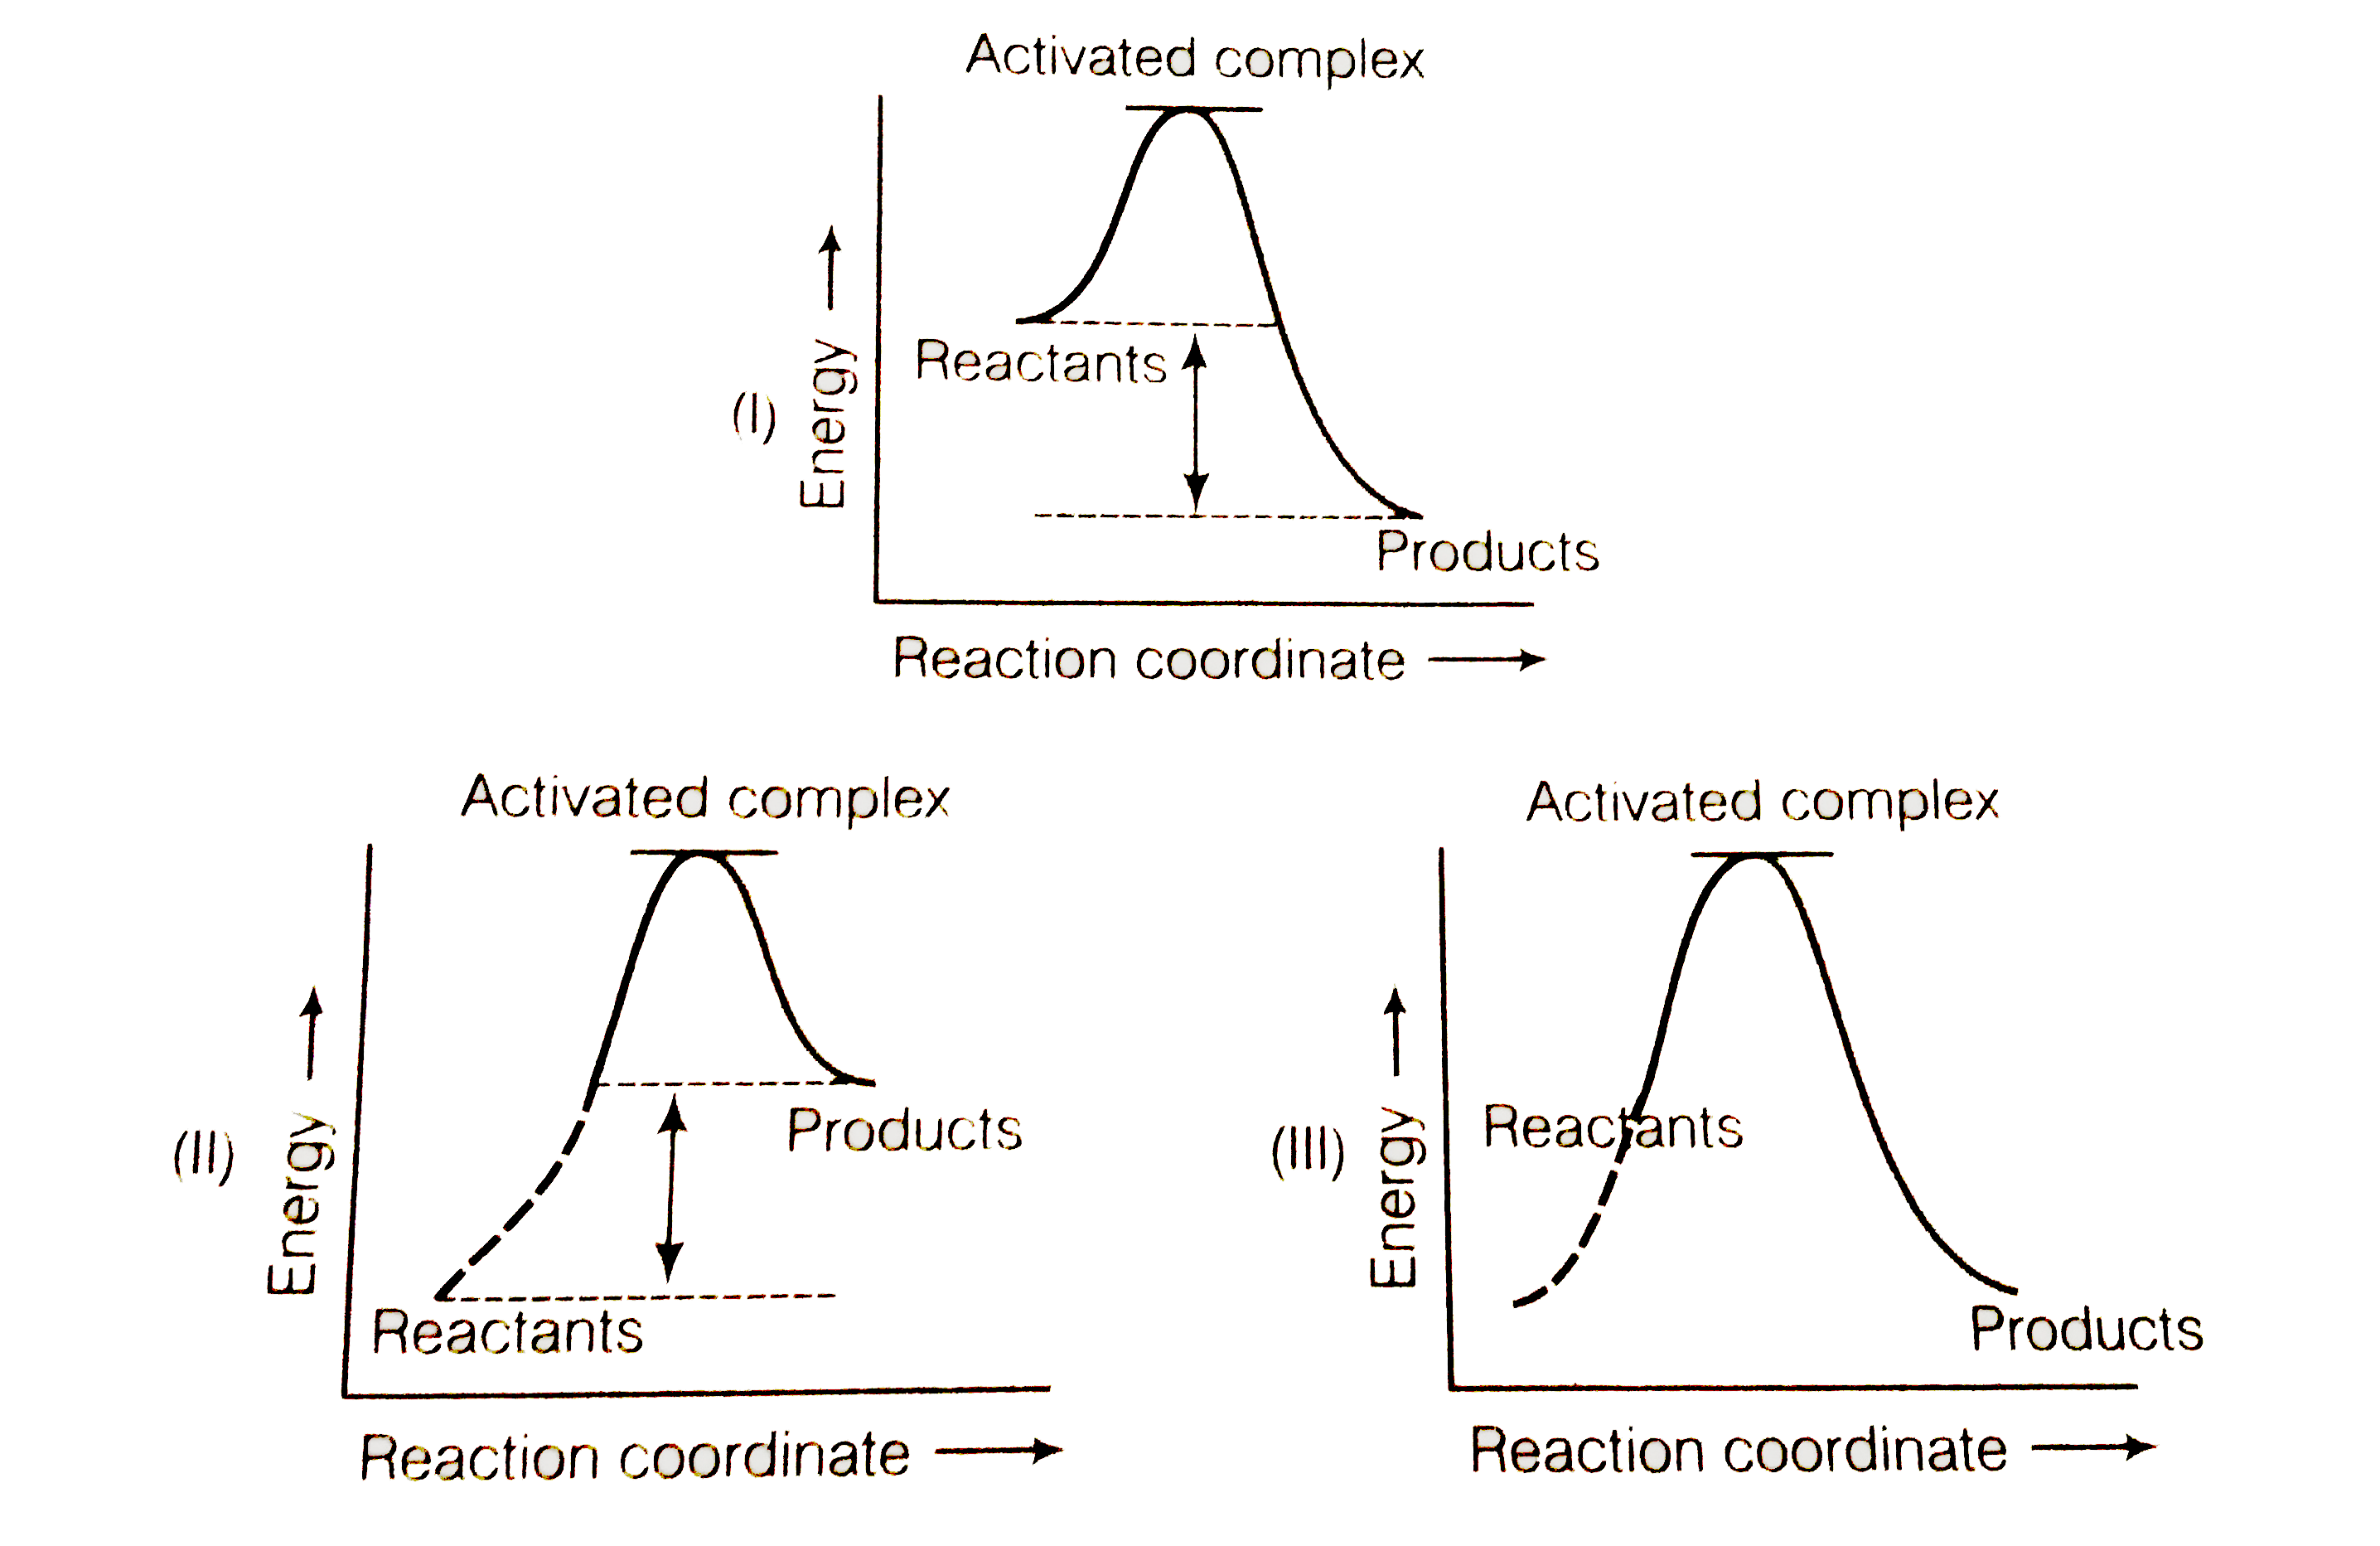
View SolutionWhich of the following graphs represents exothoermic reaction?

View SolutionWhich of the following graphs represents the correct Boyle's law ?

View SolutionWhich of the following graph represents the variation of amount of chemisorption of a gas by a solid with temperature under constant pressure?
View Solution

