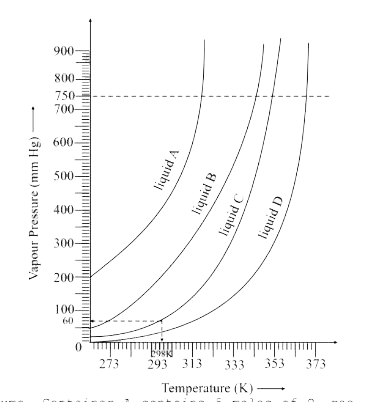
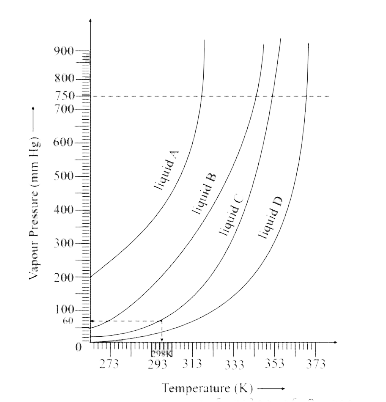
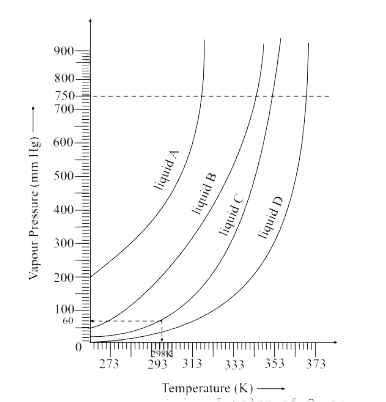
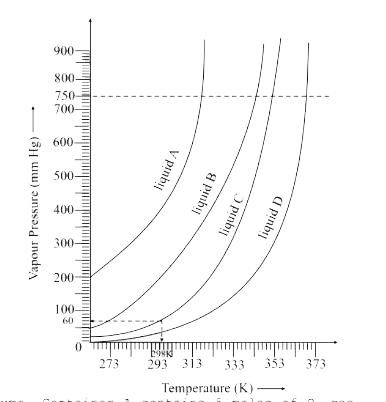
The variation of vapour pressure of different liquids with temperature is shown in figure

Calculate graphically boiling points of liquids A and B.
(i) Boiling point of A = approximately 315 K, B = approximately 345 K,
Topper's Solved these Questions
- STATES OF MATTERBOOK - VMC MODULES ENGLISHCHAPTER - STATES OF MATTEREXERCISE - Level-1
75 Videos
- STATES OF MATTERBOOK - VMC MODULES ENGLISHCHAPTER - STATES OF MATTEREXERCISE - Level-2
50 Videos
- STATES OF MATTERBOOK - VMC MODULES ENGLISHCHAPTER - STATES OF MATTEREXERCISE - LEVEL -0 ( Short Answer Type)
8 Videos
- STATES OF MATTERBOOK - VMC MODULES ENGLISHCHAPTER - STATES OF MATTEREXERCISE - IMPECCABLE
50 Videos
- STOICHIOMETRY - IBOOK - VMC MODULES ENGLISHCHAPTER - STOICHIOMETRY - IEXERCISE - JEE Advanced (Archive)
31 Videos
Similar Questions
The variation of vapour pressure of different liquids with temperature is shown in figure

At high altitude, atmospheric pressure is low (say 60 mm Hg). At what temperature liquid D boils?
View SolutionThe variation of vapour pressure of different liquids with temperature is shown in figure

If we take liquid C in a closed vessel and heat it continuously. At what temperature will it boil?
View Solution
Knowledge Check
Vapour pressure of a liquid decreases with
Adecrease in temperatureBincrease in temperatureCincrease in surface areaDincrease in volume .
The variation of vapour pressure of different liquids with temperature is shown in figure

Pressure cooker is used for cooking food at hill station. Explain in terms of vapour pressure why is it so ?
View SolutionDefine normal boiling point of a liquid.
View SolutionVapour pressure of a liquid depends on
View SolutionThe vapour pressure of a given liquid will decrease if :
View SolutionThe vapour pressure of a given liquid will increase if
View SolutionDefine vapour pressure of a liquid.
View SolutionVapour pressure of a pure liquid does not depend upon
View Solution
