A particle falls from rest under gravity. Its potential energy with respect to the ground (PE) and its kinetic energy (KE) are plotted against time (t). Choose the correct graph.
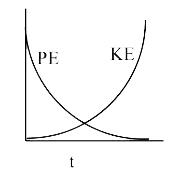
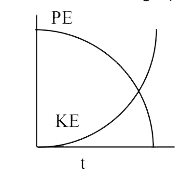
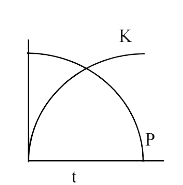
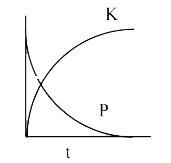
The correct Answer is:B
To solve the problem of a particle falling from rest under gravity and to analyze its potential energy (PE) and kinetic energy (KE) with respect to time (t), we can follow these steps:
Step 1: Understand the Initial Conditions
The particle starts from rest at a height h. Therefore, at t=0:
- Potential Energy (PE) = mgh (maximum)
- Kinetic Energy (KE) = 0 (minimum)
Step 2: Analyze the Motion of the Particle
As the particle falls under the influence of gravity:
- The potential energy decreases as the height decreases.
- The kinetic energy increases as the particle gains speed.
Step 3: Write the Equations for PE and KE
1. Potential Energy (PE):
The potential energy at any height h is given by:
PE=mgh
As the particle falls, the height h decreases. The height at time t can be expressed using the equation of motion:
h(t)=h−12gt2
Therefore, the potential energy as a function of time becomes:
PE(t)=mg(h−12gt2)=mgh−12mgt2
2. Kinetic Energy (KE):
The velocity v of the particle at time t is given by:
v(t)=gt
The kinetic energy can be expressed as:
KE=12mv2=12m(gt)2=12mg2t2
Step 4: Determine the Nature of the Graphs
- Potential Energy (PE):
The equation PE(t)=mgh−12mgt2 is a downward-facing parabola because the coefficient of t2 is negative. It starts at a maximum value mgh when t=0 and decreases to 0 as the particle reaches the ground.
- Kinetic Energy (KE):
The equation KE(t)=12mg2t2 is an upward-facing parabola because the coefficient of t2 is positive. It starts at 0 when t=0 and increases as the particle falls.
Step 5: Choose the Correct Graph
Based on the analysis:
- The graph of potential energy (PE) will be a downward-facing parabola starting from mgh at t=0 and approaching 0 as t increases.
- The graph of kinetic energy (KE) will be an upward-facing parabola starting from 0 at t=0 and increasing indefinitely as time progresses.
Thus, the correct graph will show:
- PE as a downward parabola starting from mgh.
- KE as an upward parabola starting from 0.
Conclusion
The correct option is the one that shows the potential energy decreasing from mgh to 0 and the kinetic energy increasing from 0 to a maximum value as time progresses.
---
The particle starts from rest at a height h. Therefore, at t=0:
- Potential Energy (PE) = mgh (maximum)
- Kinetic Energy (KE) = 0 (minimum)
As the particle falls under the influence of gravity:
- The potential energy decreases as the height decreases.
- The kinetic energy increases as the particle gains speed.
1. Potential Energy (PE):
The potential energy at any height h is given by:
PE=mgh
As the particle falls, the height h decreases. The height at time t can be expressed using the equation of motion:
h(t)=h−12gt2
Therefore, the potential energy as a function of time becomes:
PE(t)=mg(h−12gt2)=mgh−12mgt2
The velocity v of the particle at time t is given by:
v(t)=gt
The kinetic energy can be expressed as:
KE=12mv2=12m(gt)2=12mg2t2
- Potential Energy (PE):
The equation PE(t)=mgh−12mgt2 is a downward-facing parabola because the coefficient of t2 is negative. It starts at a maximum value mgh when t=0 and decreases to 0 as the particle reaches the ground.
The equation KE(t)=12mg2t2 is an upward-facing parabola because the coefficient of t2 is positive. It starts at 0 when t=0 and increases as the particle falls.
Based on the analysis:
- The graph of potential energy (PE) will be a downward-facing parabola starting from mgh at t=0 and approaching 0 as t increases.
- The graph of kinetic energy (KE) will be an upward-facing parabola starting from 0 at t=0 and increasing indefinitely as time progresses.
- PE as a downward parabola starting from mgh.
- KE as an upward parabola starting from 0.
The correct option is the one that shows the potential energy decreasing from mgh to 0 and the kinetic energy increasing from 0 to a maximum value as time progresses.
Topper's Solved these Questions
- ENERGY & MOMENTUMBOOK - VMC MODULES ENGLISHCHAPTER - ENERGY & MOMENTUMEXERCISE - Level - 1 PARAGRAPH QUESTIONS
3 Videos
- ENERGY & MOMENTUMBOOK - VMC MODULES ENGLISHCHAPTER - ENERGY & MOMENTUMEXERCISE - LEVEL - 2
48 Videos
- ENERGY & MOMENTUMBOOK - VMC MODULES ENGLISHCHAPTER - ENERGY & MOMENTUMEXERCISE - LEVEL - 0 - LONG ANSWER TYPE
5 Videos
- ELECTROSTATICSBOOK - VMC MODULES ENGLISHCHAPTER - ELECTROSTATICSEXERCISE - JEE Advanced (Archive)
89 Videos
- GASEOUS STATE & THERMODYNAMICSBOOK - VMC MODULES ENGLISHCHAPTER - GASEOUS STATE & THERMODYNAMICSEXERCISE - JEE ADVANCED (ARCHIVE )
111 Videos
Similar Questions
Potential energy (PEn) and kinetic energy (KEn) of electron in nth orbit are related as
View SolutionA body performs S.H.M. Its kinetic energy K varies with time t as indicated by graph
View SolutionWhen an apple falls from a tree what happens to its gravitational potential energy just as it reaches the ground? After it strikes the ground?
View SolutionA freely falling object eventually stops on reaching the ground. What happens to its kinetic energy ?
View SolutionAn alpha particle is accelerated from rest through a potential difference of 100 volt. Its final kinetic energy is
View SolutionA particle starts moving from the origin & moves along positive x-direction. Its rate of change of kinetic energy with time shown on y-axis varies with time t as shown in the graph. If position, velocity acceleration & kinetic energy of the particle at any time t are x,v a & k respectively then which of the option (s) may be correct ?
View SolutionFor a simple pendulum, a graph is plotted between itskinetic energy (KE) and potential energy (PE)against its displacement d. Which one of the following represents these correctly? (graph are schematic and not drawn to scale)
View SolutionA particle is released from height H. At certain height from the ground its kinetic energy is twice its gravitational potential energy. Find the height and speed of particle at that height.
View SolutionA particle starts moving from rest the origin & moves along positive x− direction . Its rate of change of kinetic energy with time shown on y− axis veries with time t as shown in the graph. If position, velocity , acceleration & kinetic energy of the particle at any time t are x,v,a,&k respectively then which of the option (s) may be correct ?

View SolutionThe potential energy of a projectile at its maximum height is equal to its kinetic energy there. Its range for velocity of projection u is
View Solution
