A student performed an experiment to measure - pressure and volume of a gas at constant temperature and noted the following:

Calculate the value of x and y. Which law was used in the calculations ? Draw graphs to show:
PV plotted against pressure
Similar Questions
A student performed an experiment to measure - pressure and volume of a gas at constant temperature and noted the following:

Calculate the value of x and y. Which law was used in the calculations ? Draw graphs to show:
volume plotted against pressure.
View SolutionA student performed an experiment to measure pressure and volume of a gas at constant temperature and noted the following:
Pressure (mm of Hg)Volume(cm3)10080125x20040y32
Calculate the value of x and y. Which law was used in the calculation ? Draw a suitable graph.
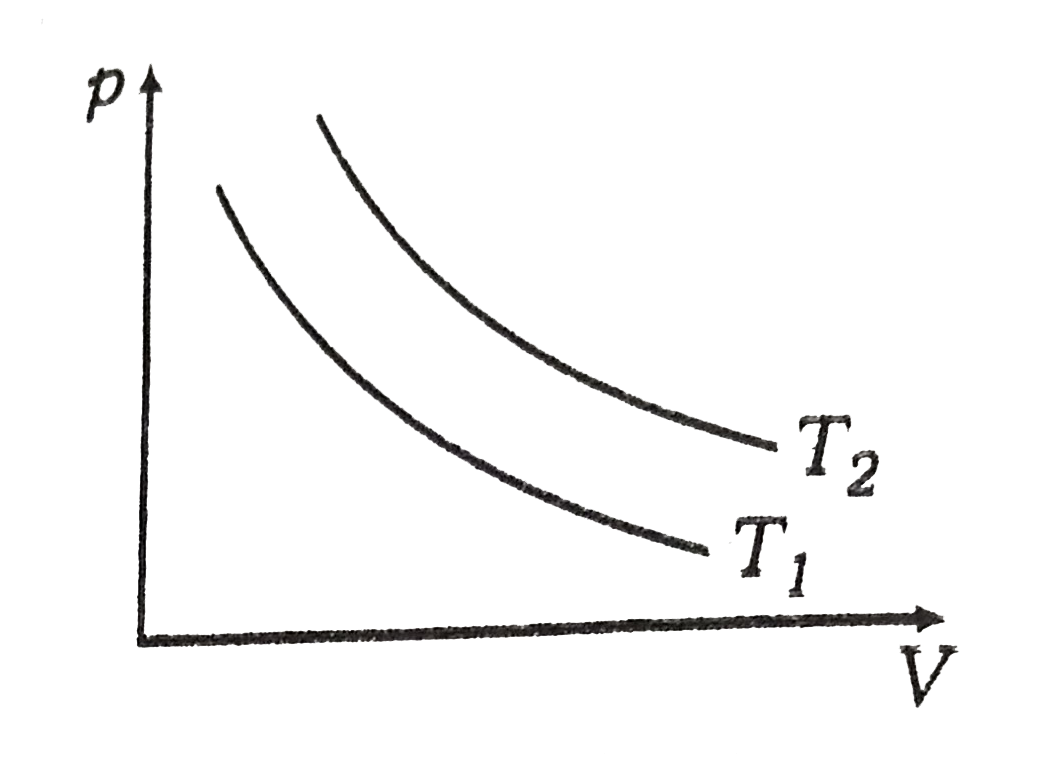
View SolutionThe adjoining fgure shows graph of pressure and volume of a gas at two temperatures T1 and T2 Which one the following is correct

View SolutionAt constant temperature, the effect of change of pressure on volume of a gas was as given below

Plot the following graphs :
P vs V
View SolutionAt constant temperature, the effect of change of pressure on volume of a gas was as given below

Plot the following graphs :
PV vs P.
View SolutionAt constant temperature, the effect of change of pressure on volume of a gas was as given below

Plot the following graphs :
P vs 1/V
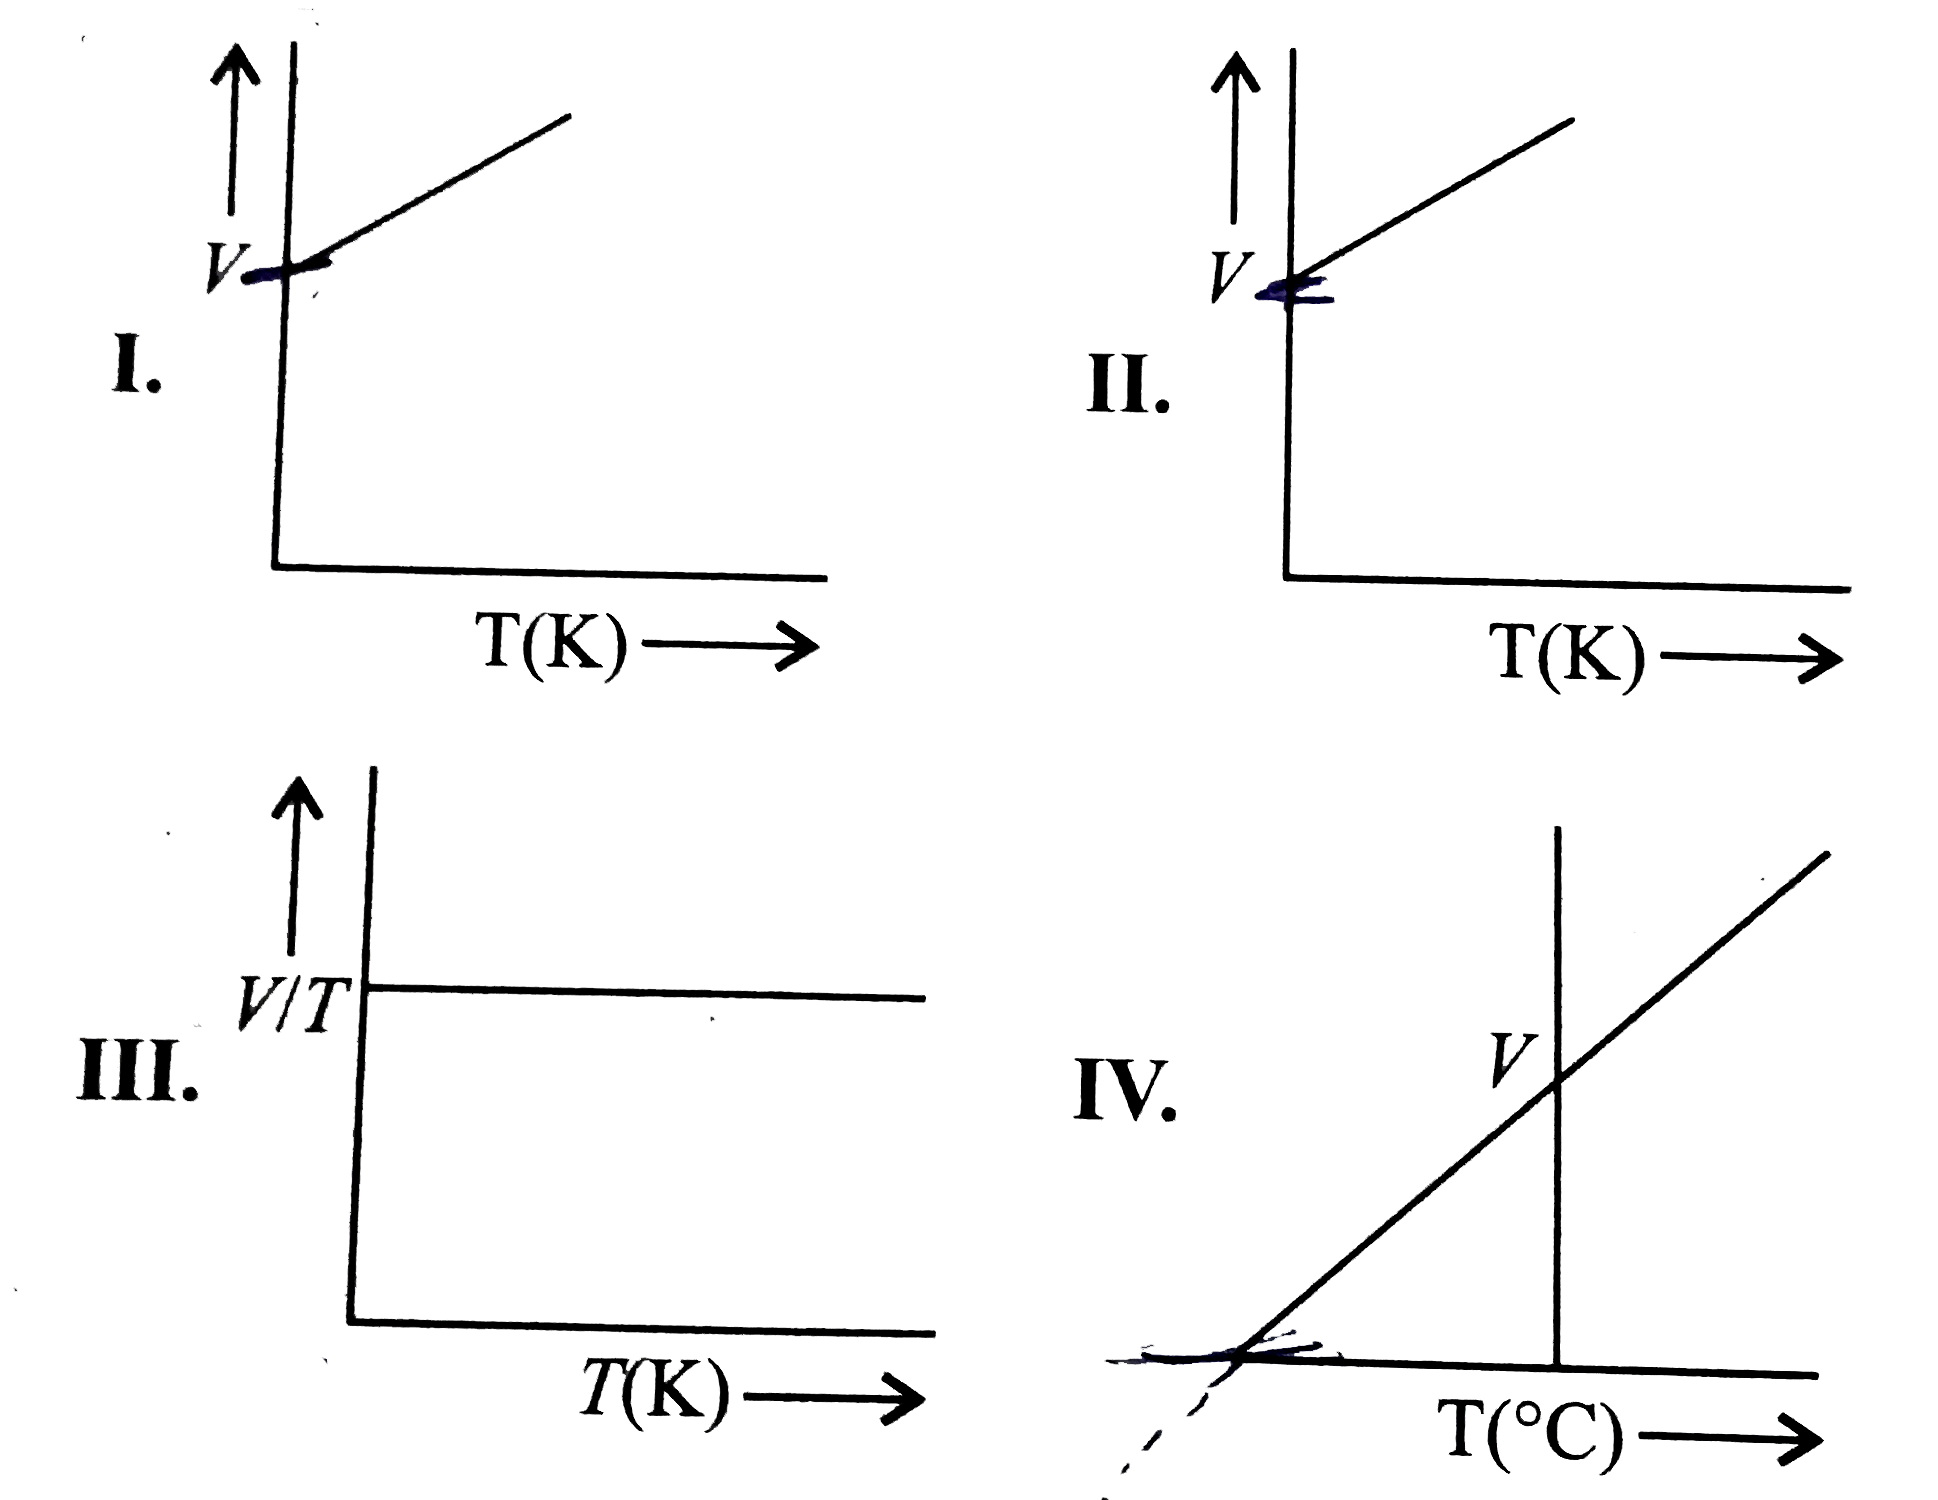
View SolutionFor a fixed mass of gas and constant pressure, which of the following graphs is / are correct?

View SolutionThe pressure of a gas of given mass of constant temperature is reduced to half of its value. Calculate the percentage change in its volume.
View SolutionThe percentage change in the pressure of gas at constant temperature is 200% (increases). Calculate the percentage change in the volume of the gas.
View SolutionCalculate the moles of an ideal gas at pressure 2atm and volume 1L at a temperature of 97.5K
View Solution
