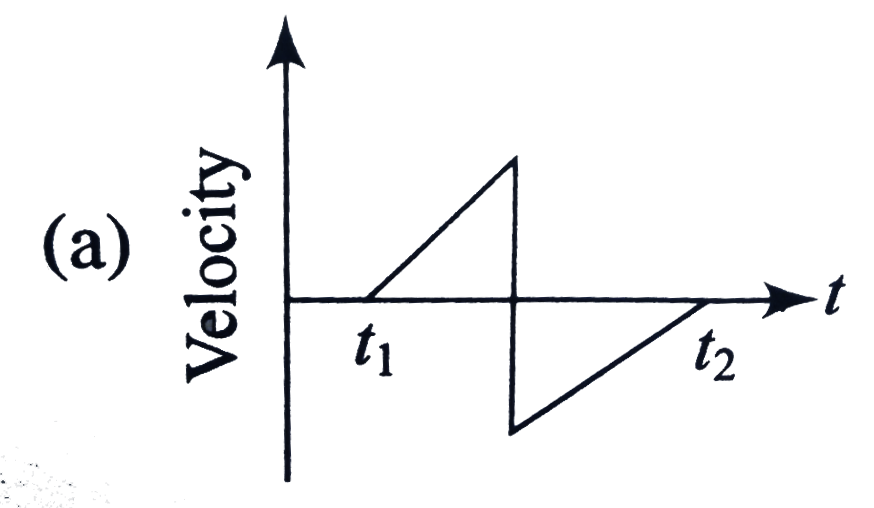
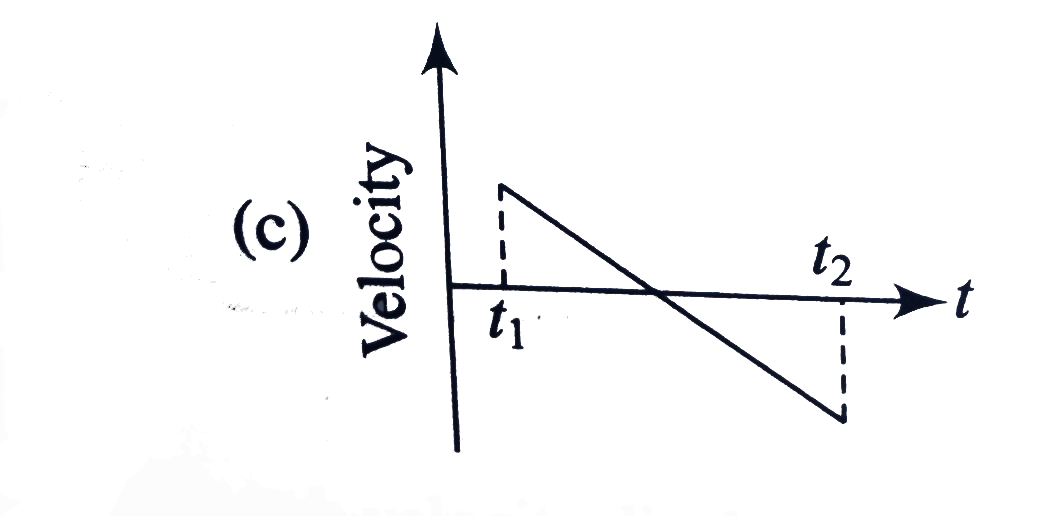
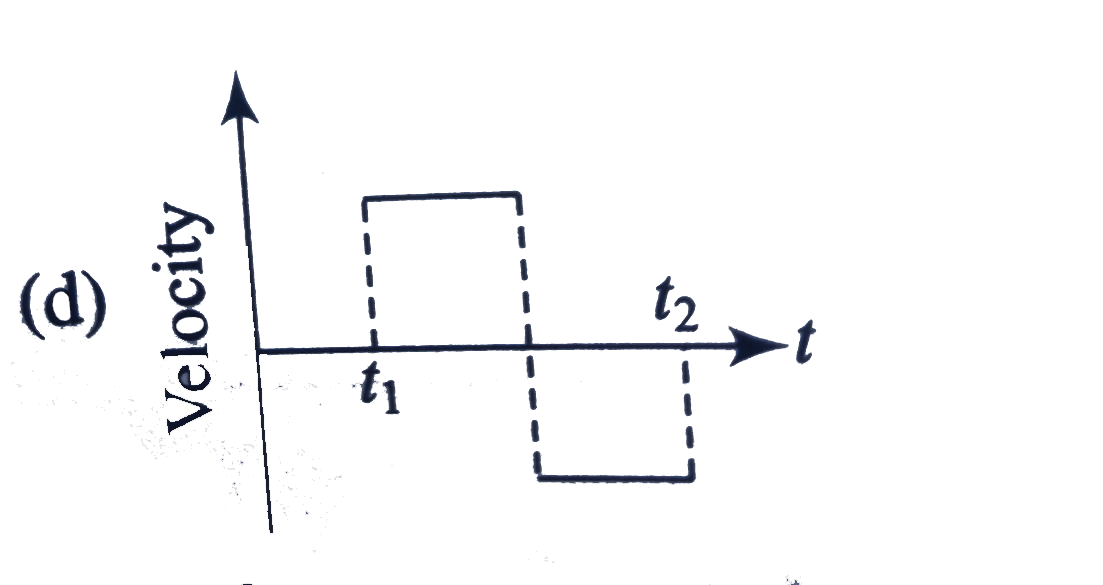
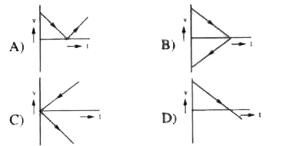
A batsman hits a sixes and the ball touches the ground outside the cricket ground. Which of the following graph describes the variation of the cricket ball's vertical velocity v with time between the time t1 as it hits the bat and time t2 when it touches the ground?


The correct Answer is:C
To solve the problem of the variation of the cricket ball's vertical velocity v with time between the time t1 (when the batsman hits the ball) and time t2 (when it touches the ground), we can analyze the motion of the ball step by step.
1. Understanding the Motion:
- When the batsman hits the ball, it is propelled upwards. Initially, at time t1, the ball has a maximum vertical velocity directed upwards.
2. Velocity Decrease During Ascent:
- As the ball rises, it moves against the force of gravity. The gravitational force acts downwards, causing the ball's upward velocity to decrease until it reaches its maximum height. At this point, the vertical velocity becomes zero.
3. Maximum Height:
- The maximum height is reached when the vertical velocity is zero. This occurs at a certain time tmax between t1 and t2.
4. Velocity Increase During Descent:
- After reaching the maximum height, the ball begins to fall back down. The gravitational force accelerates the ball downwards, causing the vertical velocity to increase in the negative direction (downwards) until it touches the ground at time t2.
5. Graphical Representation:
- The graph of vertical velocity v versus time t will start at a maximum positive value at t1, decrease to zero at the maximum height, and then increase negatively until it reaches a maximum negative value just before it touches the ground at t2.
6. Choosing the Correct Graph:
- The correct graph will show:
- A maximum positive velocity at t1,
- A decrease to zero at the maximum height,
- An increase in negative velocity as the ball falls back down to the ground.
Conclusion:
The graph that best describes this motion will show a curve that starts from a positive maximum, decreases to zero, and then continues into the negative region, reflecting the increasing downward velocity as the ball descends.
- When the batsman hits the ball, it is propelled upwards. Initially, at time t1, the ball has a maximum vertical velocity directed upwards.
- As the ball rises, it moves against the force of gravity. The gravitational force acts downwards, causing the ball's upward velocity to decrease until it reaches its maximum height. At this point, the vertical velocity becomes zero.
- The maximum height is reached when the vertical velocity is zero. This occurs at a certain time tmax between t1 and t2.
- After reaching the maximum height, the ball begins to fall back down. The gravitational force accelerates the ball downwards, causing the vertical velocity to increase in the negative direction (downwards) until it touches the ground at time t2.
- The graph of vertical velocity v versus time t will start at a maximum positive value at t1, decrease to zero at the maximum height, and then increase negatively until it reaches a maximum negative value just before it touches the ground at t2.
- The correct graph will show:
- A maximum positive velocity at t1,
- A decrease to zero at the maximum height,
- An increase in negative velocity as the ball falls back down to the ground.
The graph that best describes this motion will show a curve that starts from a positive maximum, decreases to zero, and then continues into the negative region, reflecting the increasing downward velocity as the ball descends.
Similar Questions
The graph shown the variation with times t of the velocity v of an object . Which one of the following graphs best represents the variation of acceleration a of the object with time t?

View SolutionIn ground to ground projectile motion under gravity, which of the following doesn't affect the time of flight ?
View SolutionA ball is thrown vertically upwards. Which of the following graph/graphs represent velocity-time graph of the ball during its flight (air resistance is neglected)

View SolutionWhich of the following is the graph between the height (h) of a projectile and time (t), when it is projected from the ground
View SolutionA particle is thrown vertically upwards with a velocity v. It returns to the ground in time T. which of the following graphs correctly represents the motion ?
View SolutionA ball falls from a height ‘h’ and collides with the ground. Each time it collides, its velocity is halved. Which of the following graphs are correct? Here t, v and y represent time, velocity and height above ground respectively. (vertically upwards direction is taken as positive and ground as y = 0)
View SolutionA ball is thrown vertically upward with a velocity u from the top of a tower. If it strikes the ground with velocity 3u, the time taken by the ball to reach the ground is
View SolutionA body is projected vertically upward from ground. If we neglect the effect of air, then which one of the following is the best representation of variation of speed (v) with time (t)?
View SolutionA ball is thrown from ground at an angle θ with horizontal and with an initial speed u0 . For the resulting projectile motion, the magnitude of average velocity of the ball up to the point when it hits the ground for the first time is V1 . After hitting the ground, the ball rebounds at the same angle θ but with a reduced speed of u0 / α . Its motion continues for a long time as shown in figure. If the magnitude of average velocity of the ball for entire duration of motion is 0.8 V1 ,. the value of α is ________.

View SolutionA ball is projected upwards from a height h above the surface of the earth with velocity v. The time at which the ball strikes the ground is
View Solution
