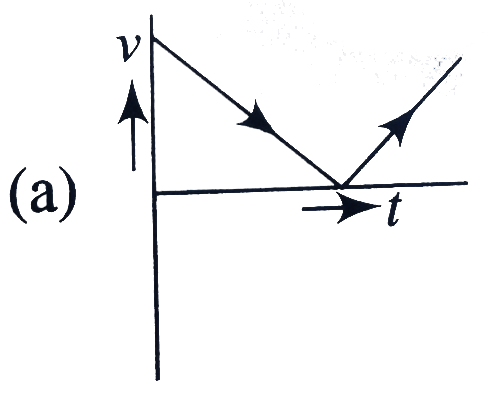
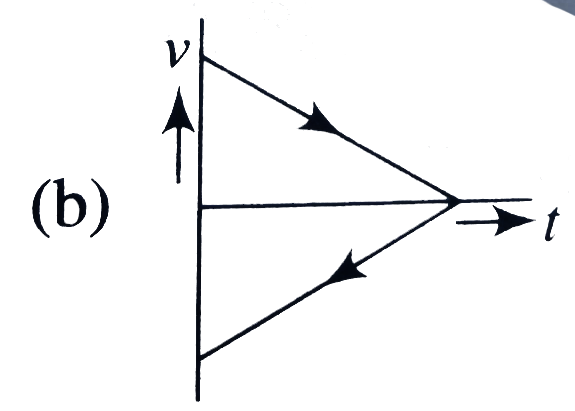
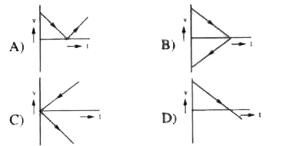
A ball is thrown vertically upwards. Which of the following plots represents the speed time graph of the ball during its height if the air resistance is not ignored?


The correct Answer is:D
In the positive region the velocity decreases linearly (during rise) and in the negative region velocity increases linearly (during fall) and the direction is opposite to each other during rise and fall, hence fall is shown in the negative region.
Similar Questions
A ball is thrown vertically upwards. Which of the following plots represents the speed-time graph of the ball during its height if the air resistance is ignored ?
View SolutionWhich of the following is wheat fruit?
View SolutionA ball is thrown vertically upwards. Which of the following plots represent the speed graph of the ball during its flight if the air resistence is not ignored?
View SolutionA ball is thrown vertically upwards. Which of the following plots represent the speed graph of the ball during its flight if the air resistence is not ignored?
View SolutionA ball is thrown vertically upwards. Which of the following graph/graphs represent velocity-time graph of the ball during its flight (air resistance is neglected)

View SolutionA body is thrown vertically upwards. Which one of the following graphs correctly represent the velocity vs time?
View SolutionThe speed -time graph of the ball in the above situation is.
View SolutionA ball is thrown vertically upwards from the ground. If T1 and T2 are the respective time taken in going up and coming down, and the air resistance is not ignored, then
View SolutionA body is thrown vertically upwards which graph represents variation of velocity w.r.t time
View SolutionA ball is thrown vertically upward. What is the magnitude of velocity at the highest point ?
View Solution
