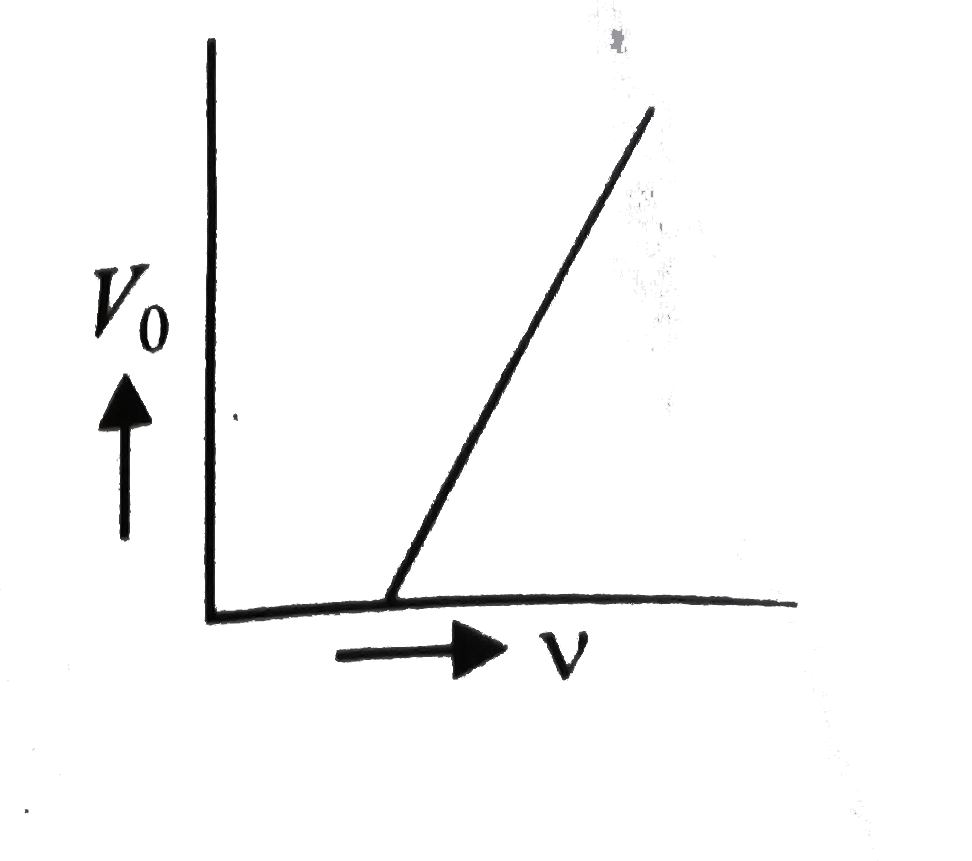
In photoelectric effect experiment, the slope of the graph of the stopping potential versus frequency gives the value of :
he
h
eh
hce
The correct Answer is:A
To solve the problem regarding the photoelectric effect experiment and the relationship between stopping potential and frequency, we can follow these steps:
1. Understand the Photoelectric Effect Equation:
The photoelectric effect can be described by the equation:
E=ϕ+KE
where E is the energy of the incident photons, ϕ is the work function of the material, and KE is the kinetic energy of the emitted electrons.
2. Relate Energy to Frequency:
The energy of the photons can be expressed in terms of frequency (f) using the equation:
E=hf
where h is Planck's constant.
3. Express Stopping Potential:
The stopping potential (V0) is related to the kinetic energy of the emitted electrons. The kinetic energy can be expressed as:
KE=eV0
where e is the charge of the electron.
4. Combine the Equations:
Substituting the expressions for energy and kinetic energy into the photoelectric effect equation gives:
hf=ϕ+eV0
Rearranging this equation, we find:
eV0=hf−ϕ
or
V0=hfe−ϕe
5. Identify the Linear Relationship:
The equation V0=hef−ϕe can be compared to the linear equation y=mx+c, where:
- y is V0
- x is f
- m (the slope) is he
- c (the y-intercept) is −ϕe
6. Conclusion:
The slope of the graph of stopping potential (V0) versus frequency (f) is given by:
slope=he
Final Answer:
The slope of the graph of the stopping potential versus frequency gives the value of he, where h is Planck's constant and e is the charge of the electron.
---
The photoelectric effect can be described by the equation:
E=ϕ+KE
where E is the energy of the incident photons, ϕ is the work function of the material, and KE is the kinetic energy of the emitted electrons.
The energy of the photons can be expressed in terms of frequency (f) using the equation:
E=hf
where h is Planck's constant.
The stopping potential (V0) is related to the kinetic energy of the emitted electrons. The kinetic energy can be expressed as:
KE=eV0
where e is the charge of the electron.
Substituting the expressions for energy and kinetic energy into the photoelectric effect equation gives:
hf=ϕ+eV0
Rearranging this equation, we find:
eV0=hf−ϕ
or
V0=hfe−ϕe
The equation V0=hef−ϕe can be compared to the linear equation y=mx+c, where:
- y is V0
- x is f
- m (the slope) is he
- c (the y-intercept) is −ϕe
The slope of the graph of stopping potential (V0) versus frequency (f) is given by:
slope=he
The slope of the graph of the stopping potential versus frequency gives the value of he, where h is Planck's constant and e is the charge of the electron.
Similar Questions
In photoelectric effect the slope of stop of stopping potential versus frequency of incident light for a given surface will be
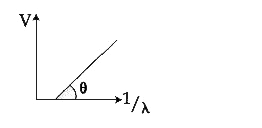
View SolutionIn a photoelectric effect experiment, the graph of stopping potential V versus reciprocal of wavelength obtained is shown in the figure. As the intensity of incident radiation is increased :

View Solution
Knowledge Check
In photoelectric effect, stopping potential depends on
Afrequency of incident lightBnature of the emitter materialCintensity of incident lightDboth (a) and (b)

When a high frequency electromagnetic radiation is incident on a metallic surface, electrons are emitted from the surface. Energy of emitted photoelectrons depends only on the frequency of incident electromagnetic radiation and the number of emitted electrons depends only on the intensity of incident light.
Einstein's protoelectron equation [Kmax=hv−ϕ] correctly ecplains the PE, where υ= frequency of incident light and ϕ= work function.
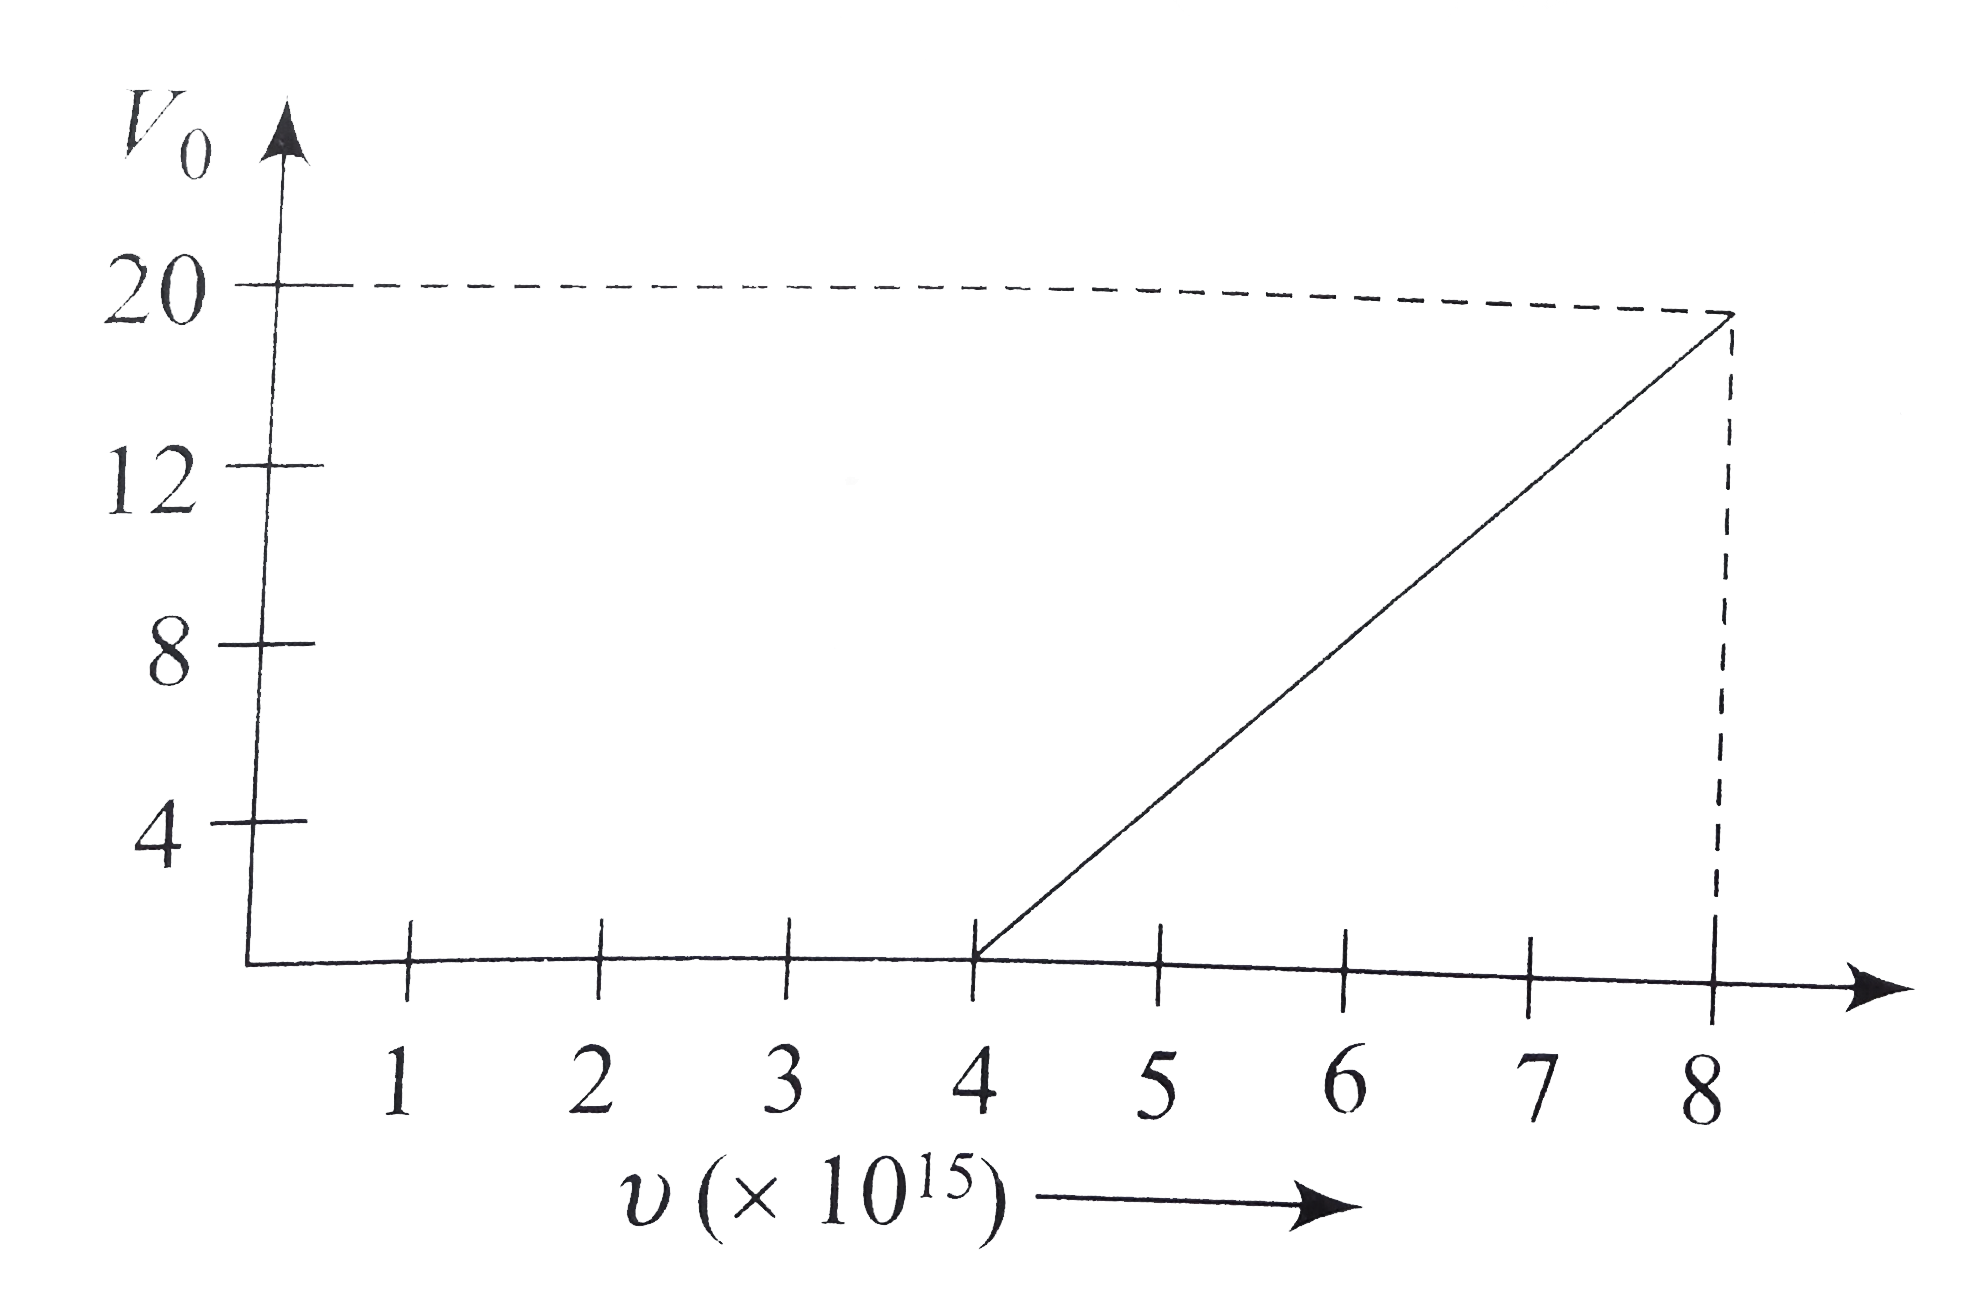
Q. For photoelectric effect in a metal, the graph of the stopping potential V0 (in volt) versus frequency υ (in hertz) of the incident radiation is shown in Fig. The work function of the metal (in eV) is.
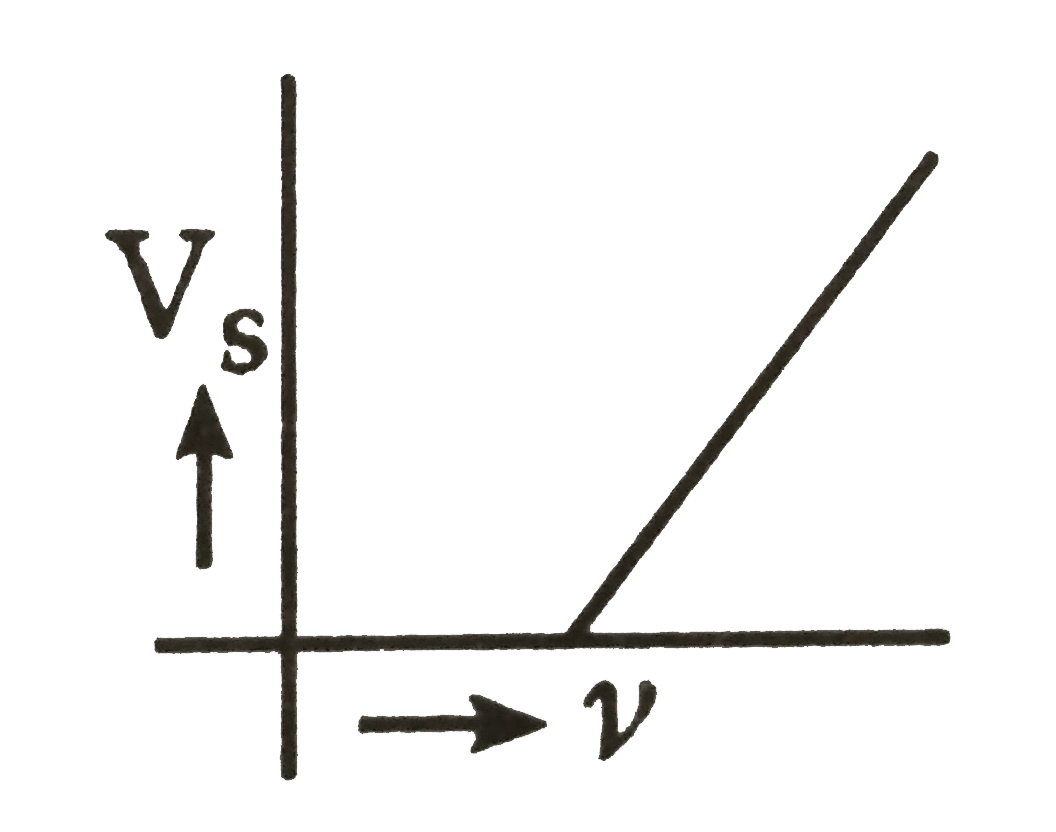
View SolutionIn photoelectric effect the slope of straight line graph between stopping potential (Vs) and frequency of incident light (v) gives

View SolutionThe slope of the graph drawn between stopping potential and frequency of incident radiation will be
View SolutionIn a photoelectric experiment, it was found that the stopping potential decreases from 1.85 V to 0.82 V as the wavelength of the incident light is varied from 300nm to 400nm. Calculate the value of the Planck constant from these data.
View SolutionThe emission of electrons from a metal surface exposed rto light radaition of appropriate wavelength is called photoelectric effect .The emmited electron are called photo=-weklectron work function of threshold energy may be defined as the minimum amount of energy required to ejected electron from a most surface .According to Einstein
Maximum kinetic energy of ejected electron = Absorbed energy - Work function
12mv2max=h(v)−h(vn)=hv[1λ−1λn]
Where vn and λ0 are thereshold frequency and threshold wavelength respectively
Sopping potential : it is the miximum potential at which the photoelectric current becomes zero if V0 is the stopping potential eV0=h(v−v0)
In the photoelectric currect effect the shape of strainght line graph between stopping potential (V0) and frequency of incident light (V) gves

View SolutionThe work function of Silver and sodium are 4.6and2.3eV, respectively . The ratio of the slope of the stopping potential versus frequency plot for silver to that of sodium is
View SolutionThe work function of Silver and sodium are 4.6and2.3eV, respectively . The ratio of the slope of the stopping potential versus frequency plot for silver to that of sodium is
View Solution
