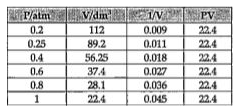
At constant temperature, the effect of change of pressure on volume of a gas was as given below

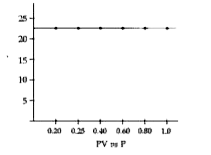
Plot the following graphs :
PV vs P.

PV vs P :

Topper's Solved these Questions
- STUDY OF GAS LAWS BOOK - ICSECHAPTER - STUDY OF GAS LAWS EXERCISE - TOPIC 2 (1 Mark Questions )
10 Videos
- STUDY OF GAS LAWS BOOK - ICSECHAPTER - STUDY OF GAS LAWS EXERCISE - TOPIC 2 (2 Marks Questions )
27 Videos
- STUDY OF GAS LAWS BOOK - ICSECHAPTER - STUDY OF GAS LAWS EXERCISE - TOPIC 1 (3 Marks Questions )
17 Videos
- SPECIMEN PAPER 3BOOK - ICSECHAPTER - SPECIMEN PAPER 3EXERCISE - SECTION II
35 Videos
- STUDY OF THE FIRST ELEMENT - HYDROGENBOOK - ICSECHAPTER - STUDY OF THE FIRST ELEMENT - HYDROGENEXERCISE - TOPIC 2 Properties of Hydrogen, Oxidation nd Reduction (5 MARKS QUESTIONS)
29 Videos
Similar Questions
Knowledge Check
What is the effect on the pressure of a gas if its temperature is increased at constant volume ?
AThe pressure of the gas increases.BThe pressure of the gas decreases .CThe pressure of the gas remains same .DThe pressure of the gas becomes half.
At constant temperature, the effect of change of pressure on volume of a gas was as given below

Assuming that the pressure values given above are correct, find the correct measurement of the volume at 0-60 atmosphere pressure
View SolutionAt constant temperature , the effect of change of pressure on volume of a gas was as given below :
Pressure in atmosphereVolume in litres0.201120.2589.20.4056.250.6037.400.8028.101.0022.4
Plot the following graphs
P vs V
View SolutionAt constant temperature, the product of pressure and volume of a given amount of a gas is constant. This is :
View SolutionAt a given volume and temperature the pressure of a gas
View SolutionA student performed an experiment to measure - pressure and volume of a gas at constant temperature and noted the following:

Calculate the value of x and y. Which law was used in the calculations ? Draw graphs to show:
PV plotted against pressure
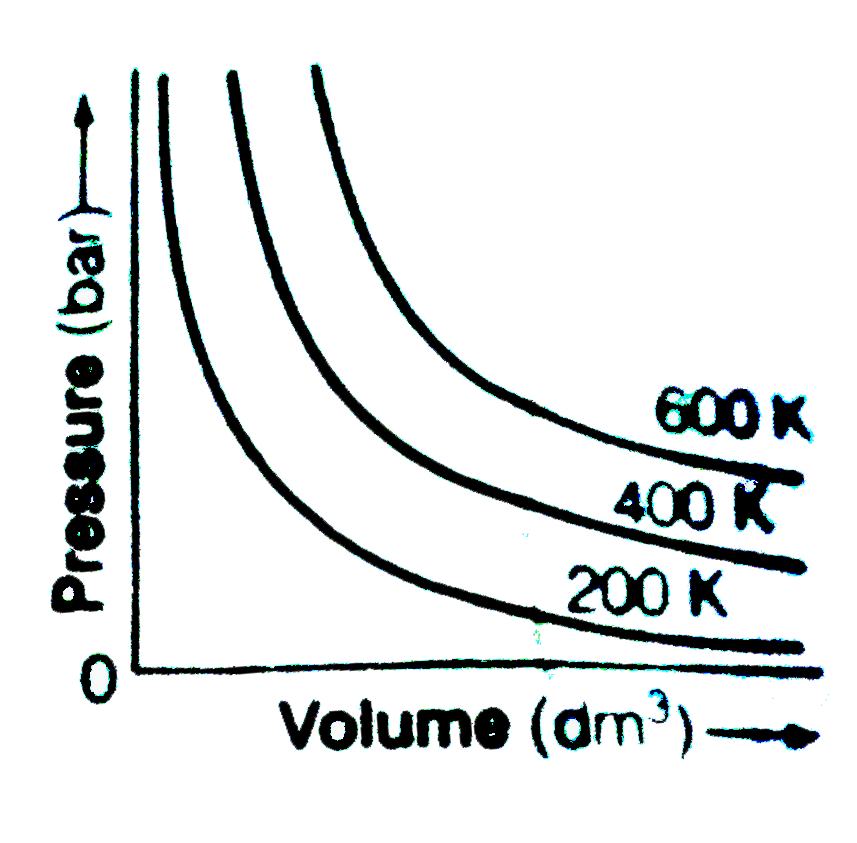
View SolutionThe variation of pressure with volume of the gas at different temperatures can be graphically represented as shown in figure. On the basis of this graph answer the following question.
(i) How will the volume of a gas change if its pressure is increased at constant temperature ?
(ii) At a constant pressure, how will the volume of a gas change if the temperature is increased from 200 K to 400 K ?

View SolutionA student performed an experiment to measure - pressure and volume of a gas at constant temperature and noted the following:

Calculate the value of x and y. Which law was used in the calculations ? Draw graphs to show:
volume plotted against pressure.
View Solution
