A person ordered 4 shirts of brand A and some shirts of brand B. The price of one shirt of brand A was twice that of brand B. When the order was executed, it was found that the number of the two brands has been interchanged. This increased the bill by 40%. The ratio of the number of brand A shirts to that of brand B shirts in the original order was
The correct Answer is:1:3
Step by step video, text & image solution for A person ordered 4 shirts of brand A and some shirts of brand B. The price of one shirt of brand A was twice that of brand B. When the order was executed, it was found that the number of the two brands has been interchanged. This increased the bill by 40%. The ratio of the number of brand A shirts to that of brand B shirts in the original order was by Maths experts to help you in doubts & scoring excellent marks in Class 14 exams.
Updated on:21/07/2023Topper's Solved these Questions
- PROFIT & LOSSBook:ADVANCED MATHS BY ABHINAY MATHS ENGLISHChapter:PROFIT & LOSSExercise:Questions
Explore 200 Videos
- PIPE & CISTERN Book:ADVANCED MATHS BY ABHINAY MATHS ENGLISHChapter:PIPE & CISTERN Exercise:QUESTIONS
Explore 40 Videos
- QUADRILATERALBook:ADVANCED MATHS BY ABHINAY MATHS ENGLISHChapter:QUADRILATERALExercise:EXERCISE
Explore 48 Videos
Similar Questions
Knowledge Check
A person ordered 4 shirts of brand A and some shirts of brand B. The price of one shirt of brand A was twice that of brand B. When the order was executed, it was found that the number of the two brands has been interchanged. This increased the bill by 40%. The ratio of the number of brand A shirts to that of brand B shirts in the original order was
A1:2B1:3C1:4D1:5The branding line of Bank of Baroda is
AInternational Bank of IndiaBIndia's International BankCIndia's Multinational BankDWorld's Local Bank
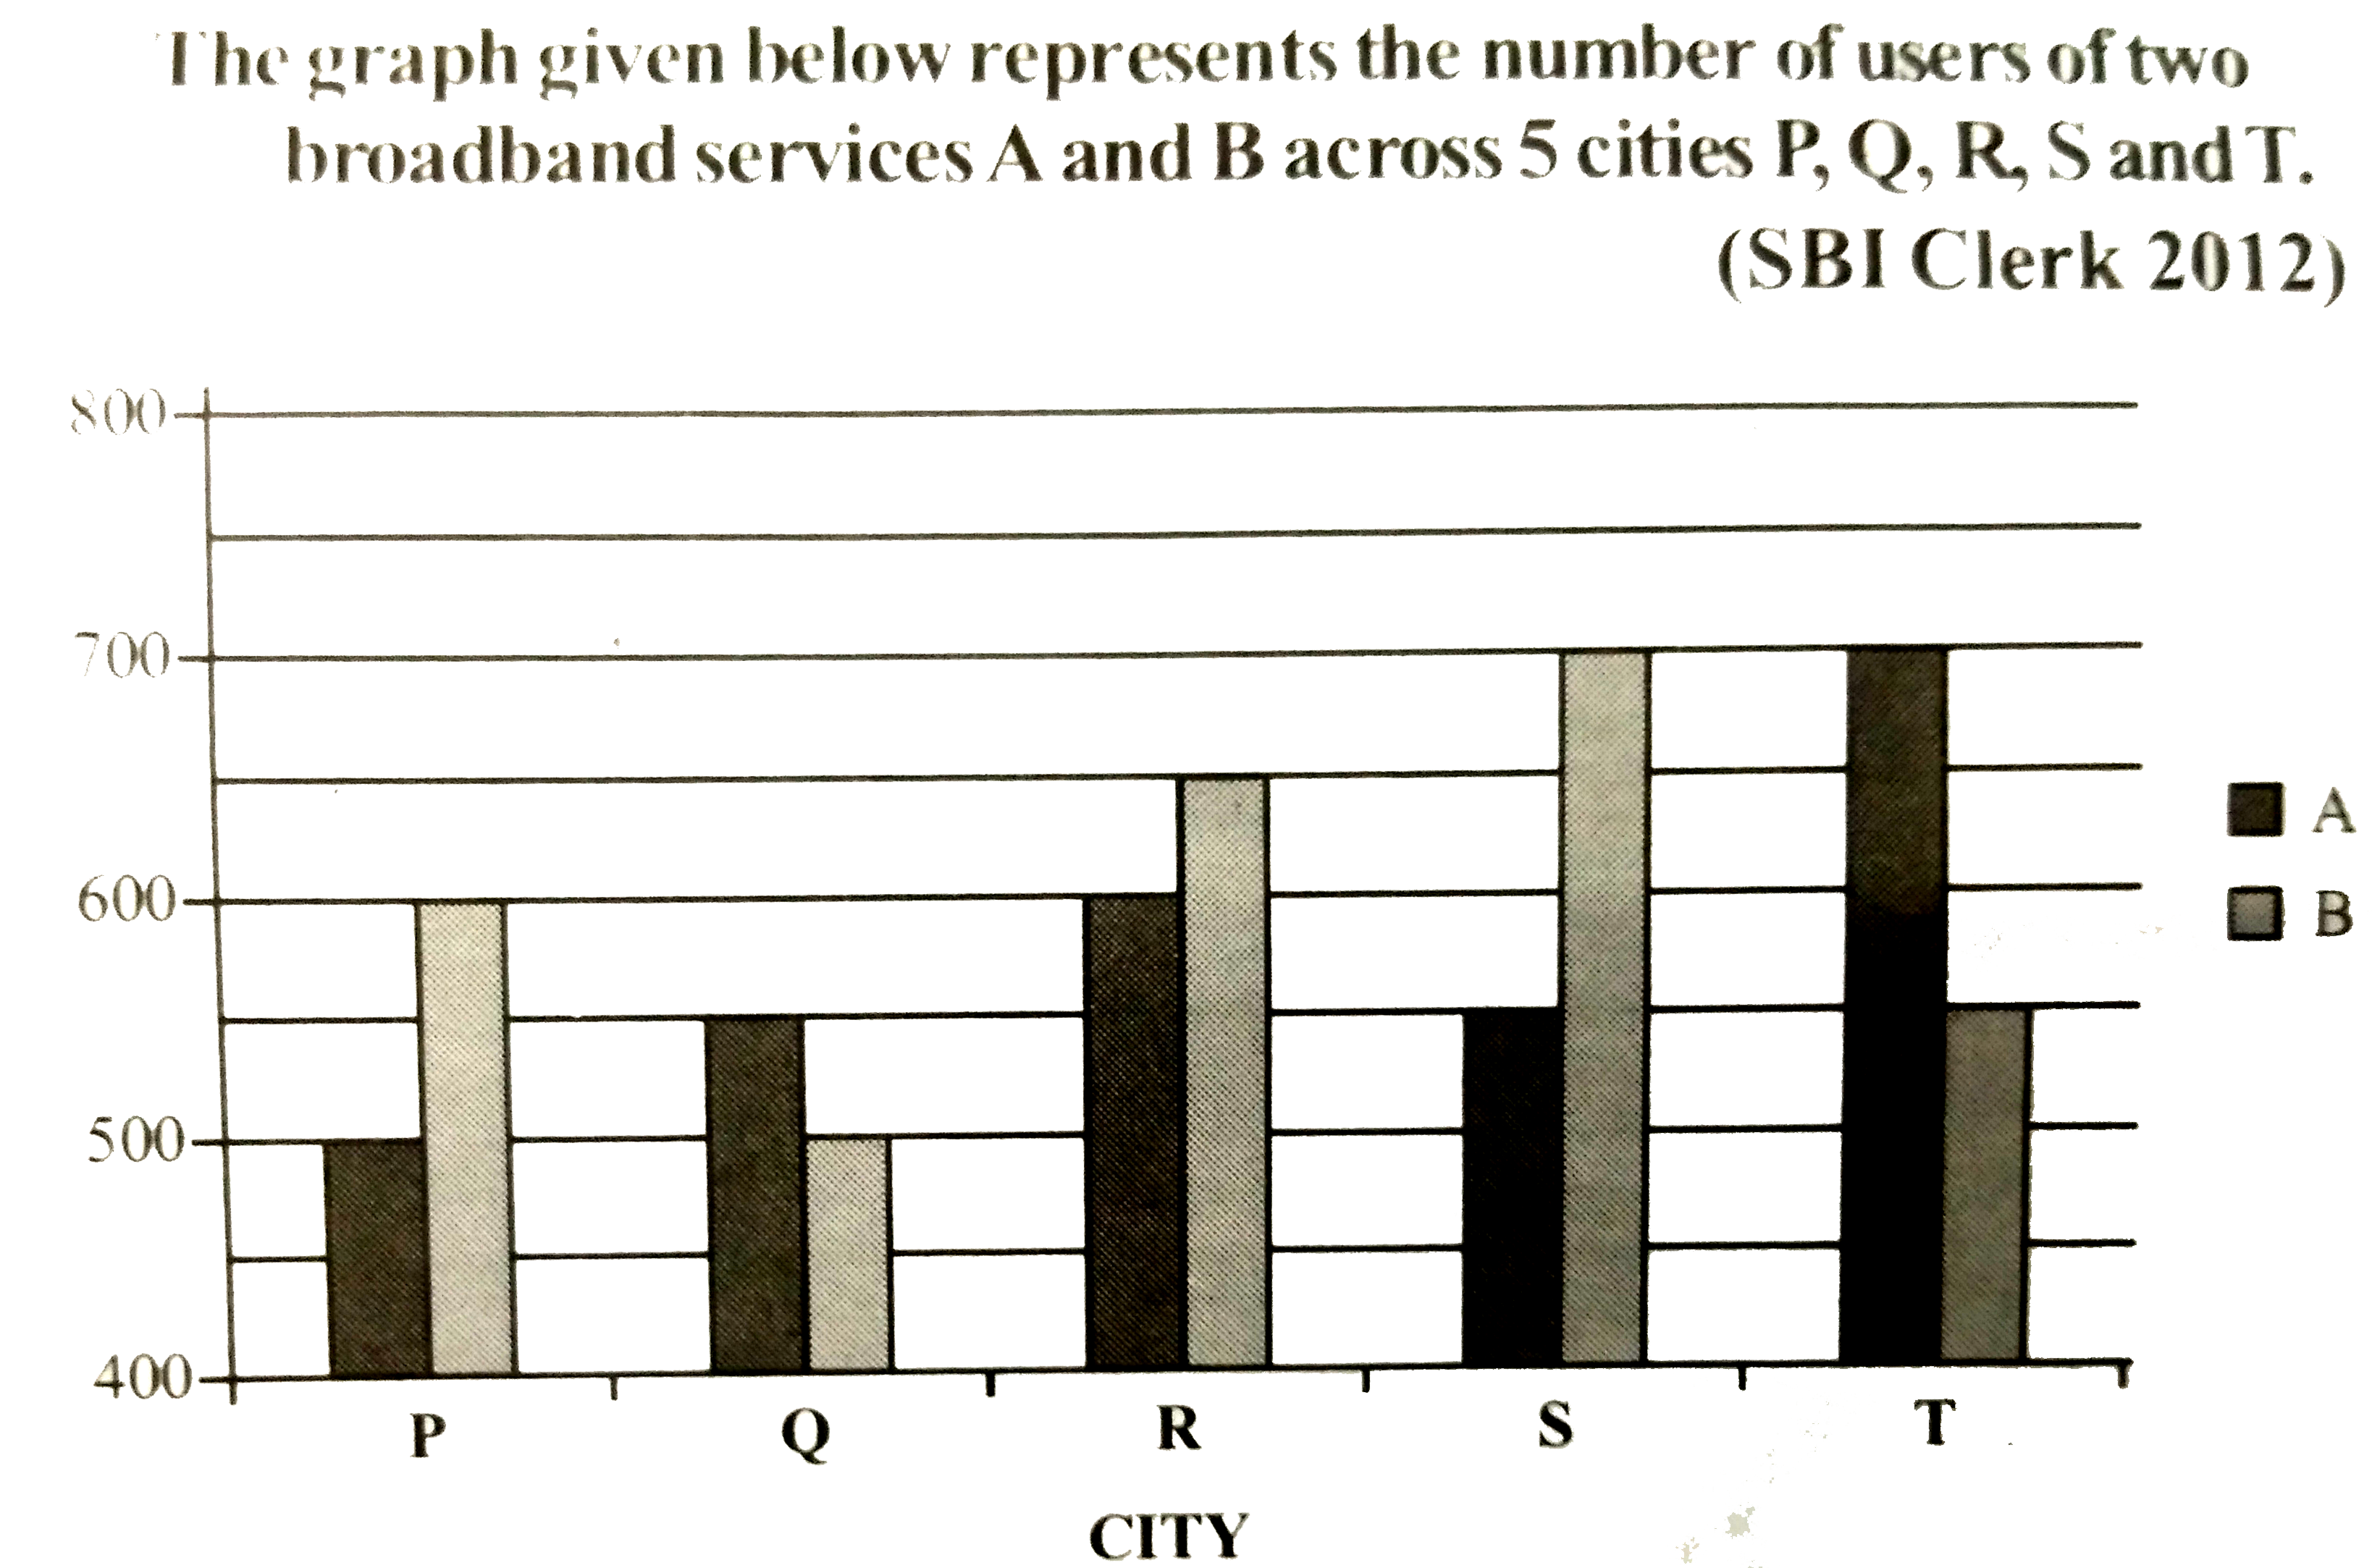
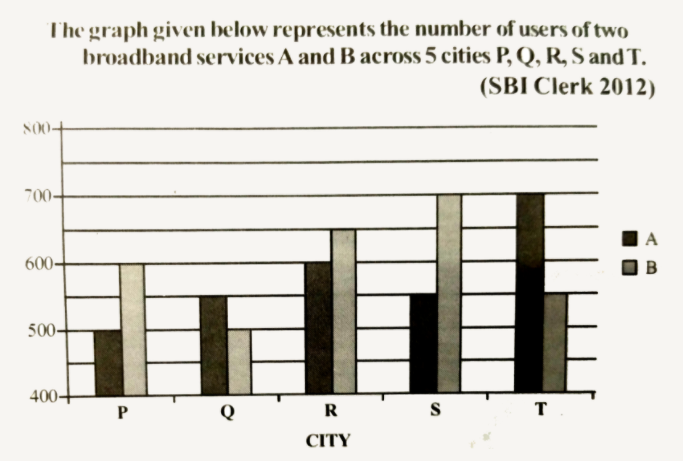
What is the average number of users of brand A across al five cities together ?
View Solution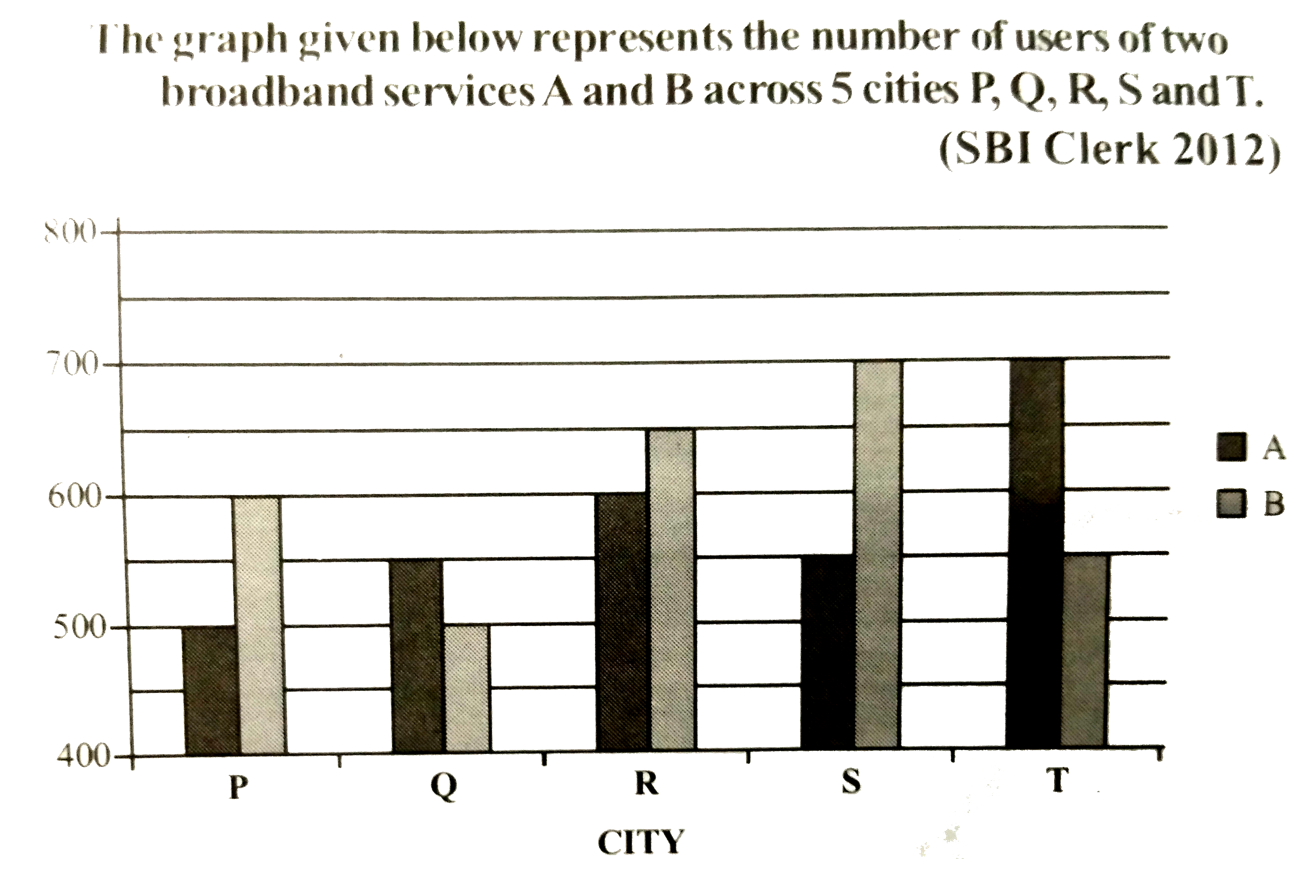
The number of users of brand A in city T is what percent of the number of users of brand B in city Q ?
View SolutionThe bar graph shows the number of motorcycles of different brands sold by a dealer in a month . Study the diagram and answer the following questions .
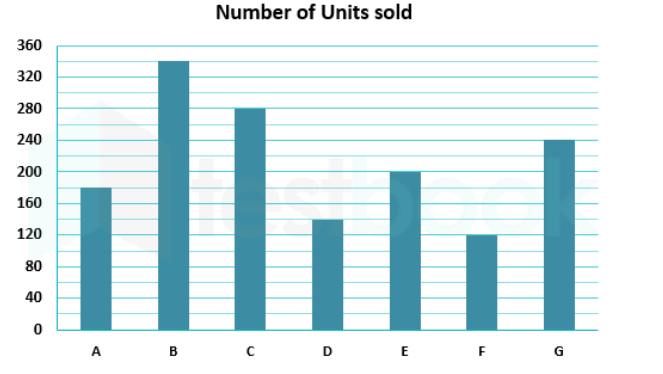
What is the ratio of units sold of brand A to that of brand C?
View Solution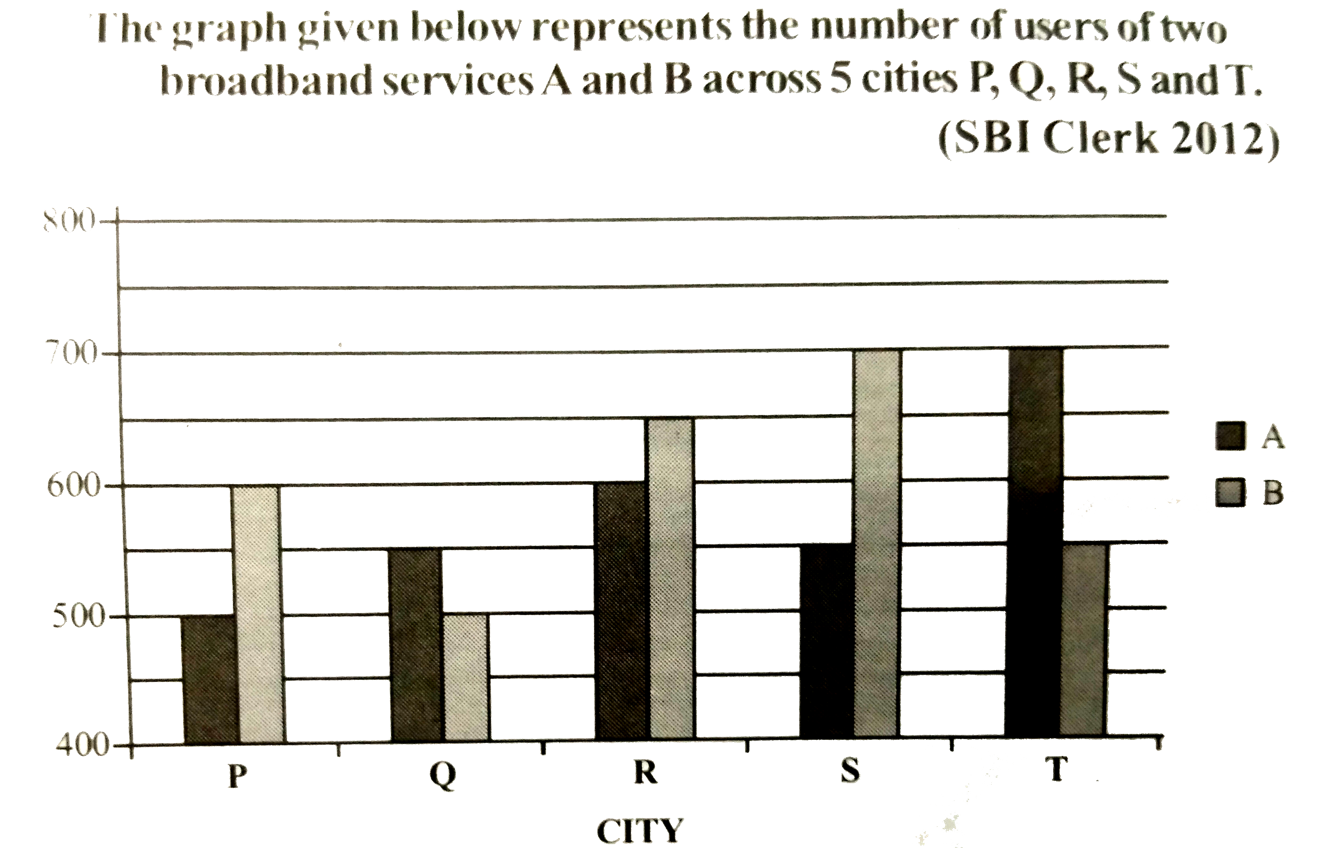
What is the difference between the total number of users of Brand A and B together in city R and the total number of users of brand A annd B together in city P ?
View SolutionThe bar graph shows the number of cars of different brands sold by a dealer in a month. Study the diagram and answer the following question.
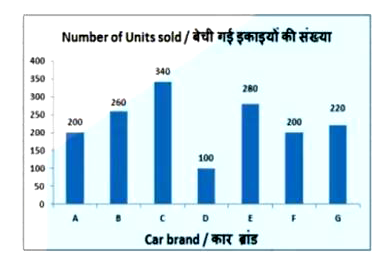
What is the ratio of units sold of brand G to that of brand E?
View SolutionWhat do you mean by brand ?
View Solution
