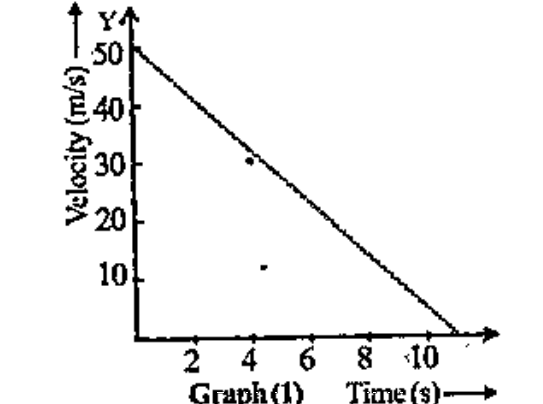
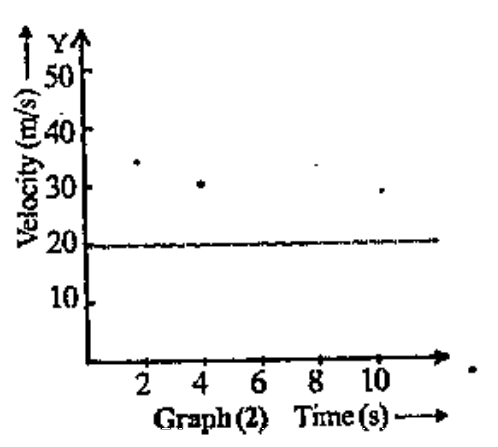
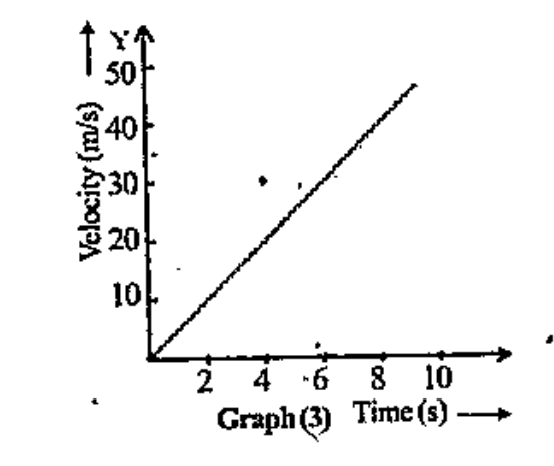
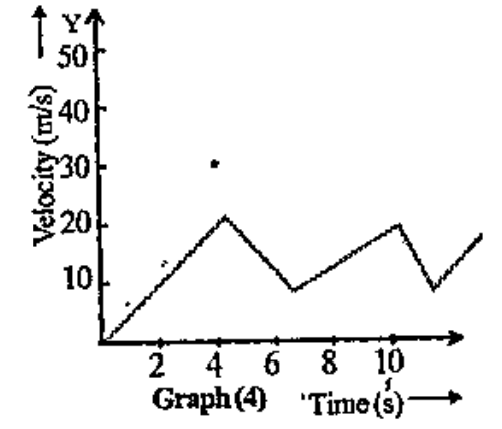
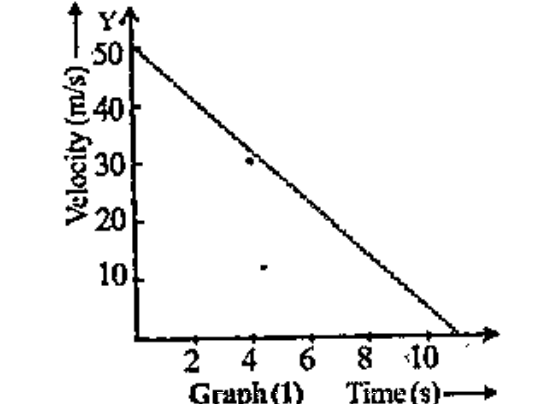
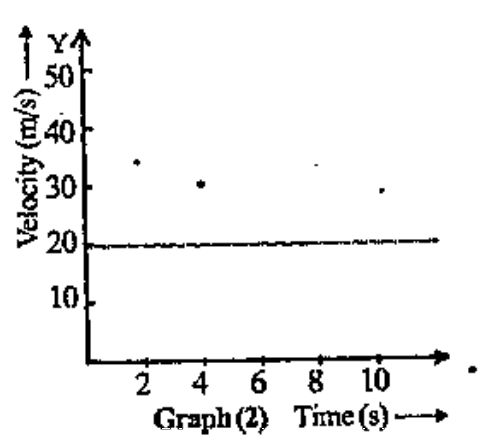
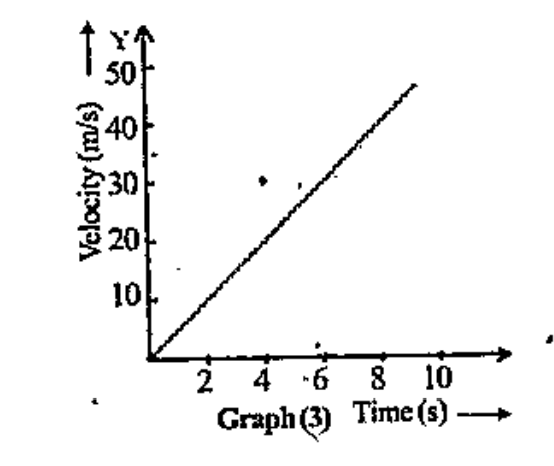
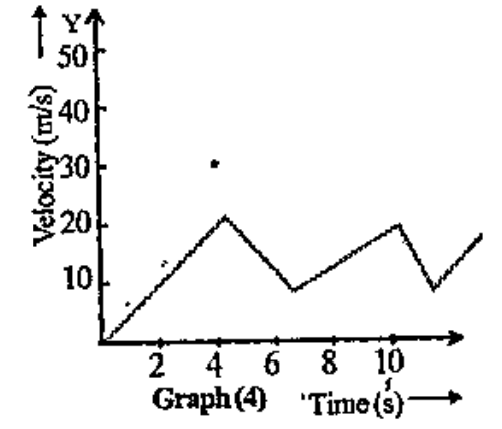
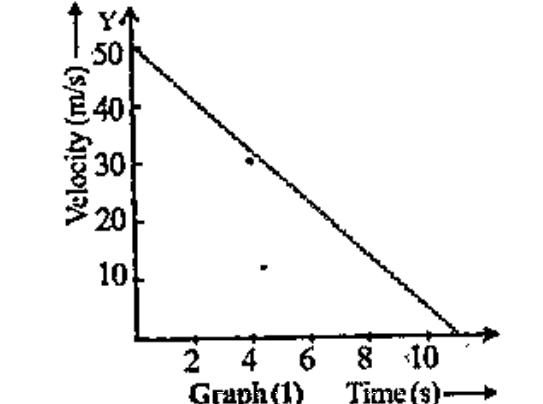
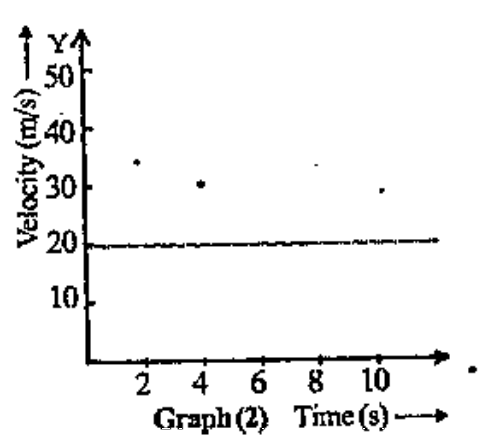
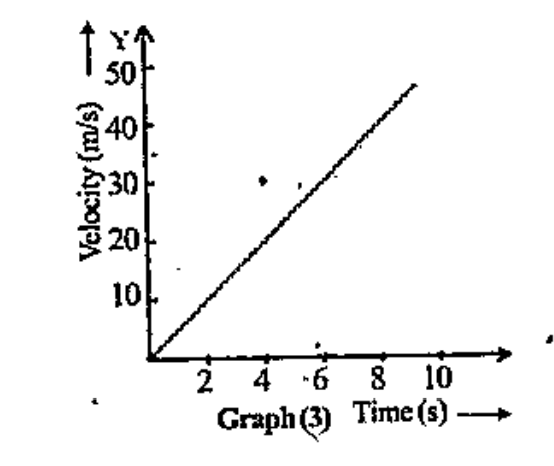
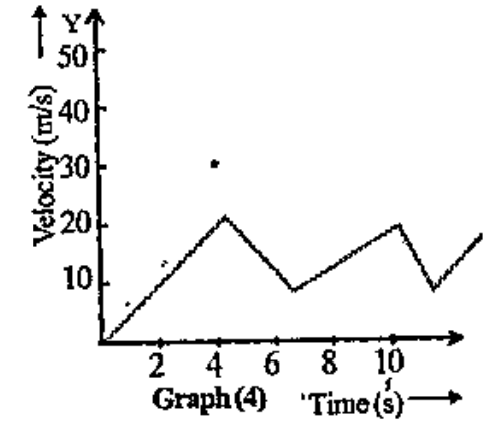
Analyse the graphs given below.
Which graph indicates non uniform velocity?
 Solution in Malayalam
The correct Answer is:graph (4)
Step by step video, text & image solution for Analyse the graphs given below. Which graph indicates non uniform velocity? by Physics experts to help you in doubts & scoring excellent marks in Class 9 exams.
Updated on:21/07/2023Topper's Solved these Questions
Similar Questions
Take water in bucket. Place a tightly closed bottle on it. What do you observe?
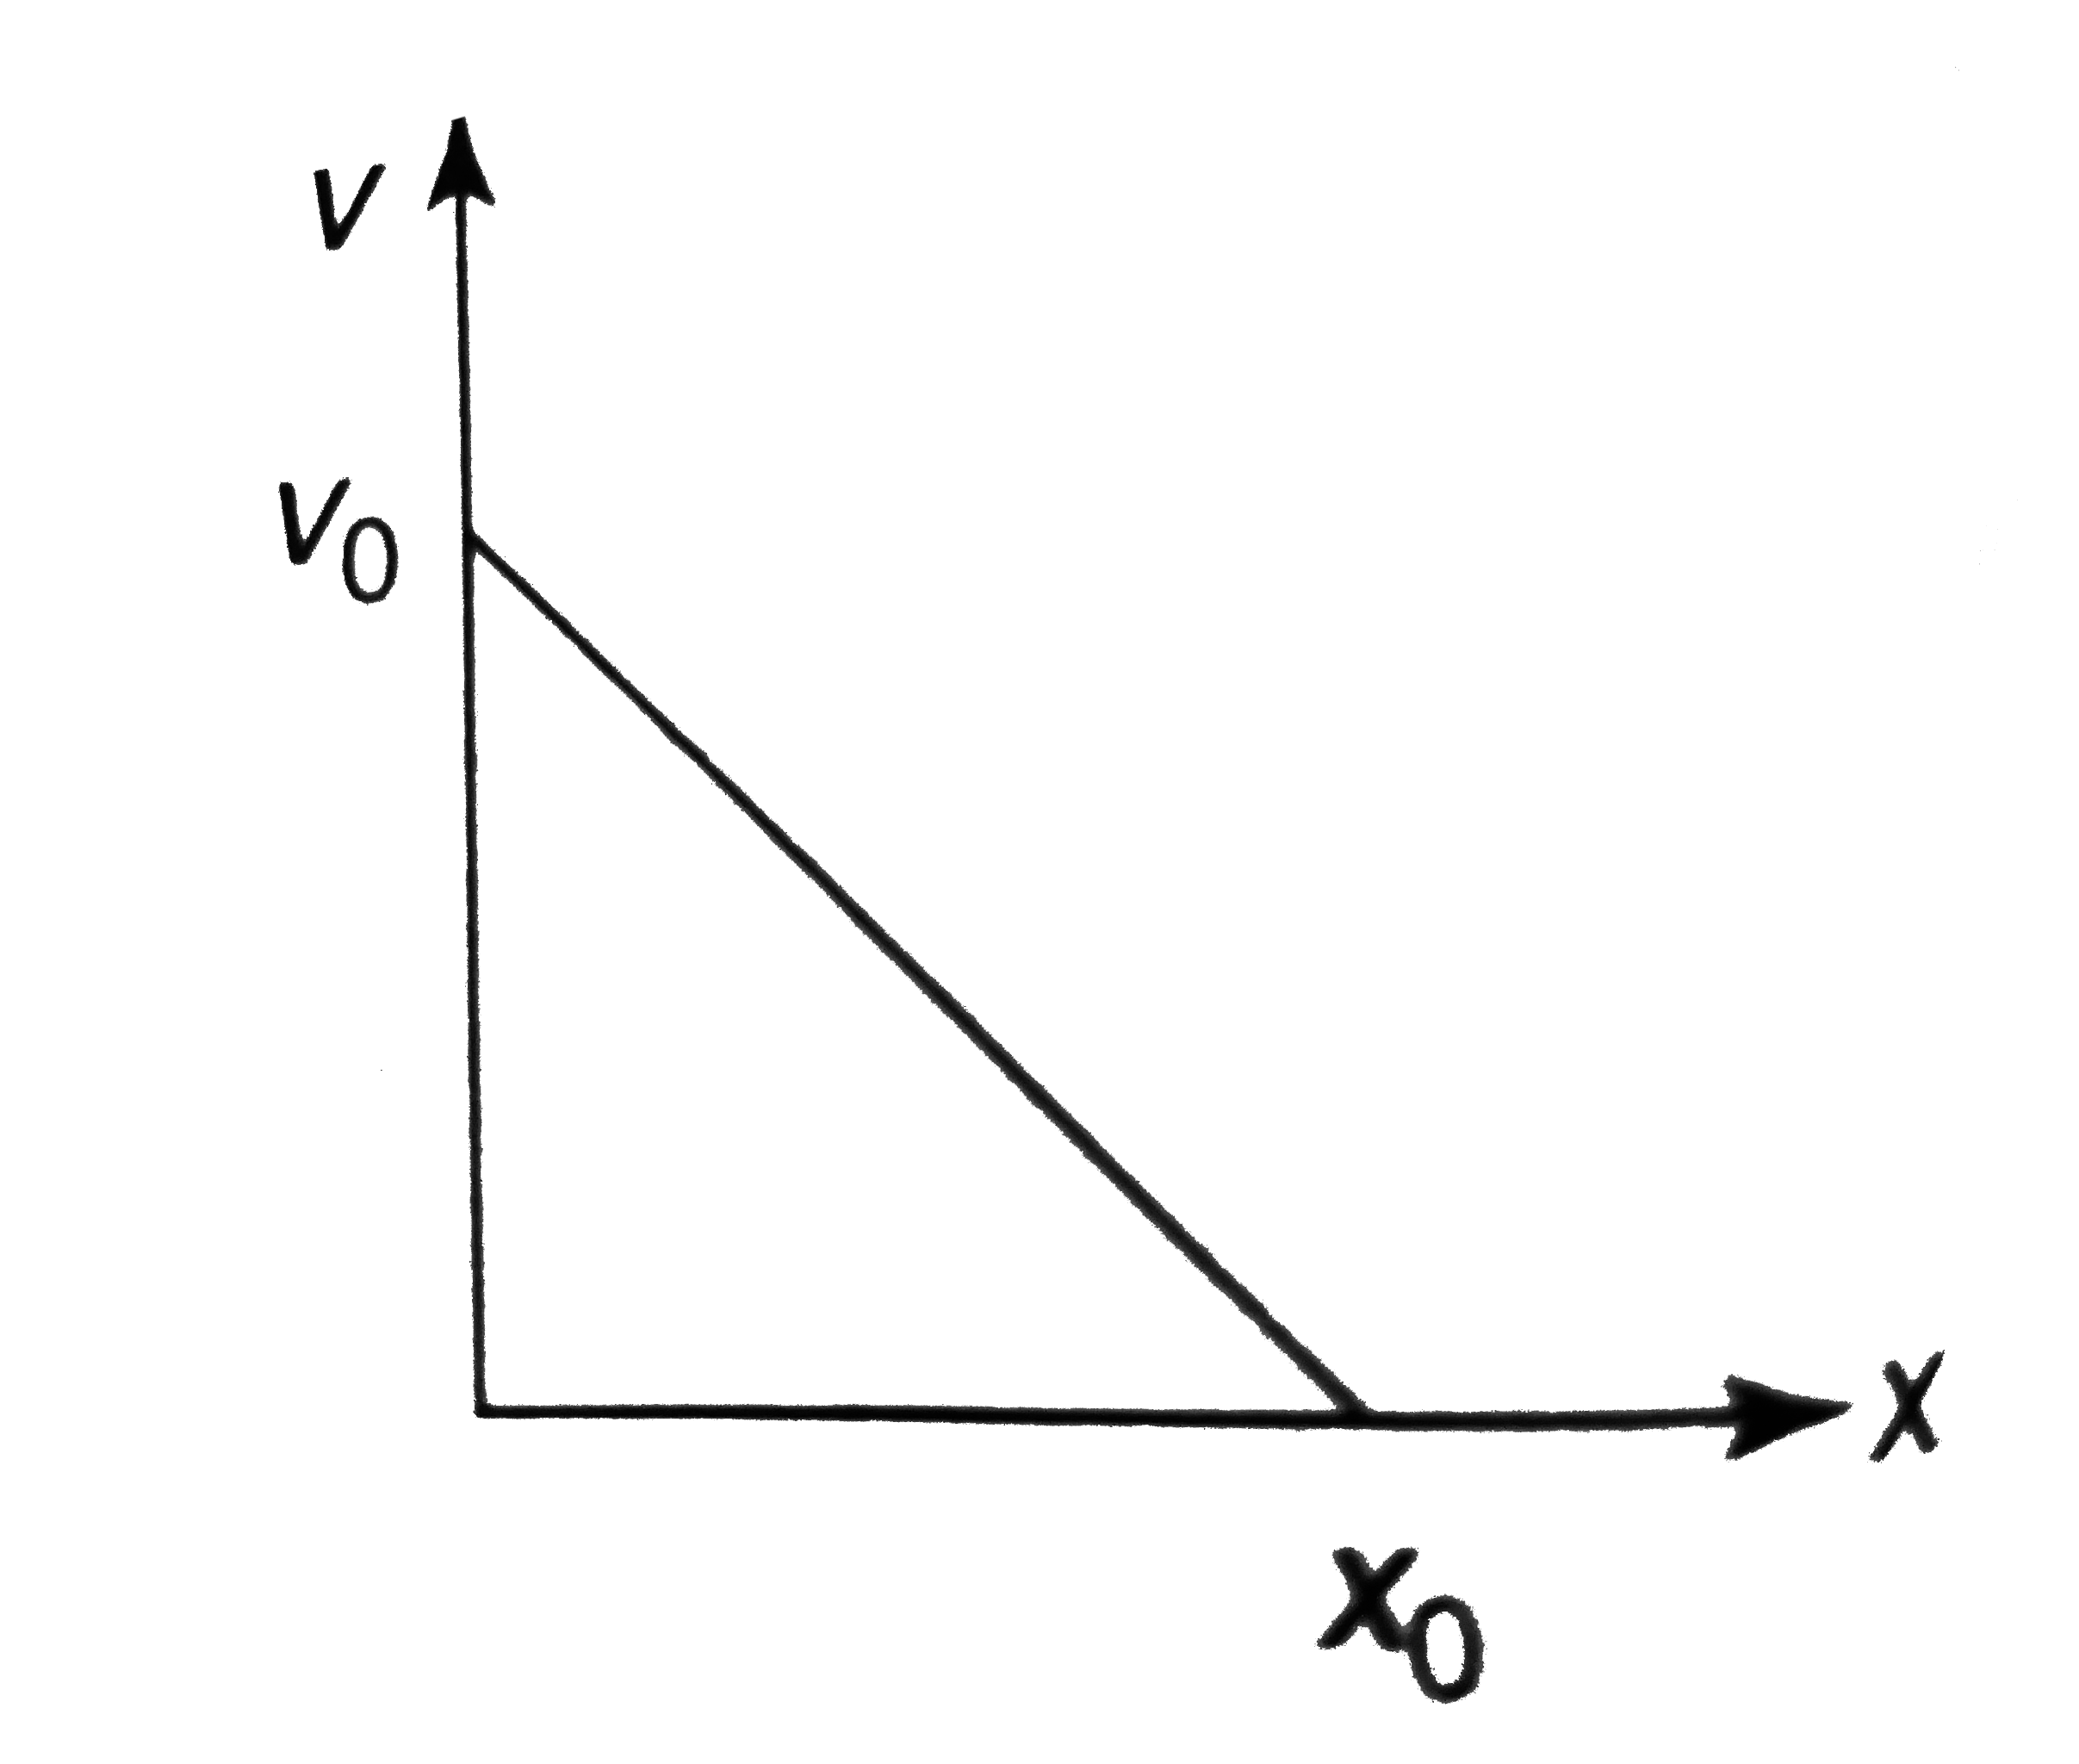
View SolutionThe given graph shows the variation of velocity with displacement. Which one of the graphs given below correctly represents the variation of acceleration with displacement ?
View SolutionWhich of the following graph indicate uniform velocity ?
View SolutionFor given velocity time graphs in which case the acceleration is uniform and positive -
View Solutionविस्थापन तथा समय के बीच निम्न ग्राफ प्राप्त होता है
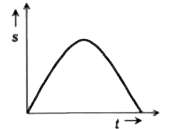
इसके संगत सही वेग-समय ग्राफ होगा
View SolutionThe velocity -time graph for a body with non-uniform motion is a
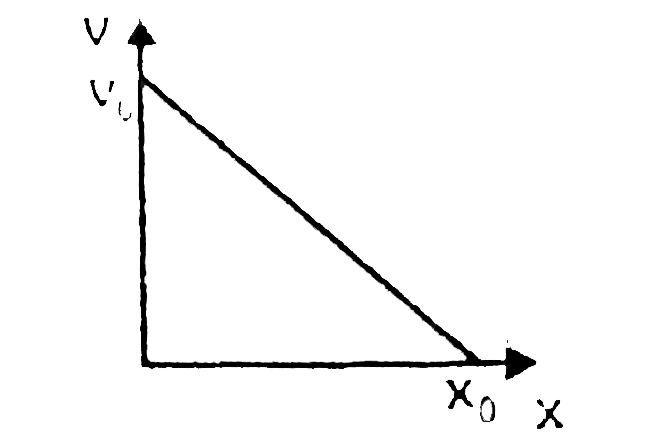
View SolutionVelocity-displacement graph is given in figure below. Then draw acceleration-displacement graph
View SolutionThe given graph shows the variation of velocity with displacement. Which one of the graph given below correctly represents the variation of acceleration with displacement :-
View SolutionThe velocity - time graph of an object is given below: The area under this graph gives
View SolutionAnalyse the graphs given below.
Which graph indicates uniform velocity?
View SolutionAnalyse the graphs given below.
Which graph indicates the motion of freely falling stone?
View SolutionUniform Motion||Non Uniform Motion||Graphs
View SolutionUniform Speed |Uniform Velocity|Non Uniform Speed & Non Uniform Velocity|Acceleration|Uniform Acceleration|Graphs
View SolutionAnalyse the graphs given below. (a) Which graph indicates uniform velocity? (b) Which graph indicates non uniform acceleration? (c) Which graph indicates the motion of a freely falling stone?
'(##VPU_TTT_IX_PHY_C02_E02_007_Q01##)'
View SolutionA graph is given below. Analyse the graph find the trend of atomic radius in this group.
View Solution
