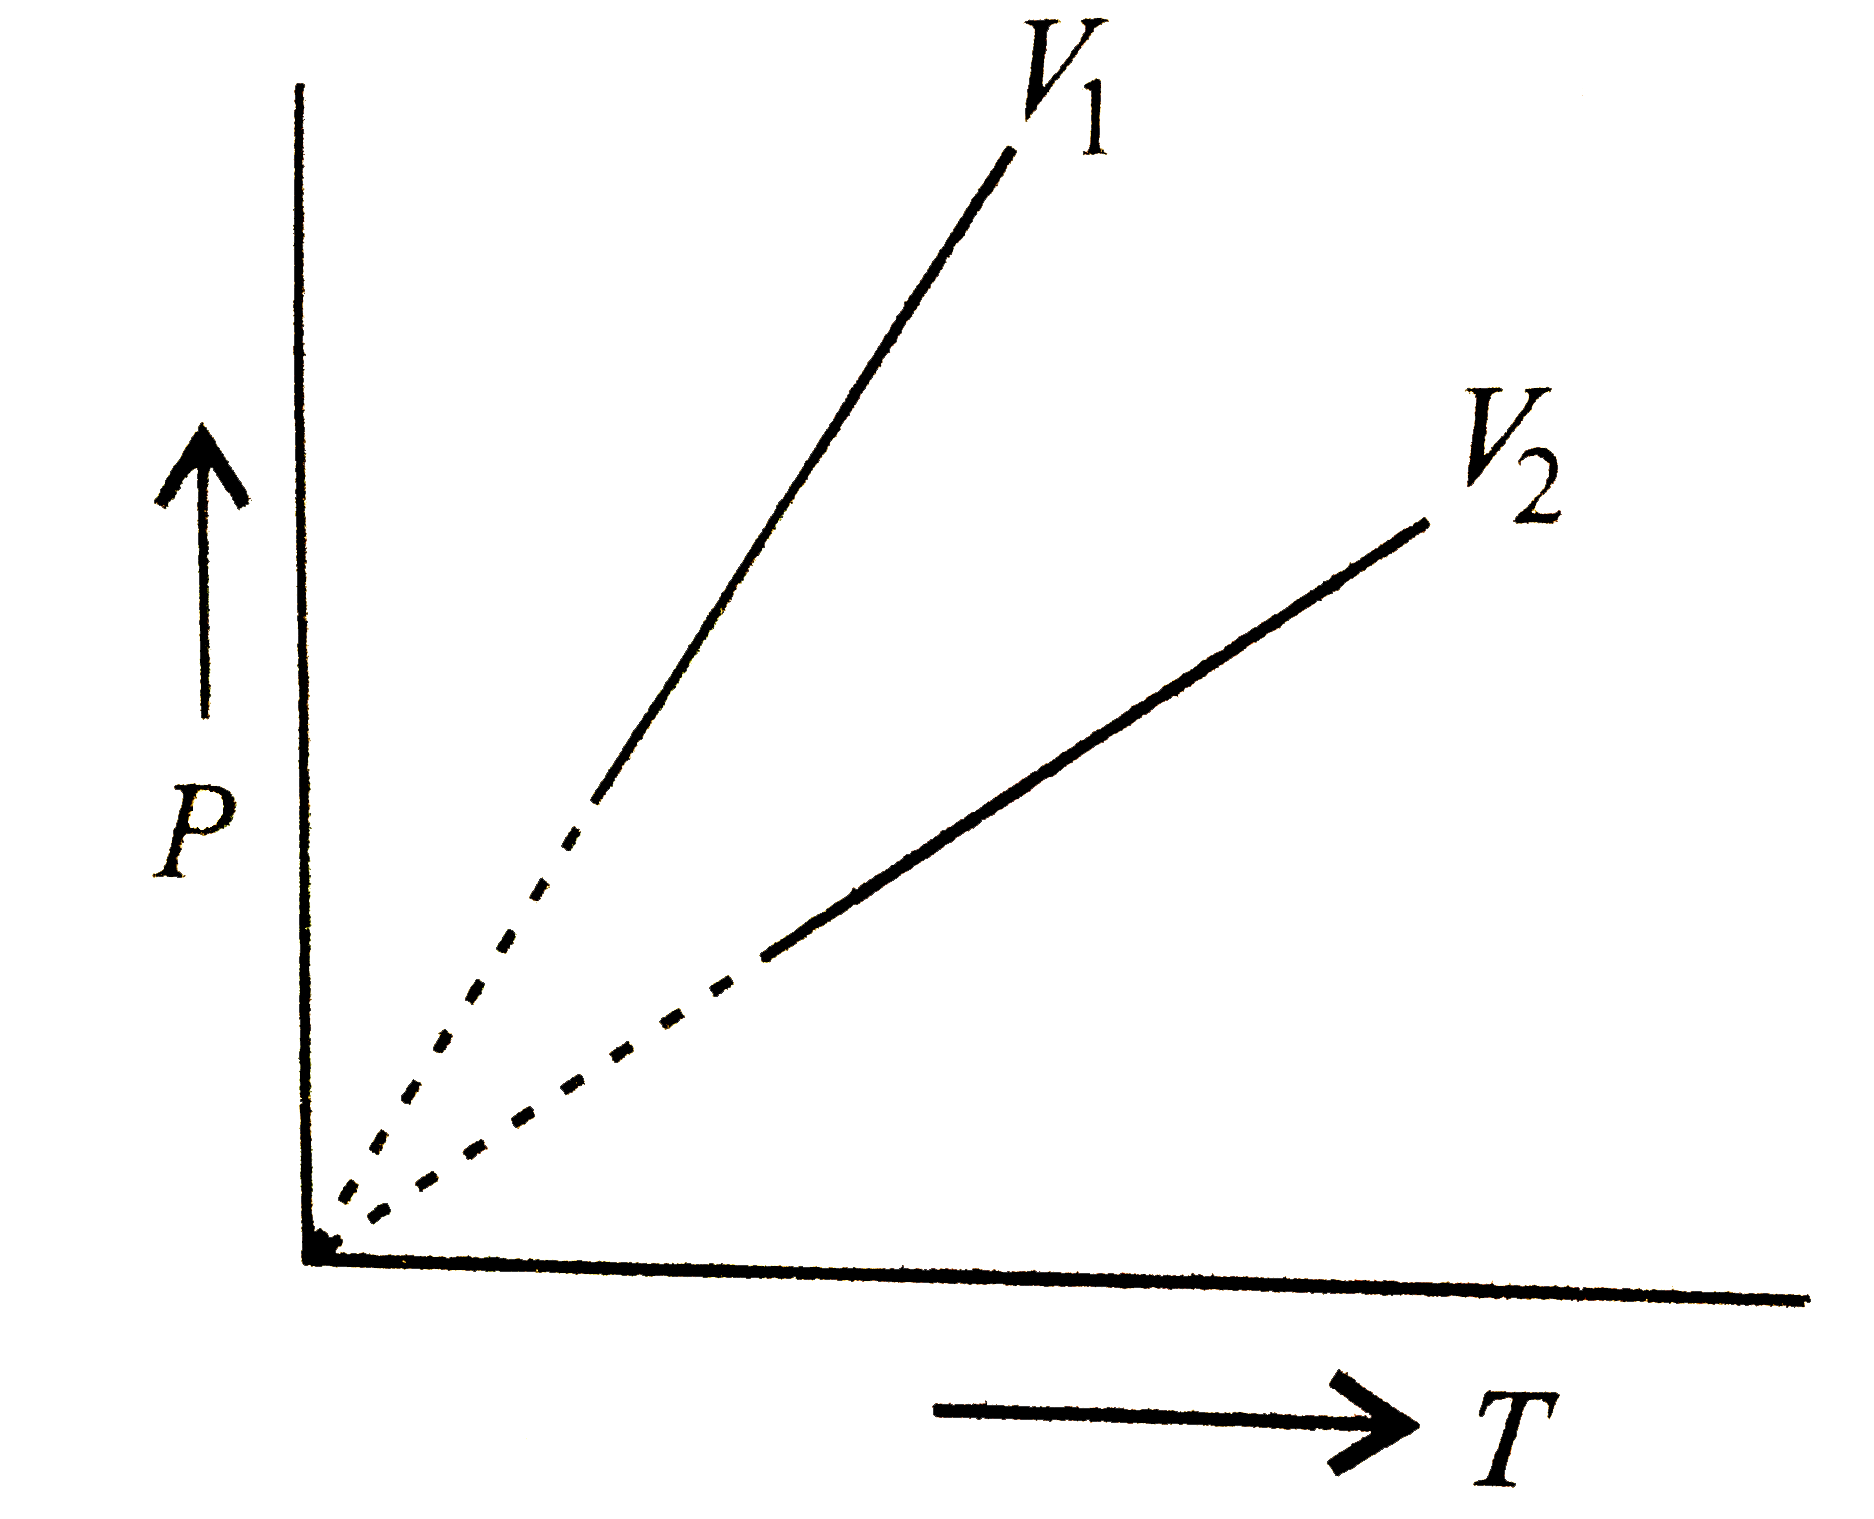
The pressure p of a gas is plotted against its absolute temperature T for two different constant volumes V1andV2 where V1>V2. P is plotted on the y-axis and T on the x-axisSolution in Telugu
The curve for V1 has greater slope than the curve for V2
The curve for V2 has greater slope than the curve for V1
The curves must intersect at some point other than T=0
The curves have the same slope and do not intersect
The correct Answer is:B
Step by step video, text & image solution for The pressure p of a gas is plotted against its absolute temperature T for two different constant volumes V_(1) and V_(2) where V_(1) gt V_(2). P is plotted on the y-axis and T on the x-axis by Physics experts to help you in doubts & scoring excellent marks in Class 11 exams.
Updated on:21/07/2023Topper's Solved these Questions
- THERMODYNAMICSBOOK - AAKASH SERIESCHAPTER - THERMODYNAMICSEXERCISE - EXERCISE - 1B
32 Videos
- THERMODYNAMICSBOOK - AAKASH SERIESCHAPTER - THERMODYNAMICSEXERCISE - EXERCISE - 2
58 Videos
- THERMODYNAMICSBOOK - AAKASH SERIESCHAPTER - THERMODYNAMICSEXERCISE - Problem
60 Videos
- THERMAL PROPERTIES OF MATTERBOOK - AAKASH SERIESCHAPTER - THERMAL PROPERTIES OF MATTEREXERCISE - ADDITIONAL PRACTICE EXERCISE (LEVEL - II) PRACTICE SHEET (ADVANCED) Integer/Subjective Type Questions
2 Videos
- THERMOMETRY BOOK - AAKASH SERIESCHAPTER - THERMOMETRY EXERCISE - Numerical Exercise (LEVEL- 1)
11 Videos
Similar Questions
Assertion (A) & Reason (R ) Type Questions
(A): During a free expansion of an ideal gas workdone is zero
(R): Workdone against vacuum is zero
View SolutionHow much steam at 100∘C is to be passed into water of mass 100g at 20∘c to raise its temperature by 5∘C ? (Latent heat of steam is 540 cal /g and specific heat of water is 1cal/g∘C)
View SolutionHailstones fall from a certain height. If they melt completely on reaching the ground, find the height from which they fall.
View SolutionA constant pressure gas thermometer has a volume of 200cc, 273.2cc and 525 .1cc at 0°C, 100°C and boiling point of sulphur respectively. The resistance possessed by a platinum wire at the same temperatures as above are 2.000Ω,2.778Ωand5.280Ω respectively. Estimate the boiling point of sulphur on the basis of the two sets of observations.
View SolutionIf a temperature scale defines the freezing point of water as 100∘C and the boiling as 0∘ what temperature on the scale corresponds to 25∘ C ?
View SolutionThe pressure p of a gas is plotted against its absolute temperature T for two different constant volumes, V_(1) and V_(2) when V_(1) gt V_(2) , the
View SolutionThe pressure p for a gas is plotted against its absolute temperature T for two different volumes V_(1) and V_(2) . If p is plotted on y- axis and T on x- axis, then
View SolutionUnit mass of liquid of volume V1 completely turns into a gas of volume V2 at constant atmospheric pressure P and temperature T. The latent heat of vaporization is "L". Then the change in internal energy of the gas is
View SolutionA gas expands under constant pressure P from volume V1 toV2The work done by the gas is
View SolutionThe pressure P of a gas is plotted against its absolute temperature T for two different constant volumes, V_(1) and V_(2) (for same no. of moles) where V_(1) gt V_(2) , the correct statement is:
View SolutionThe initial state of certain gas (PiViTi).It undergoes expansion till its volume becomes Vf at constant temperature T. The correct plot of P-V diagram for it is
View SolutionThe expression for the entropy change when a gas expands from volume V_(1) to volume V_(2) at constant temperature T is DeltaS_(T)= " …..................."
View SolutionA plot of P vs T for a given mass of gas at constant volume is a straight line . P vs T at constant volumes V1 and V2 for an ideal gas are shown below :
Which of the following is correct ?

View SolutionOne mole of an ideal gas with heat capacity at constant pressure C_(P) undergoes the process T=T_(0)+alpha V where T_(0) and a are constants.If its volume increases from V_(1)toV_(2) the amount of heat transferred to the gas is C_(P)RT_(0)ln((V_(2))/(V_(1))) O alpha C_(P)((V_(2)-V_(1)))/(RT_(0))ln((V_(2))/(V_(1))) qquad alpha C_(P)(V_(2)-V_(1))+RT_(0)ln((V_(2))/(V_(1)))
View SolutionOne mole of an ideal gas with heat capacity at constant pressure C_(P) undergoes the process T=T_(0)+alpha V where T_(0) and a are constants.If its volume increases from V_(1)toV_(2) the amount of heat transferred to the gas is C_(P)RT_(0)ln((V_(2))/(V_(1))) alpha C_(P)((V_(2)-V_(1)))/(RT_(0))ln((V_(2))/(V_(1))) alpha C_(P)(V_(2)-V_(1))+RT_(0)ln((V_(2))/(V_(1)))
View Solution
