For an experiment in Botany, two different plants, plant A and plant B were grown under similar laboratory conditions. Their heights were measured at the end of each week for 3 weeks. The results are shown by the following graph.
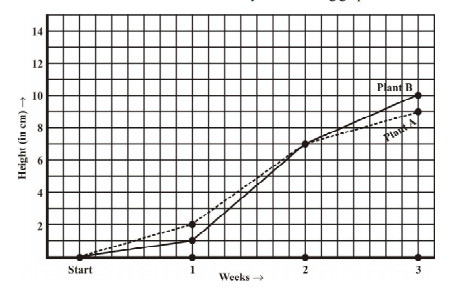 Were the two plants of the same height during any week shown here? SpecifySolution in Punjabi
Step by step video & image solution for For an experiment in Botany, two different plants, plant A and plant B were grown under similar laboratory conditions. Their heights were measured at the end of each week for 3 weeks. The results are shown by the following graph. Were the two plants of the same height during any week shown here? Specify by Maths experts to help you in doubts & scoring excellent marks in Class 8 exams.
Updated on:21/07/2023Topper's Solved these Questions
Similar Questions
Plot the point (4, 3) on a graph sheet. Is it the same as the point (3, 4)?
View SolutionFind the common factors of the given terms : 12x,36
View SolutionSolve the following equations. x – 2 = 7
View SolutionFor an experiement in Botany, two different plants, plant A and plant B were grown under similar laboratory conditions. Their heigths were measured at the end of each week for 3 weeks. The results are shown by the following graph.
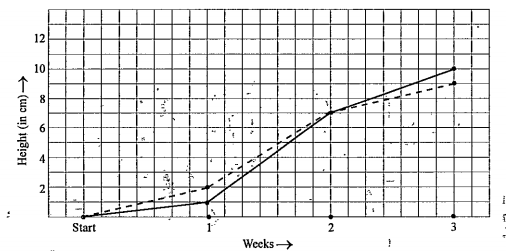
How high was Plant A after (i) 2 weeks (ii) 3 weeks?
View SolutionFor an experiment in Botany, two different plants, plant A and plant B were grown under similar laboratory conditions. Their heigths were measured at the end of each week for 3 weeks. The results are shown by the following graph.
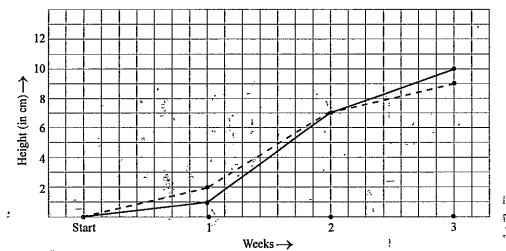
How high was Plant B after (i) 2 weeks (ii) 3 weeks?
View SolutionFor an experiment in Botany, two different plants, plant A and plant B were grown under similar laboratory conditions. Their heigths were measured at the end of each week for 3 weeks. The results are shown by the following graph.
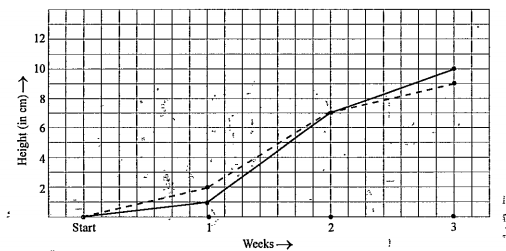
How much did Plant A grow during the 3rd week?
View SolutionFor an experiement in Botany, two different plants, plant A and plant B were grown under similar laboratory conditions. Their heigths were measured at the end of each week for 3 weeks. The results are shown by the following graph.
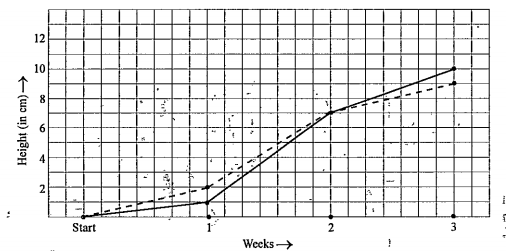
How much did Plant B grow from the end of the 2nd week to the end of the 3rd week?
View SolutionFor an experiment in Botany, two different plants, plant A and plant B were grown under similar laboratory conditions. Their heigths were measured at the end of each week for 3 weeks. The results are shown by the following graph.
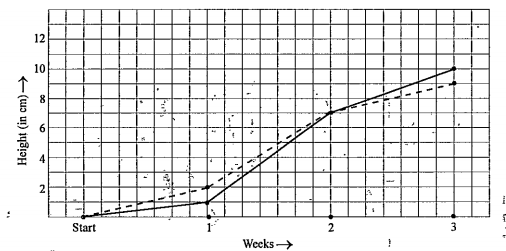
During which week did Plant A grow most?
View SolutionFor an experiement in Botany, two different plants, plant A and plant B were grown under similar laboratory conditions. Their heigths were measured at the end of each week for 3 weeks. The results are shown by the following graph.
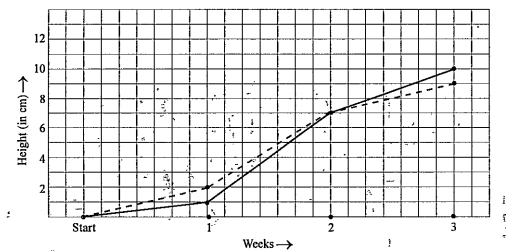
During which week did Plant B grow least?
View Solutionवनस्पति विज्ञान के एक प्रयोग में समान प्रयोशाला परिस्थितियों में दो पौधे A तथा B उगाए गए। तीन सप्ताहों तक उनकी ऊँचाइयों को हर सप्ताह के अन्त में मापा गया। परिणामों को निम्न आलेख में दर्शाया गया है:
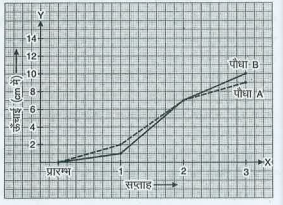 3 सप्ताह बाद पौधे B की ऊँचाई कितनी थी?
View Solutionवनस्पति विज्ञान के एक प्रयोग में समान प्रयोशाला परिस्थितियों में दो पौधे A तथा B उगाए गए। तीन सप्ताहों तक उनकी ऊँचाइयों को हर सप्ताह के अन्त में मापा गया। परिणामों को निम्न आलेख में दर्शाया गया है:
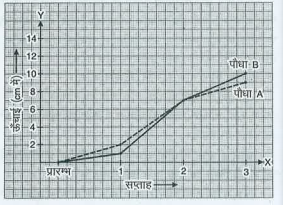
दूसरे सप्ताह के अन्त से तीसरे सप्ताह के अन्त तक पौधे B की ऊँचाई कितनी बढ़ी?
View Solutionवनस्पति विज्ञान के एक प्रयोग में समान प्रयोशाला परिस्थितियों में दो पौधे A तथा B उगाए गए। तीन सप्ताहों तक उनकी ऊँचाइयों को हर सप्ताह के अन्त में मापा गया। परिणामों को निम्न आलेख में दर्शाया गया है:
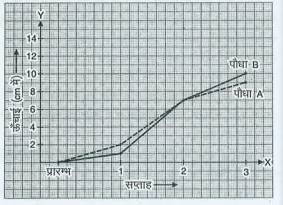 क्या किसी सप्ताह में दोनों पौधों की ऊँचाई समान थी ? पहचानिए।
View SolutionFor an experiment in Botany,two different plants, plant A nad plant B were grown under similar laboratory conditions.Their heights were measured at the end of each week for 3 weeks.The results are shown by the following graph.
How high was plant A after
2 weeks?
3 weeks?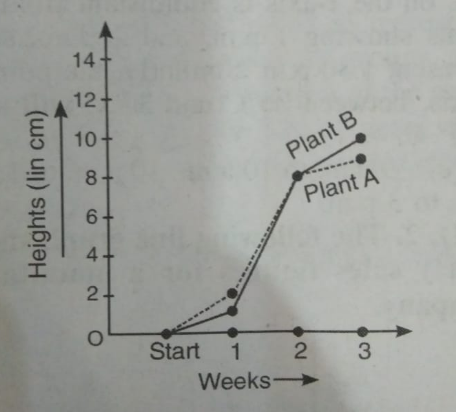
View SolutionFor an experiment in Botany,two different plants, plant A nad plant B were grown under similar laboratory conditions.Their heights were measured at the end of each week for 3 weeks.The results are shown by the following graph.
During which week did Plant A grow most?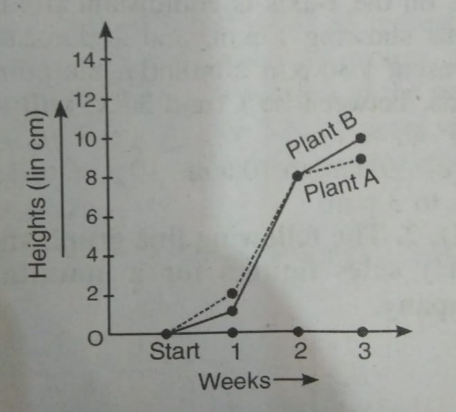
View SolutionFor an experiment in Botany,two different plants, plant A nad plant B were grown under similar laboratory conditions.Their heights were measured at the end of each week for 3 weeks.The results are shown by the following graph.
During which week did Plant A grow most?
View SolutionFor an experiment in Botany,two different plants, plant A nad plant B were grown under similar laboratory conditions.Their heights were measured at the end of each week for 3 weeks.The results are shown by the following graph.
During which week did Plant A grow most?
View Solution
