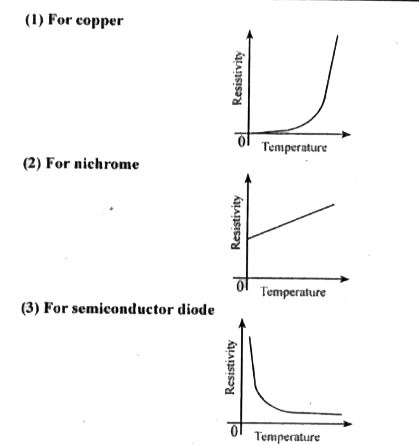
Draw the graphs representing the variation of resistivity with temperature for (1) copper (2) nichrome (3) a typical semiconductor. Solution in Kannada
The variation of resistivity with temperature

Topper's Solved these Questions
- II PUC PHYSICS (P.U. BOARD LATEST MODEL QUESTIONS PAPER -2)Book:SUNSTAR PUBLICATIONChapter:II PUC PHYSICS (P.U. BOARD LATEST MODEL QUESTIONS PAPER -2)Exercise:PART-D
Explore 11 Videos
- II PUC PHYSICS (P.U. BOARD LATEST MODEL QUESTIONS PAPER -2)Book:SUNSTAR PUBLICATIONChapter:II PUC PHYSICS (P.U. BOARD LATEST MODEL QUESTIONS PAPER -2)Exercise:PART-B
Explore 8 Videos
- ANNUAL EXAM QUESTION PAPER MARCH-2020Book:SUNSTAR PUBLICATIONChapter:ANNUAL EXAM QUESTION PAPER MARCH-2020Exercise:Part-D
Explore 11 Videos
- II PUC PHYSICS (ANNUAL EXAM QUESTION PAPER MARCH - 2019)Book:SUNSTAR PUBLICATIONChapter:II PUC PHYSICS (ANNUAL EXAM QUESTION PAPER MARCH - 2019)Exercise:PART - A
Explore 37 Videos
Similar Questions
State Gauss theorem in electrostatics. Derive the expression for electric field at a point due to an infinitely long straight charged conductor.
View SolutionGive any two practical limitations of Ohm's law.
View SolutionDerive σ=ne2τm
where the symbols have their usual meaning.
View SolutionState Coulomb.s law
View SolutionShow on a graph, the variation of resistivity with temperature for a typical semiconductor.
View SolutionShow on graph, the variation of resistivity with temperature for a typical semiconductor. What is the order of resistivity of an conductor, semiconductor, Insulator ?
View Solutionताप के फलन के रूप में निक्रोम की प्रतिरोधकता हेतु ग्राफ खींचिए।
View SolutionRepresent graphically the variation of resistivity with absolute temperature for copper and nichrome metals .
View SolutionDraw a graph of resistivity of nichrome as a function of absolute temperature.
View SolutionRepresent graphically the variation of resistivity with absolute temperature for copper and nichrome metals.
View SolutionDefine the terms resistivity and conductivity and state their S. I. units. Draw a graph showing the variation of resistivity with temperature for a typical semiconductor.
View Solutionwhich of the following graph represents the variation of resistivity (ρ) with temperature (T) for copper?
View SolutionShow on a graph the variation of resistivity with temperature for a typical semiconductor
View SolutionDraw a graph showing variation of resistivity with temperature for nichrome. Which property of nichrome is used to make standard resistance coils ?
View SolutionDraw a graph showing the variation of resistivity with temperature for nichrome. Which property of nichrome is used to make standard resistance coils?
View Solution

