Which of the following energy-time graphs represents dajmped harmonic oscillator?
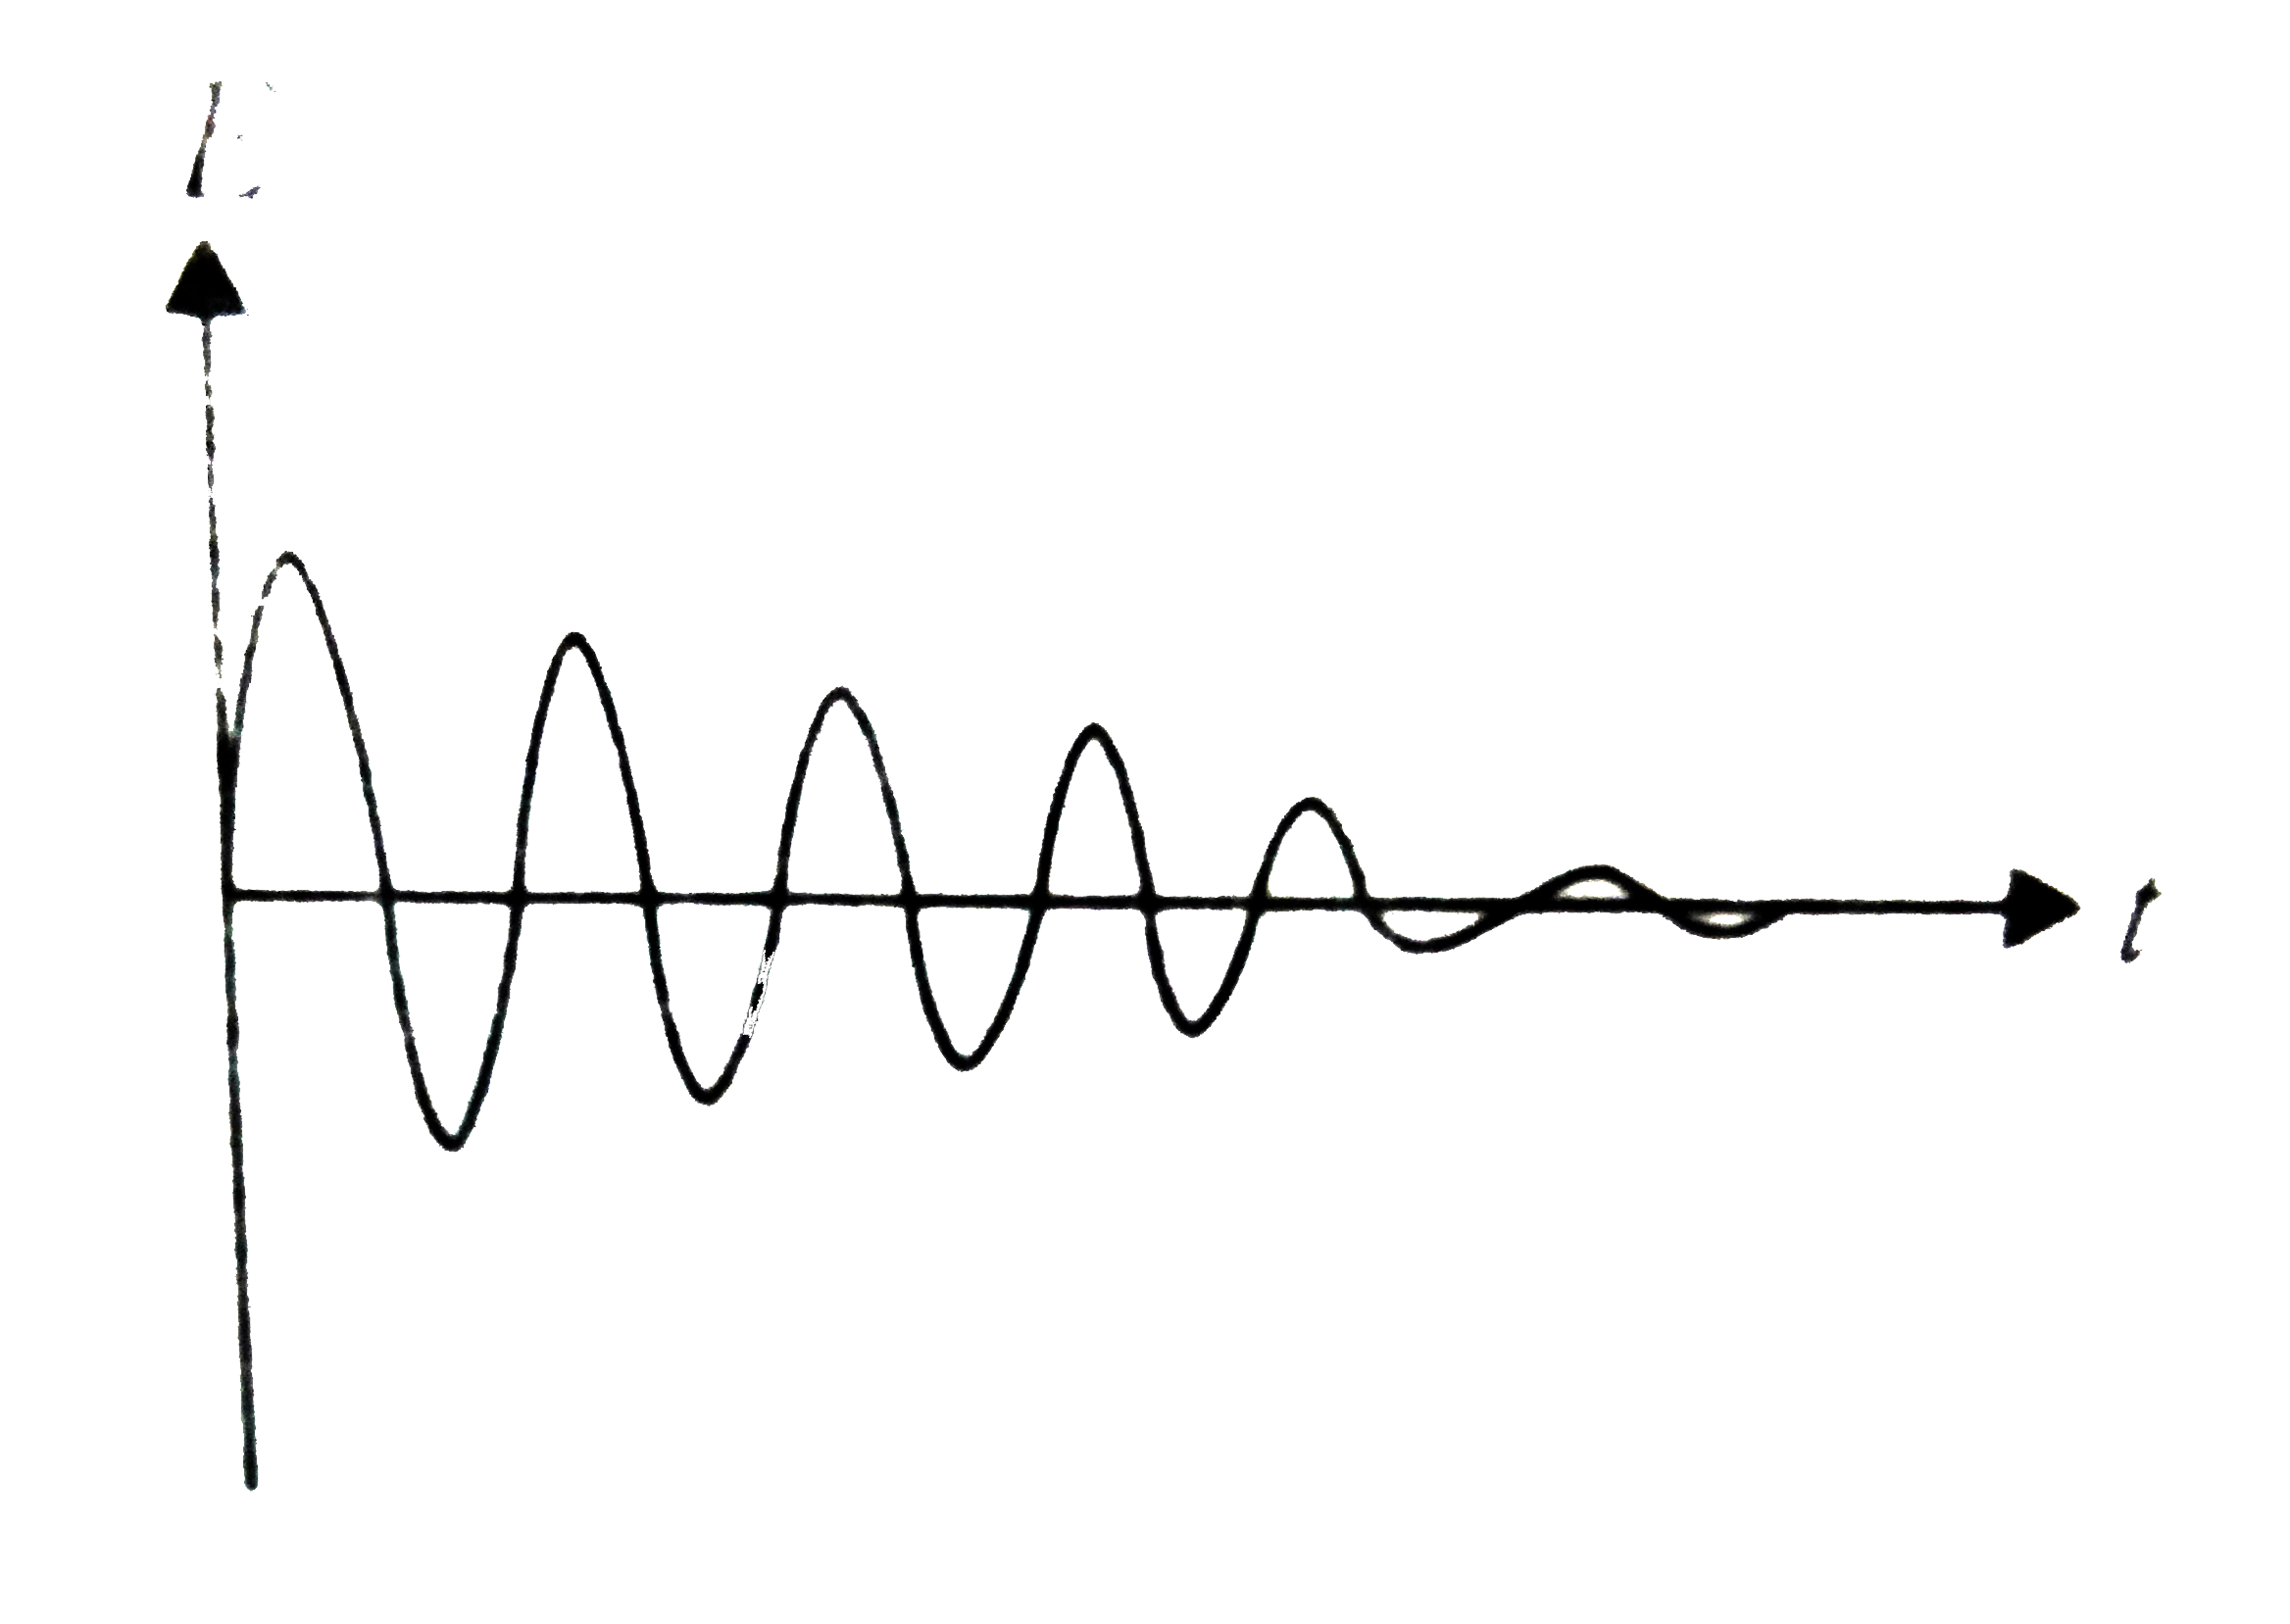
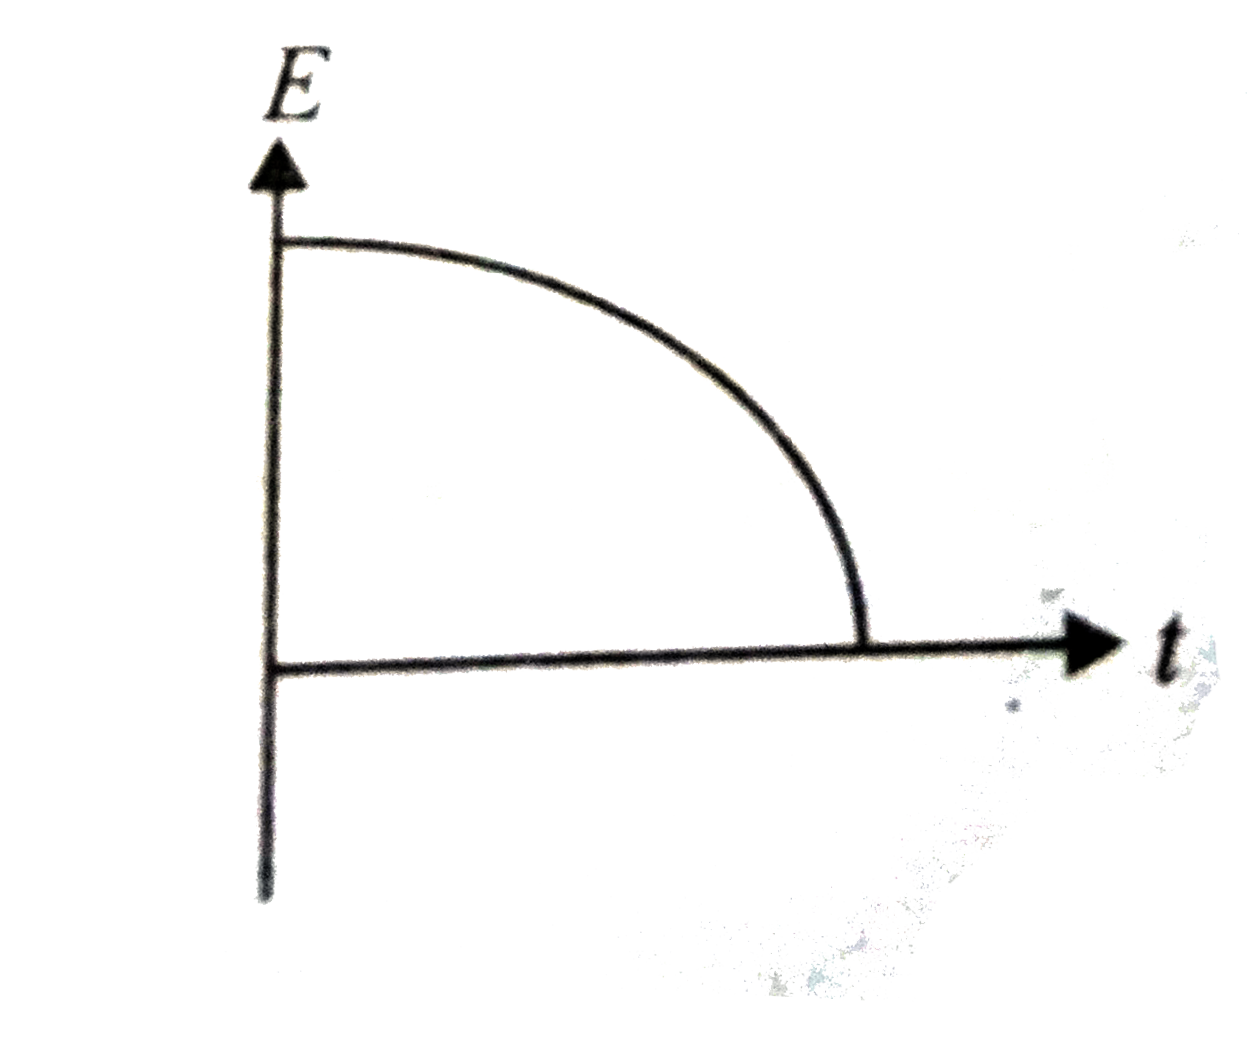
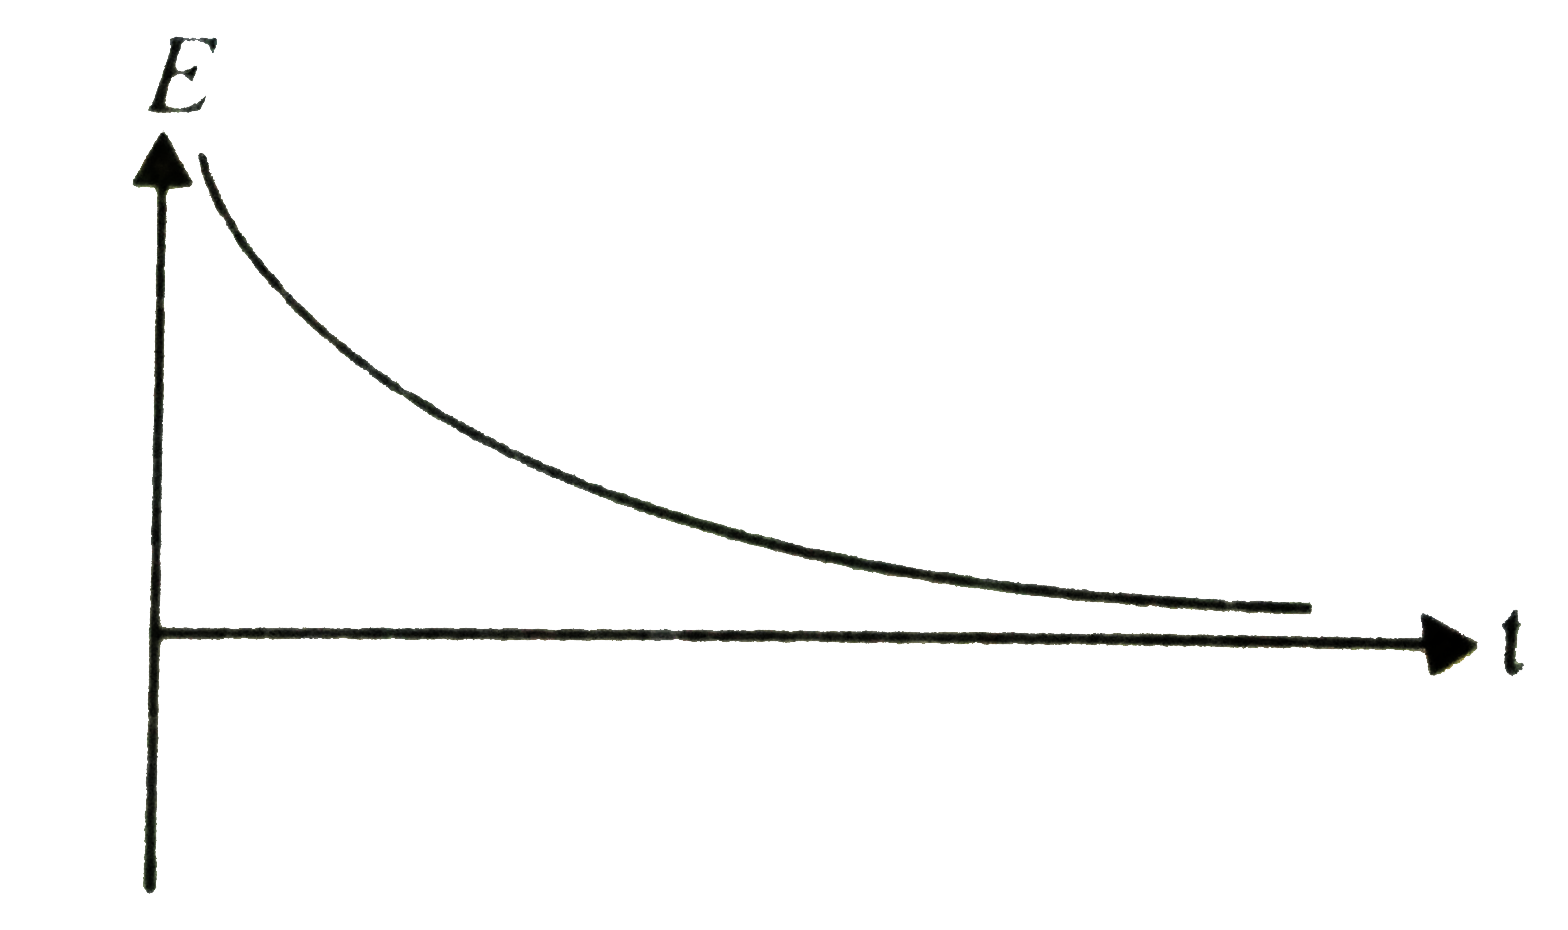
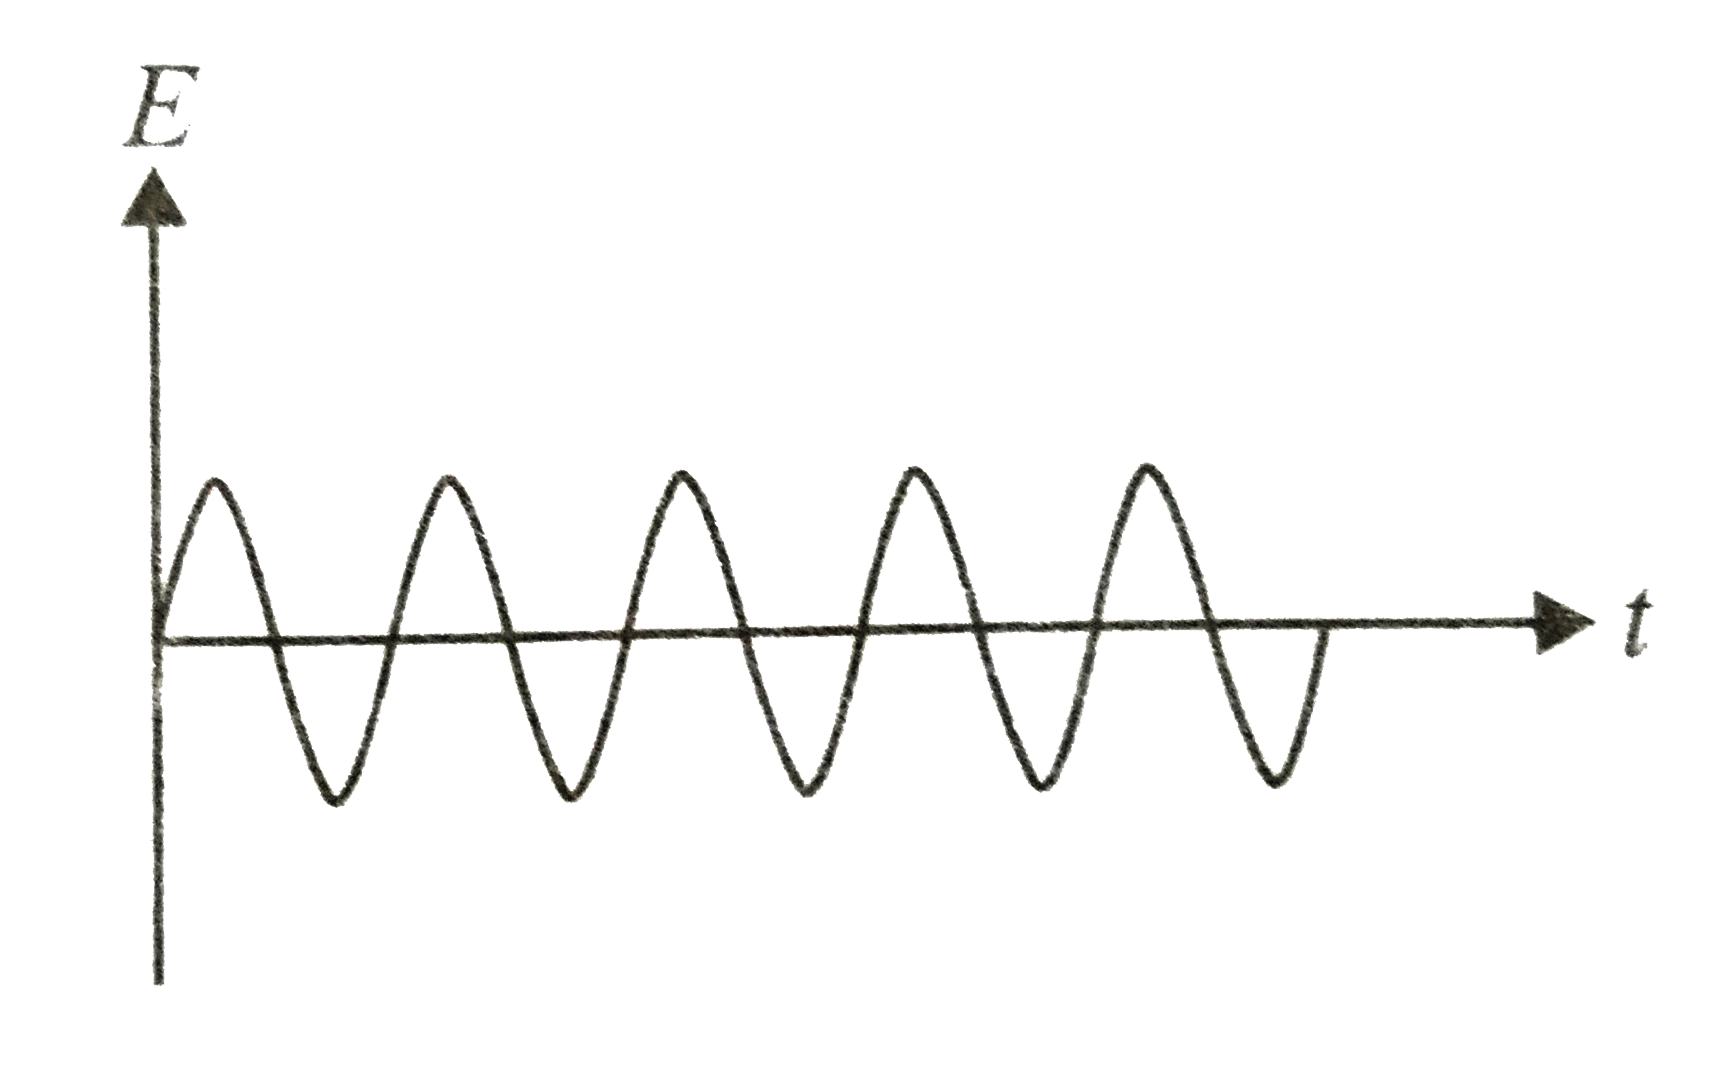
The correct Answer is:C
To determine which energy-time graph represents a damped harmonic oscillator, we can follow these steps:
Step 1: Understand the behavior of a damped harmonic oscillator
A damped harmonic oscillator experiences a decrease in energy over time due to the presence of damping forces, such as friction or air resistance. This means that as time progresses, the total mechanical energy of the system decreases.
Step 2: Analyze the energy equation
The energy E of a damped harmonic oscillator can be expressed as:
E=12kA2e−bmt
where:
- k is the spring constant,
- A is the amplitude,
- b is the damping coefficient,
- m is the mass of the oscillator,
- t is time.
From this equation, we can see that the energy decreases exponentially with time due to the term e−bmt.
Step 3: Identify the characteristics of the graph
Since the energy decreases exponentially, the graph of energy versus time will show a curve that starts at a certain value and approaches zero as time increases. The graph should not be linear; instead, it should show a rapid decrease initially that slows down over time.
Step 4: Evaluate the options
Now, we need to evaluate the given options (not provided here) and look for the graph that displays the characteristics of exponential decay. The correct graph should show:
- A steep decline at first,
- Gradual leveling off as time progresses,
- Never actually reaching zero but approaching it asymptotically.
Step 5: Conclusion
After analyzing the options based on the above characteristics, we can conclude that the graph that represents a damped harmonic oscillator is the one that shows an exponential decrease in energy over time.
In the context of the provided solution, it was determined that option C represents the correct energy-time graph for a damped harmonic oscillator.
A damped harmonic oscillator experiences a decrease in energy over time due to the presence of damping forces, such as friction or air resistance. This means that as time progresses, the total mechanical energy of the system decreases.
The energy E of a damped harmonic oscillator can be expressed as:
E=12kA2e−bmt
where:
- k is the spring constant,
- A is the amplitude,
- b is the damping coefficient,
- m is the mass of the oscillator,
- t is time.
Since the energy decreases exponentially, the graph of energy versus time will show a curve that starts at a certain value and approaches zero as time increases. The graph should not be linear; instead, it should show a rapid decrease initially that slows down over time.
Now, we need to evaluate the given options (not provided here) and look for the graph that displays the characteristics of exponential decay. The correct graph should show:
- A steep decline at first,
- Gradual leveling off as time progresses,
- Never actually reaching zero but approaching it asymptotically.
After analyzing the options based on the above characteristics, we can conclude that the graph that represents a damped harmonic oscillator is the one that shows an exponential decrease in energy over time.
Topper's Solved these Questions
- OSCILLATIONS BOOK - NCERT FINGERTPS ENGLISHCHAPTER - OSCILLATIONS EXERCISE - Higher Order Thinking Skills
8 Videos
- OSCILLATIONS BOOK - NCERT FINGERTPS ENGLISHCHAPTER - OSCILLATIONS EXERCISE - Exemplar Problems
9 Videos
- MOTION IN A STRAIGHT LINEBOOK - NCERT FINGERTPS ENGLISHCHAPTER - MOTION IN A STRAIGHT LINEEXERCISE - NCERT Exemplar
6 Videos
- PHYSICAL WORLDBOOK - NCERT FINGERTPS ENGLISHCHAPTER - PHYSICAL WORLDEXERCISE - Assertion And Reason
10 Videos
Similar Questions
Knowledge Check
Which of the following displacement-time graphs represent damped harmonic oscillation?
A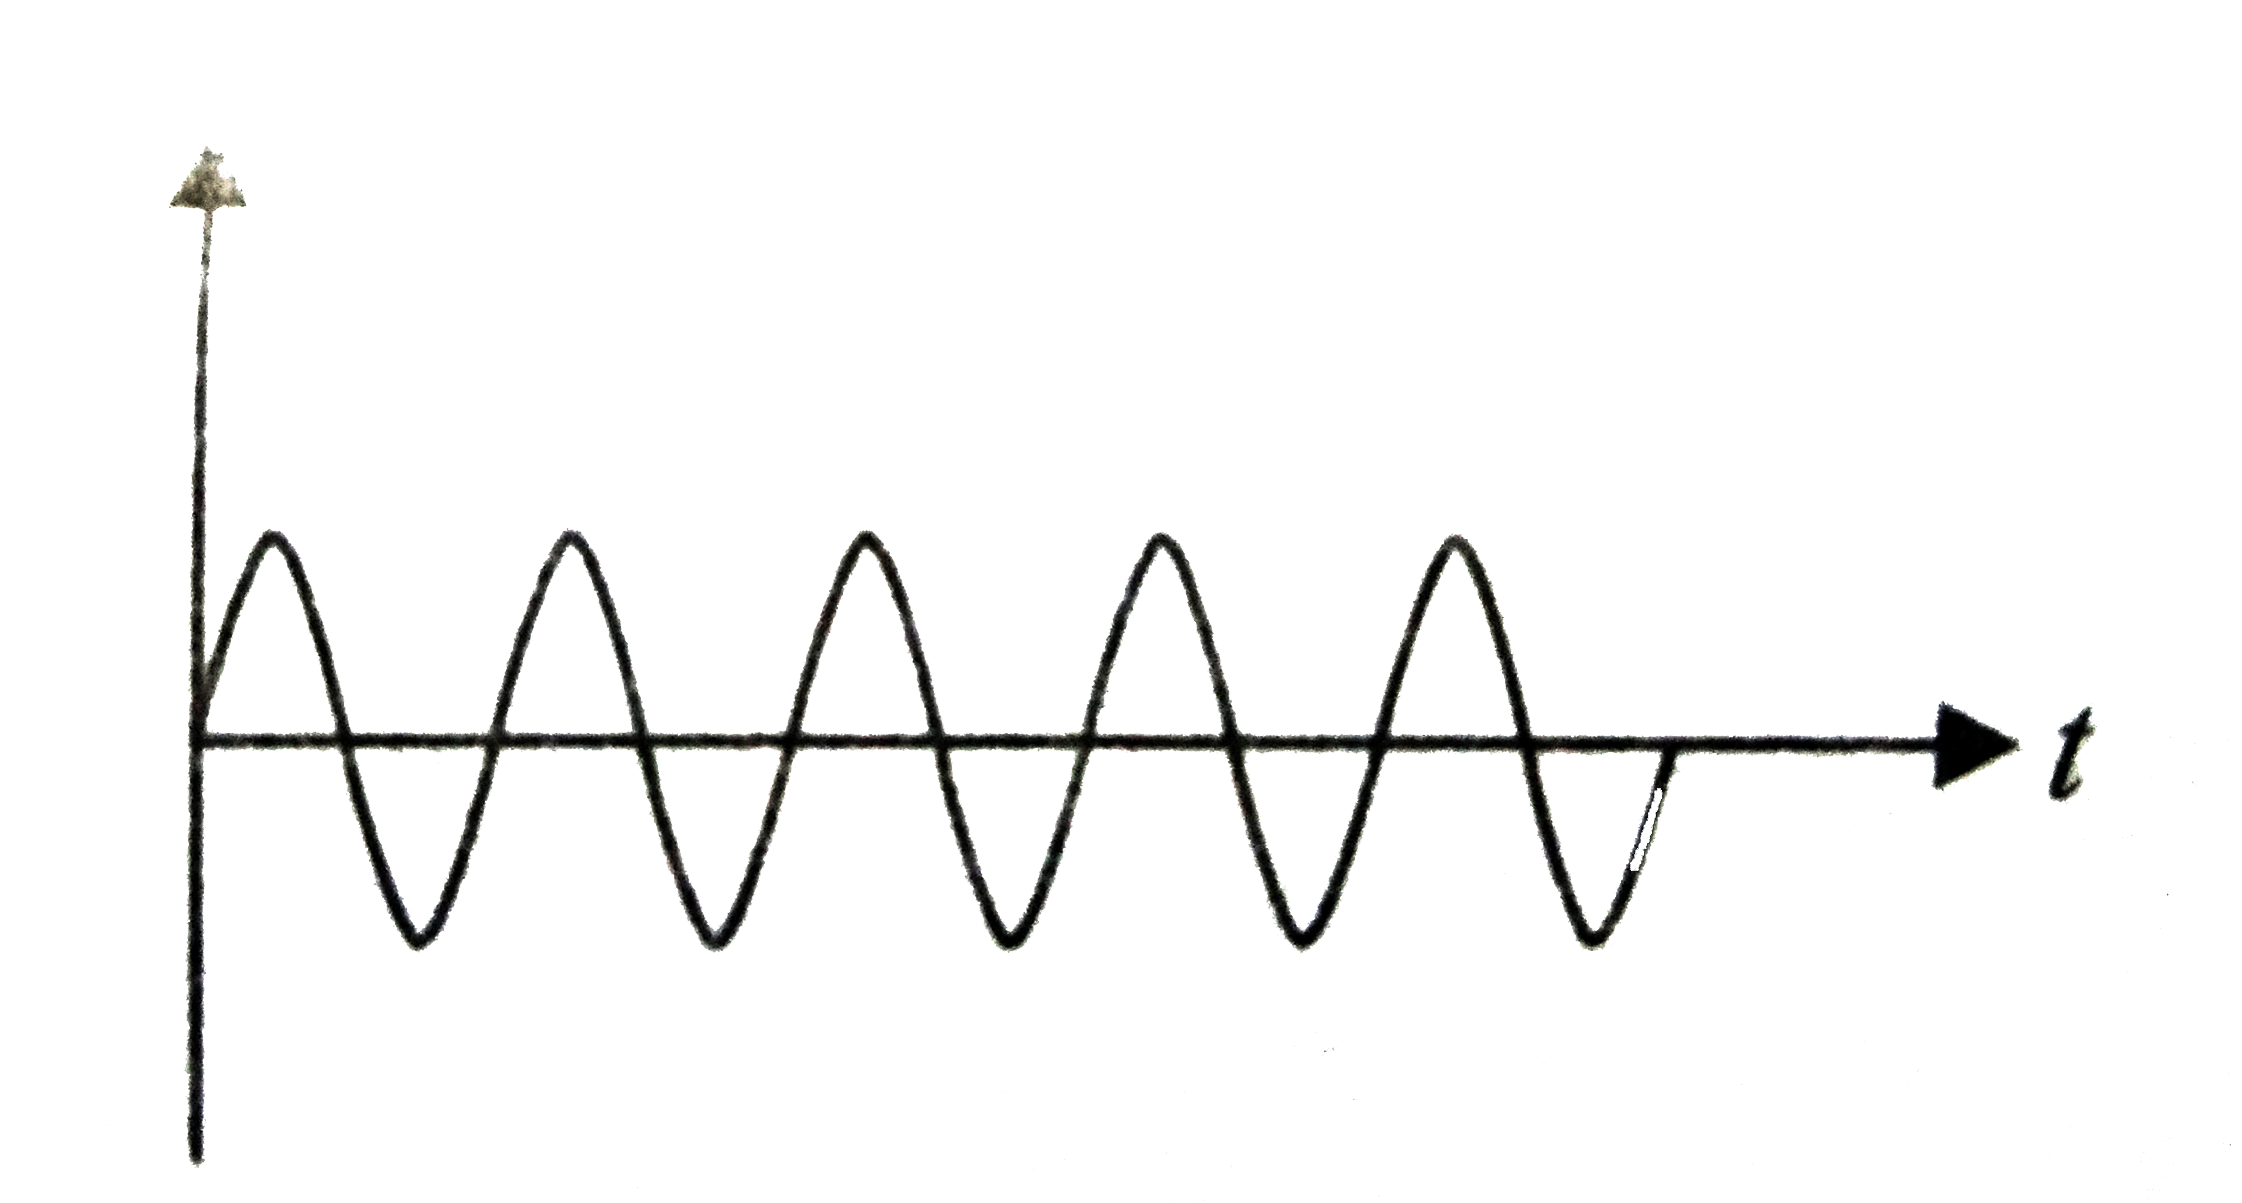 B
B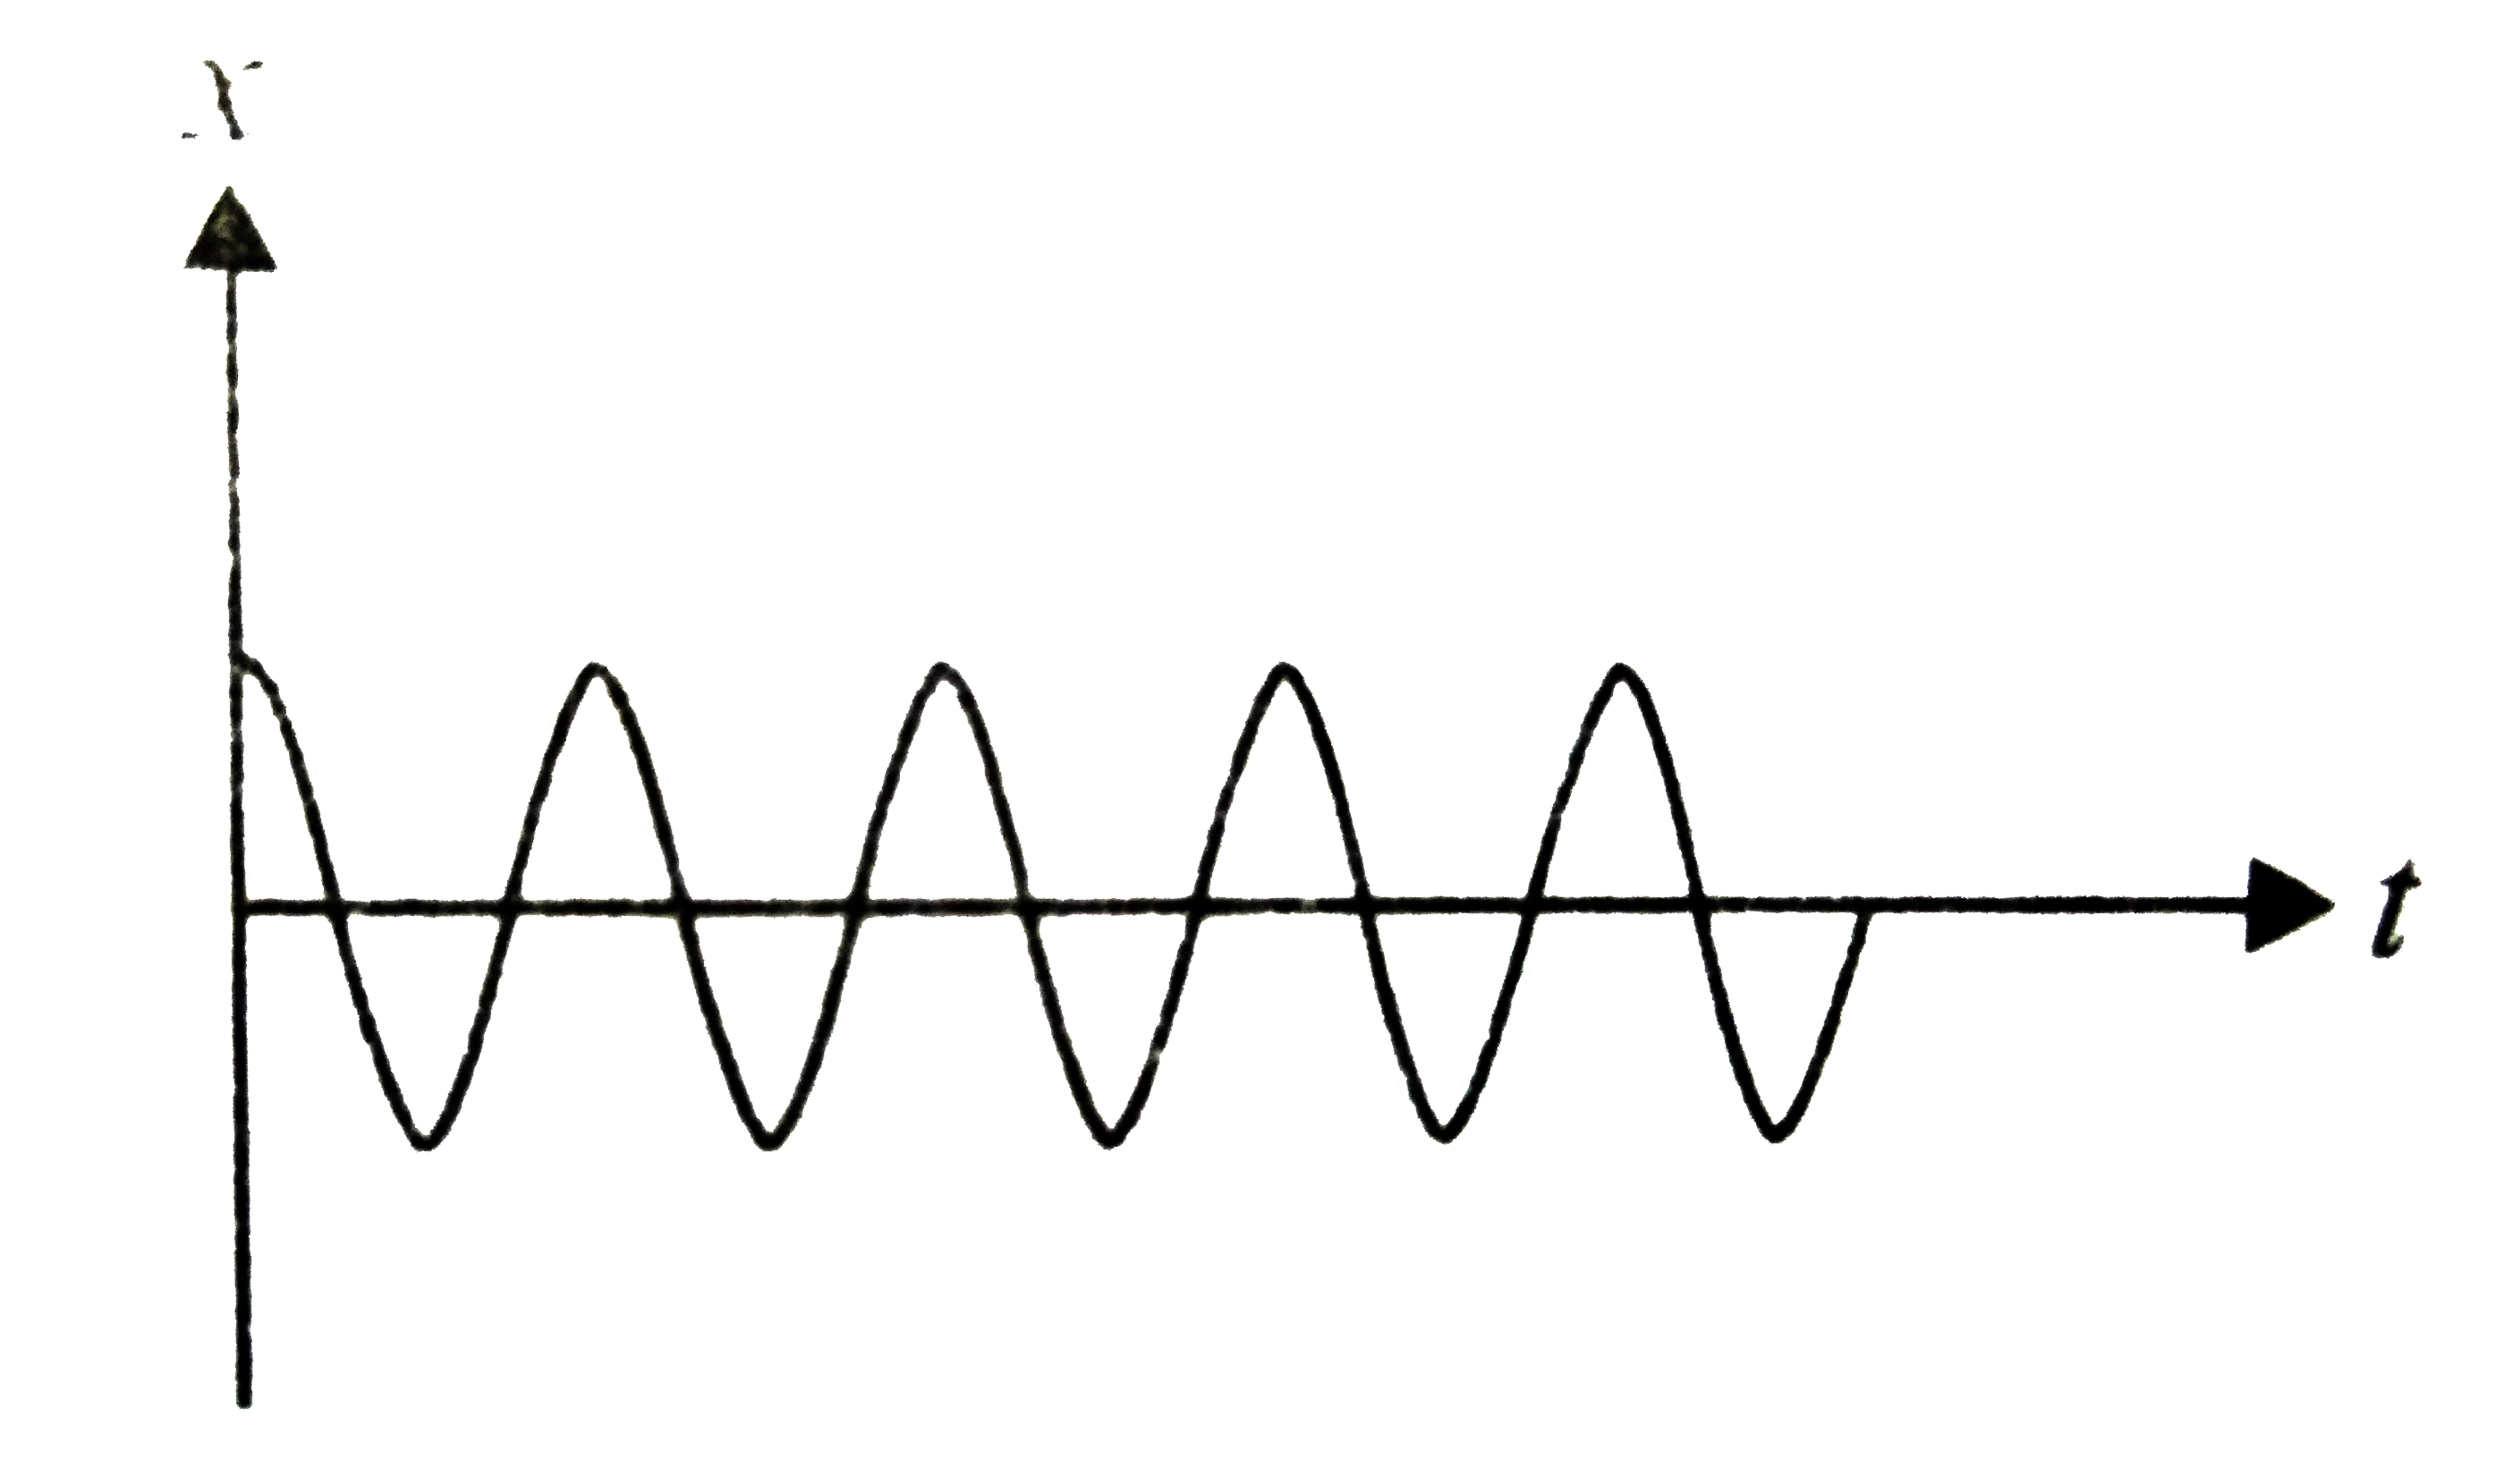 C
C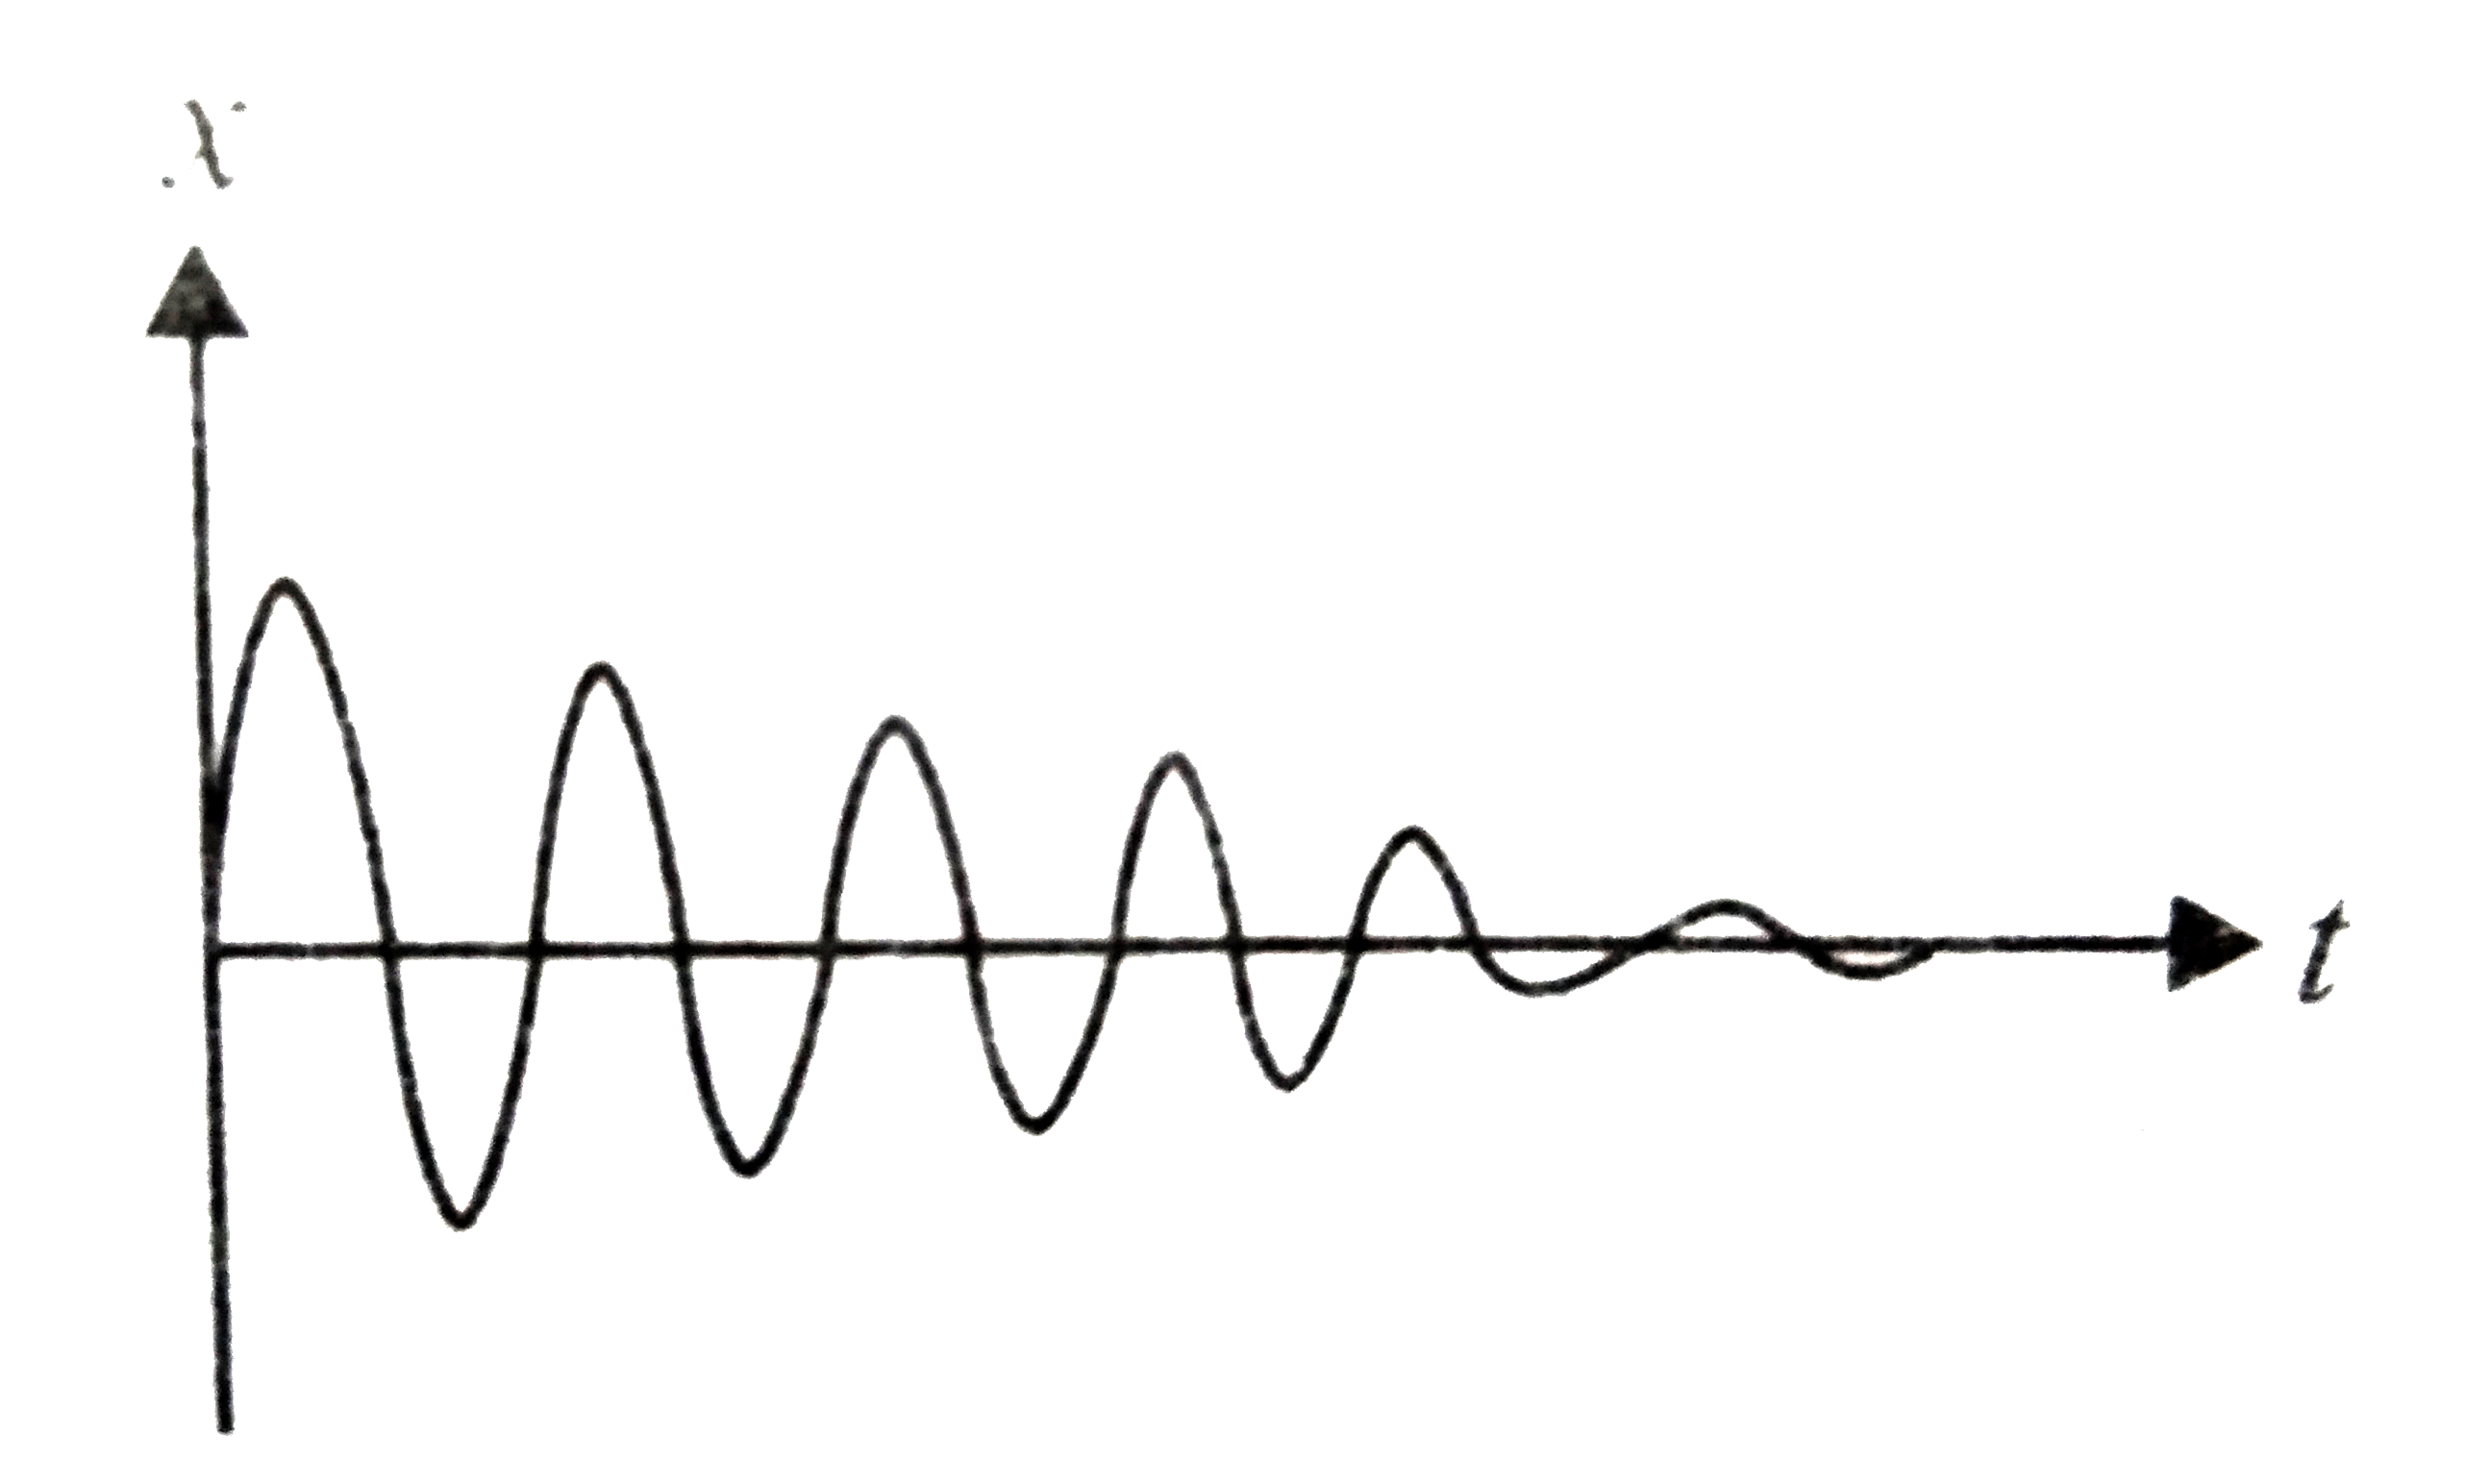 D
D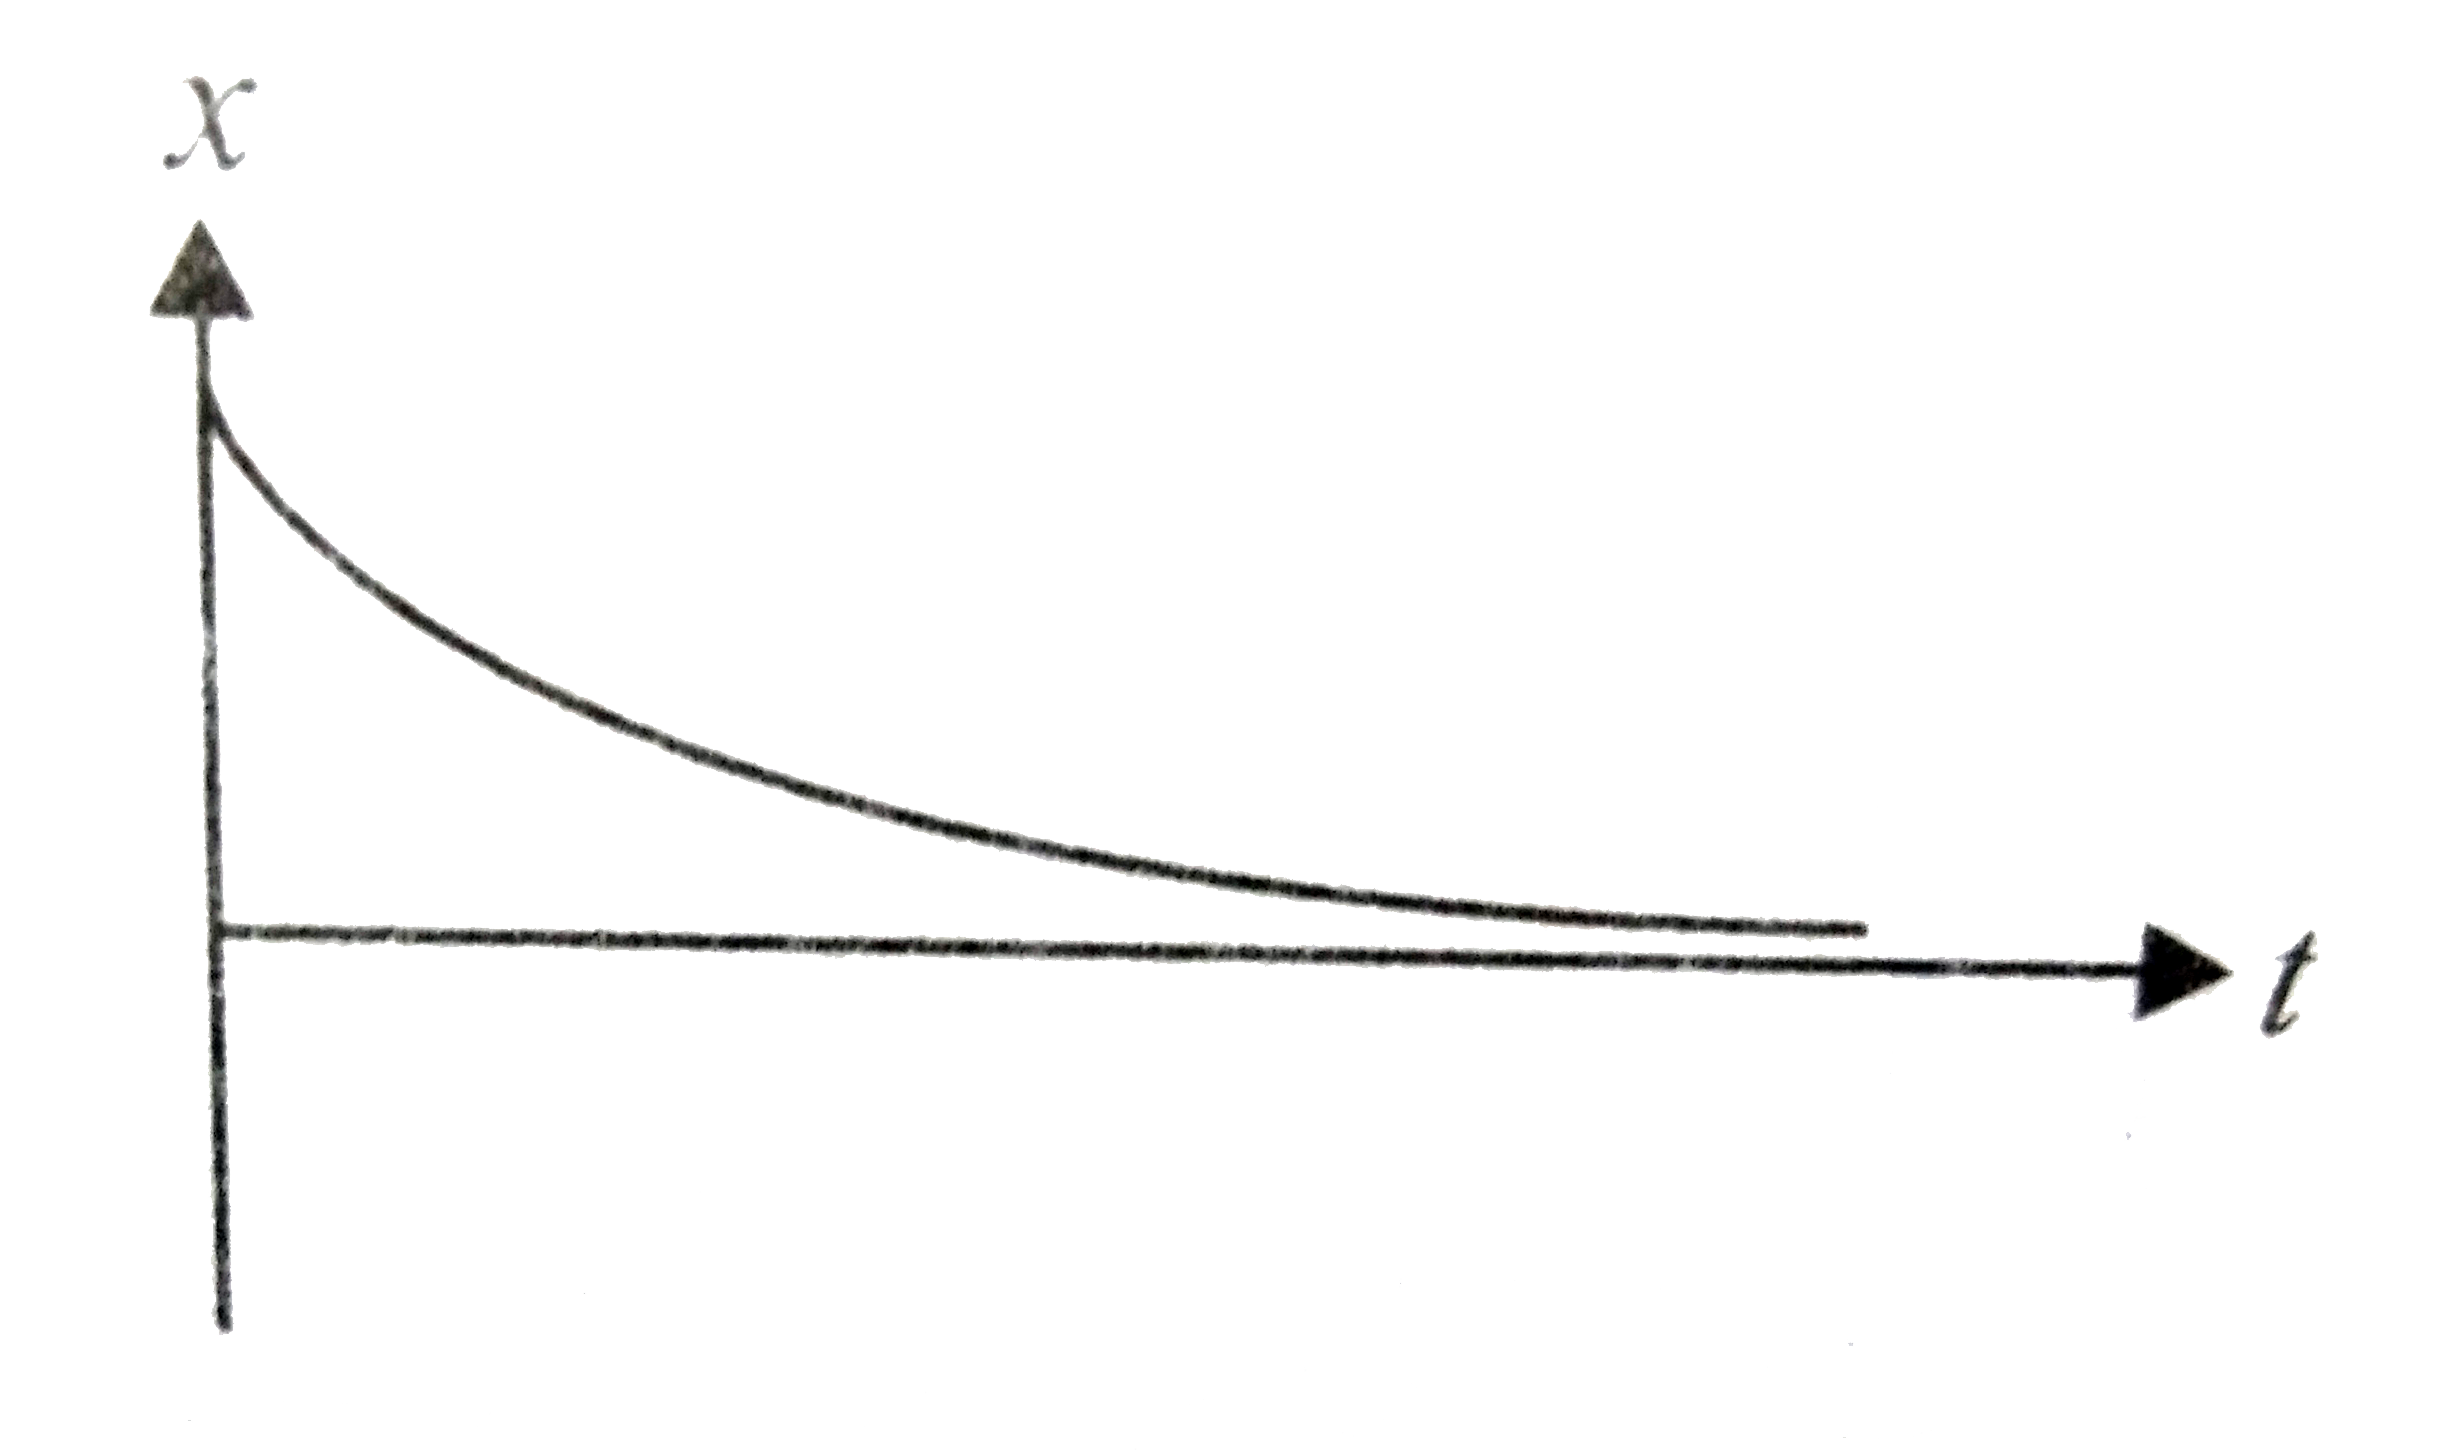
Which of the following expression does not represent simple harmonic motion?
Ax=Acosω+BsinωBx=Acos(ωt+α)Cx=Bsin(ωt+B)Dx=Asinωtcos2ωtWhich of the following graphs represents exothermic reaction ?
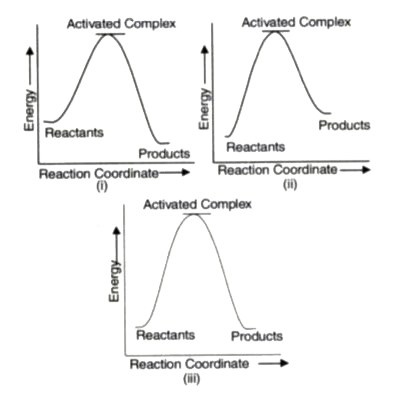 A(i) onlyB(ii) onlyC(iii) onlyD(i) and (ii)
Which of the following graph represents Boyle's law ?
View SolutionWhich of the following graph represents uniform motion
View SolutionWhich of the following graph represents uniform motion
View SolutionWhich of the following equation represents damped oscillation?
View SolutionWhich of the following statements is/are true for a simple harmonic oscillator ?
View Solution
