Ellingham diagram represents:
A
change of ΔG with temperature
B
change of ΔGH with temperature
C
change of ΔG with pressure
D
change of (ΔG−TΔS) with temperature
Video Solution
Text Solution
The correct Answer is:A
Ellingham diagram represents change in value of ΔG with temperature (in K).
|
Similar Questions
Knowledge Check
Ellingham diagram respresents:
Achange of ΔG with temperature.Bchange of ΔH with temperature.Cchange of ΔG with pressure.Dchange of (ΔG−TΔS) with temperature.Elingham diagram represents.
AChange of ΔG with temperatureBChange of ΔH with temperatureCChange of ΔG with pressureDChange of (ΔG−TΔS) with temperatureThe diagram represents
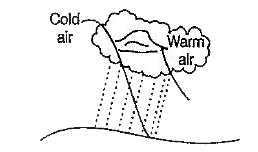
 AOrographic RainfallBConvectional RainfallCCyclonic RainfallDPre-monsoon Rainfall
The incorrect statement for Ellingham diagram is
View SolutionThe diagram represents

View SolutionThe following diagram represents:

a) Adaptive radiation
b) Divergent evolution
c) Convergent evolution
d) Both (a) and (b)
View SolutionThe following diagram represents the situation of:

View SolutionThe statement that is INCORRECT about Ellingham diagram is
View Solution
