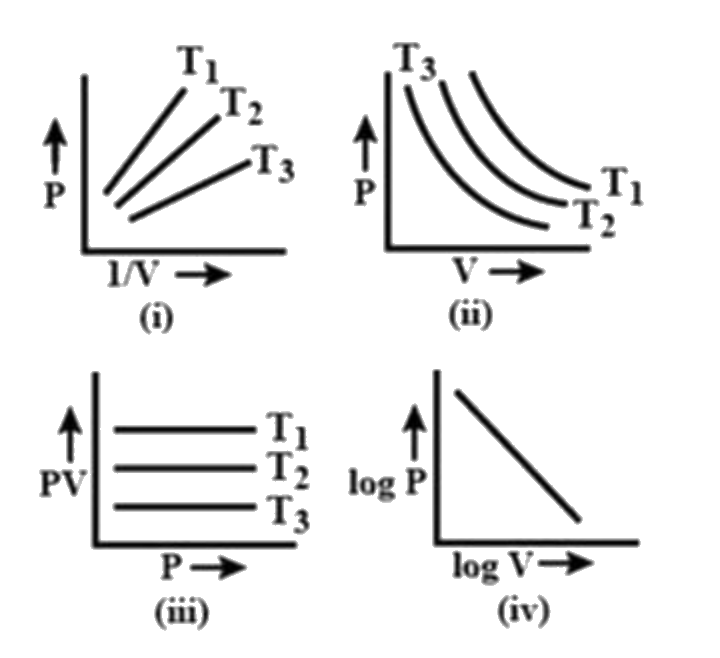
Which effect is observed in Isothermal graph with temperature ? Solution in Gujrati
Value of K changes with charge with temperature.
Slope increases if temperature increases.
Slope : T3>T2>T1 where,
Temperature : T3>T2>T1
Topper's Solved these Questions
- STATES OF MATTER BOOK - KUMAR PRAKASHANCHAPTER - STATES OF MATTER EXERCISE - SECTION - C MULIPLE CHOICE QUESTIONS (MCQs)
93 Videos
- STATES OF MATTER BOOK - KUMAR PRAKASHANCHAPTER - STATES OF MATTER EXERCISE - SECTION - D SOLUTION OF NCERT EXEMPLAR PROBLEMS (Multiple Choice Questions)
17 Videos
- STATES OF MATTER BOOK - KUMAR PRAKASHANCHAPTER - STATES OF MATTER EXERCISE - SECTION - A QUESTIONS (TRY YOUR SELF)
47 Videos
- SOME BASIC CONCEPTS OF CHEMISTRYBOOK - KUMAR PRAKASHANCHAPTER - SOME BASIC CONCEPTS OF CHEMISTRYEXERCISE - Section - D (Solutions of NCERT Exemplar Problems) (Long Answer Type Questions)
4 Videos
- STRUCTURE OF ATOMBOOK - KUMAR PRAKASHANCHAPTER - STRUCTURE OF ATOMEXERCISE - QUESTINS PAPER FROM MODULE (SECTION -D)
2 Videos
Similar Questions
London Force is which type of force ?
View SolutionA person living in Shimla observed that cooking food without using pressure cooker takes more time. The reason for this observation is that at high altitude :
View SolutionAt 300 K constant temperature gas having 20cm3, 1 bar pressure it is convert into 50cm3 then calculated pressure ?
View SolutionA vessel contains 1.6 g of dioxygen at STP (273.15 K, 1 atm pressure). The gas is now transferred to another vessel at constant temperature, where pressure becomes half of the original pressure. Calculate
(A) volume of the new vessel.
(B) number of molecules of dioxygen.
View SolutionExplain Heisenberg’s uncertainty principle.
View SolutionWhich of the following graphs represents freundlich adsorption isotherm?
View SolutionIn following isothermal graphs A, B and C at temperatures T_(1), T_(2) and T_(3) , the correct order of temperatures will be :
View SolutionExplain the given graph : Observe the graph below . Temperature of water is raised from 0^(@)C , observe the change in volume at different temperatures and explain the behavior of water .
View SolutionWhich effect is observed only below a certain temperature?
View SolutionWhich of the following graphs freundlich adsorption isotherm?
View SolutionGraph between pressure and volume are plotted at different temperature. Which of the following isotherms represent Boyle's law as PV = constant?

View SolutionWhich graphs are called isotherm?
View SolutionIsothermal (temperature=constant) graphs of a gas is its
View Solutionनिम्न में से कौन-सा ग्राफ फ्रॉयंडलिक अधिशोषण समतापी के अनुसार है?
View SolutionWhich of the following graph represents Freundlich adsorption isotherm
View Solution
