Position time graph of a body of mass 1kg is shown in the figure.Calculate net force acting on a body for the time interval 0<t<1 sec.
To solve the problem of calculating the net force acting on a body with a mass of 1 kg during the time interval from 0 to 1 second based on the position-time graph, we can follow these steps:
1. Understand the Position-Time Graph:
- The position-time graph shows how the position of the body changes with time. We need to analyze the graph between 0 and 1 second.
2. Determine the Slope of the Graph:
- The slope of the position-time graph represents the velocity of the body. A linear increase in position indicates a constant velocity.
- From the graph, at t=0 seconds, the position is approximately 0 meters, and at t=1 second, the position is approximately 0.5 meters.
3. Calculate the Velocity:
- The velocity v can be calculated using the formula:
v=ΔxΔt
- Here, Δx=0.5m−0m=0.5m and Δt=1s−0s=1s.
- Therefore,
v=0.5m1s=0.5m/s
4. Determine the Acceleration:
- Since the position-time graph is linear, the velocity is constant throughout the interval from 0 to 1 second.
- The acceleration a is defined as the rate of change of velocity:
a=dvdt
- Since the velocity is constant (0.5 m/s), the change in velocity dv=0.
- Thus,
a=0m/s2
5. Calculate the Net Force:
- The net force F acting on the body can be calculated using Newton's second law:
F=m⋅a
- Given that the mass m=1kg and the acceleration a=0m/s2:
F=1kg⋅0m/s2=0N
Final Answer:
The net force acting on the body during the time interval from 0 to 1 second is 0N.
- The position-time graph shows how the position of the body changes with time. We need to analyze the graph between 0 and 1 second.
- The slope of the position-time graph represents the velocity of the body. A linear increase in position indicates a constant velocity.
- From the graph, at t=0 seconds, the position is approximately 0 meters, and at t=1 second, the position is approximately 0.5 meters.
- The velocity v can be calculated using the formula:
v=ΔxΔt
- Here, Δx=0.5m−0m=0.5m and Δt=1s−0s=1s.
- Therefore,
v=0.5m1s=0.5m/s
- Since the position-time graph is linear, the velocity is constant throughout the interval from 0 to 1 second.
- The acceleration a is defined as the rate of change of velocity:
a=dvdt
- Since the velocity is constant (0.5 m/s), the change in velocity dv=0.
- Thus,
a=0m/s2
- The net force F acting on the body can be calculated using Newton's second law:
F=m⋅a
- Given that the mass m=1kg and the acceleration a=0m/s2:
F=1kg⋅0m/s2=0N
The net force acting on the body during the time interval from 0 to 1 second is 0N.
Topper's Solved these Questions
Similar Questions
Knowledge Check
The position-time graph of a particle of mass 0.1 kg is shown. The impulse at t = 2s is :
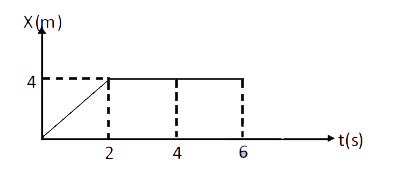 A0.2kgms−1B0.02kgms−1C0.1kgms−1D0.4kgms−1
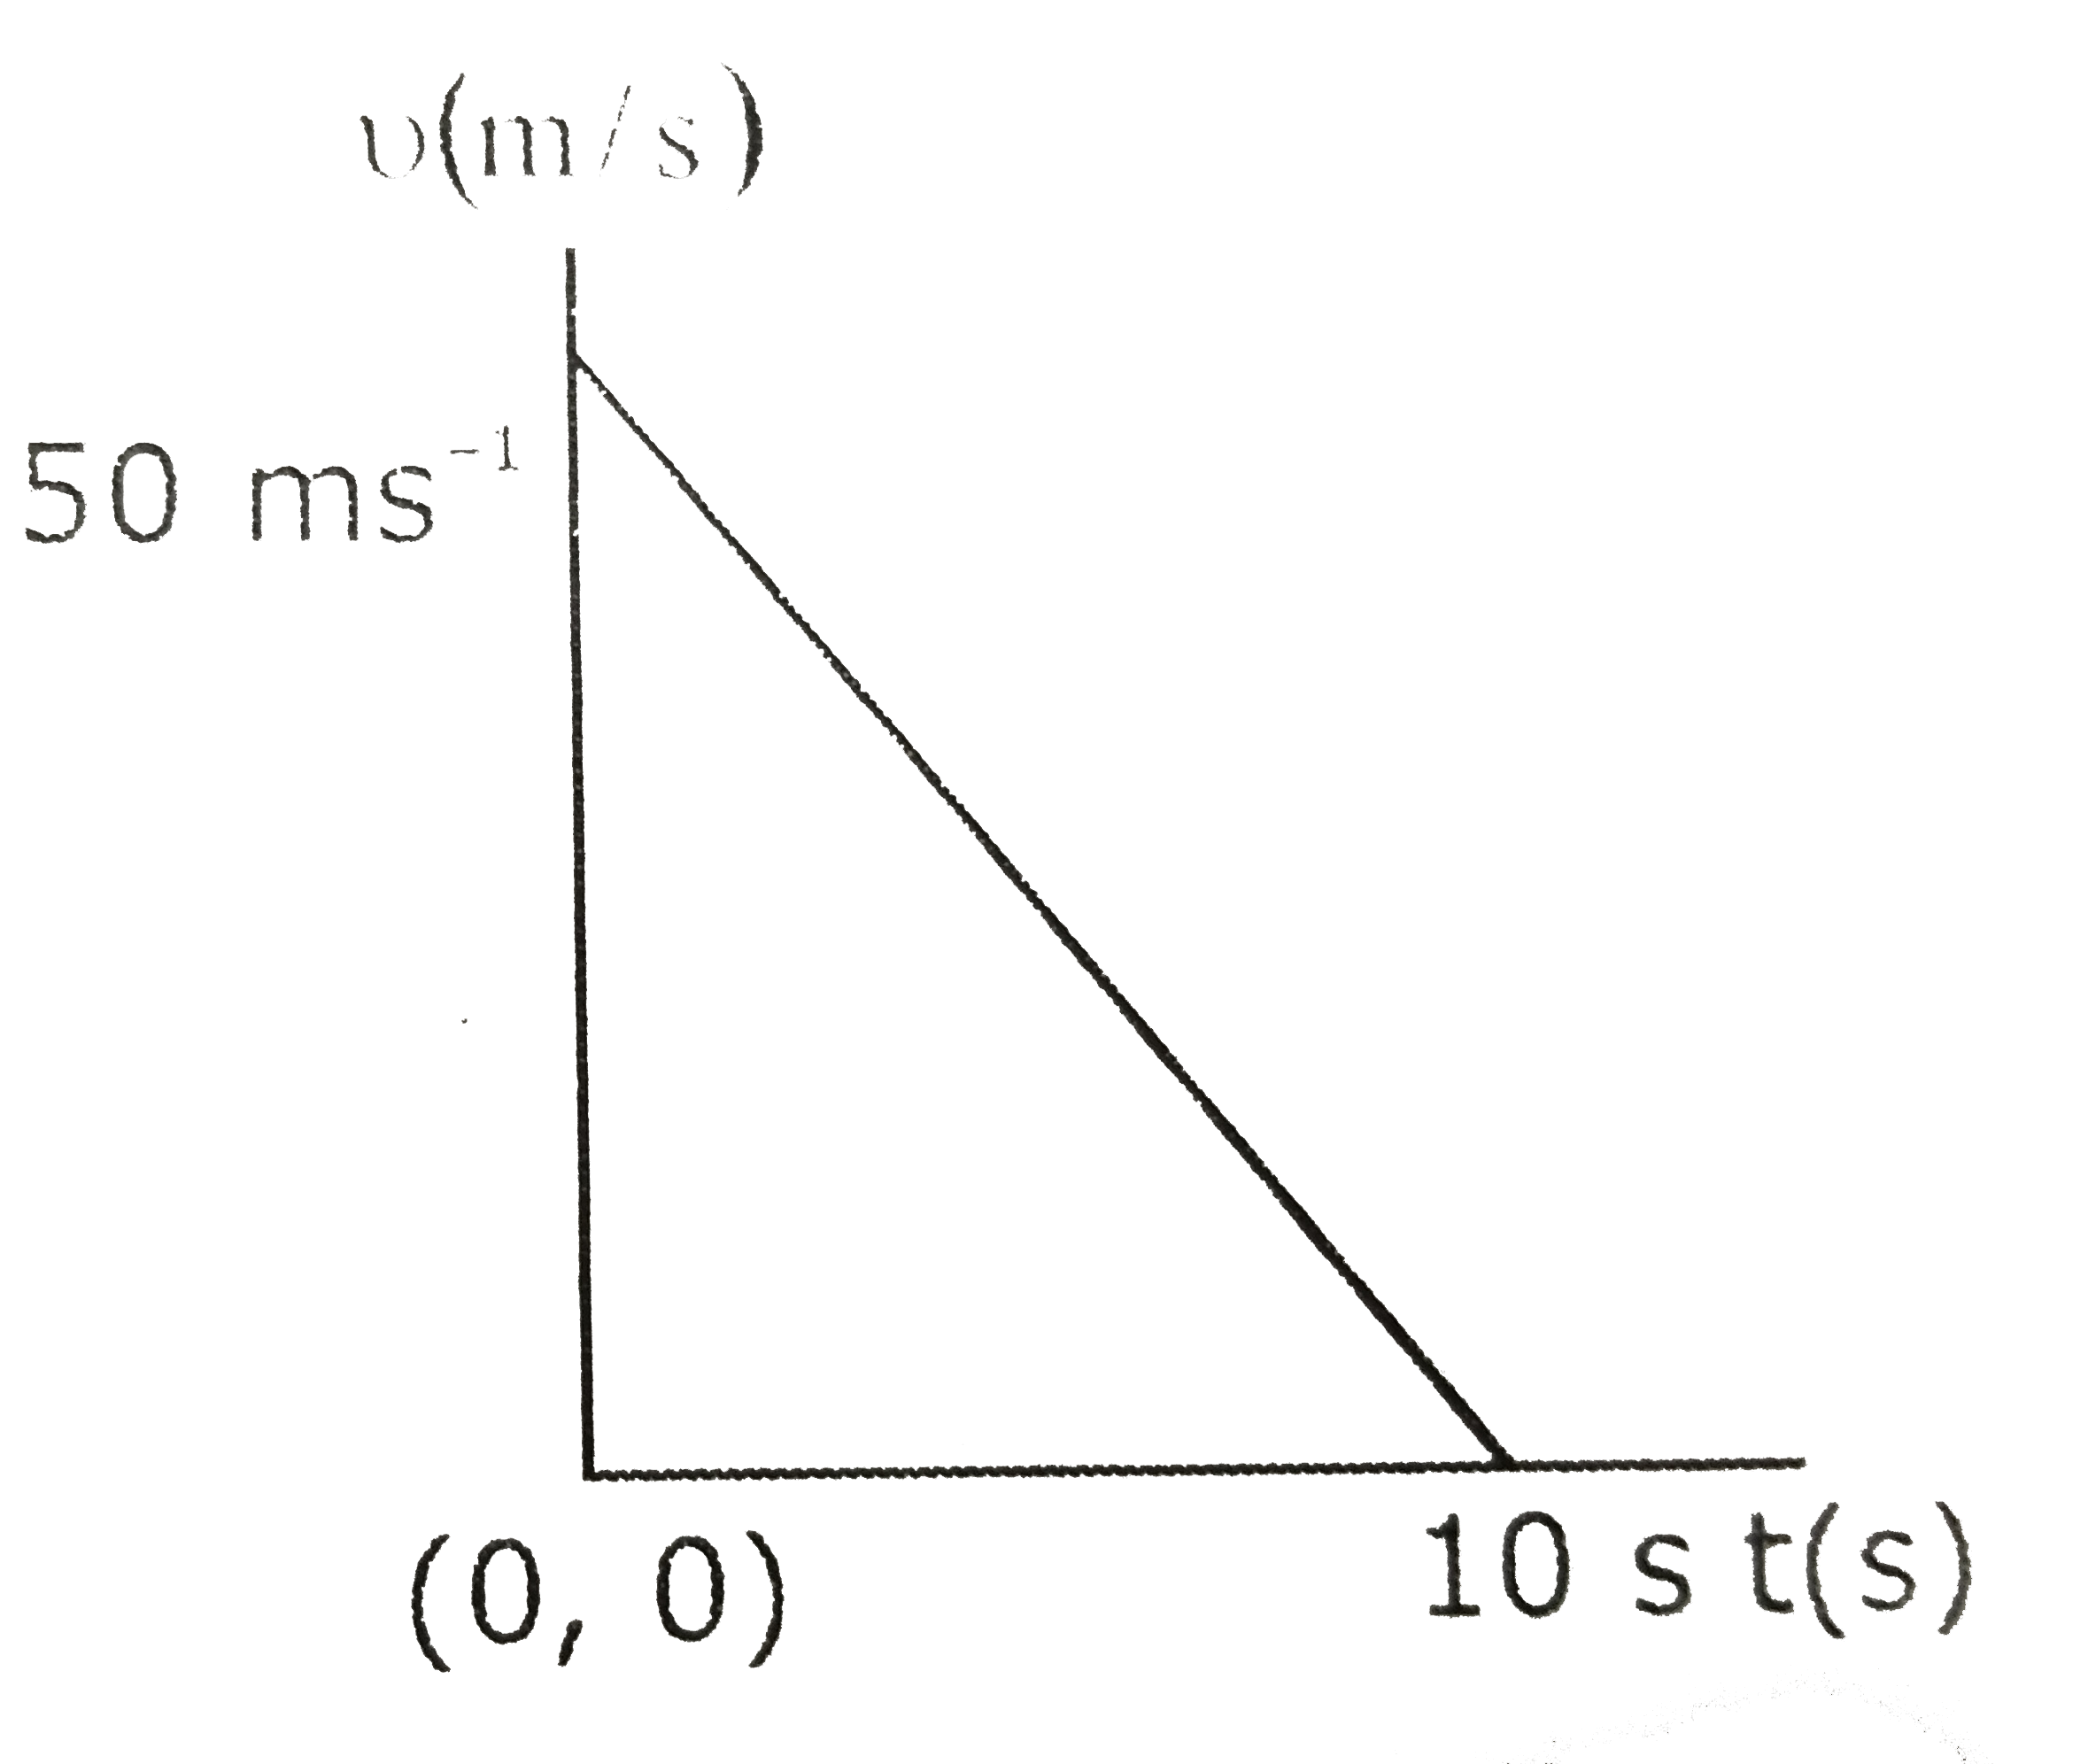
The velocity-time graph of a ball moving on the surface of a floor as shown in figure. Calculate the force acting on the force acting on the ball, if mass of the ball is 200g.
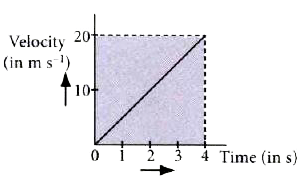 A2 NB5 NC1 ND3 N
For body of 50 kg. mass, the velocity time graph is shown in figure. Then force acting on the body is :-
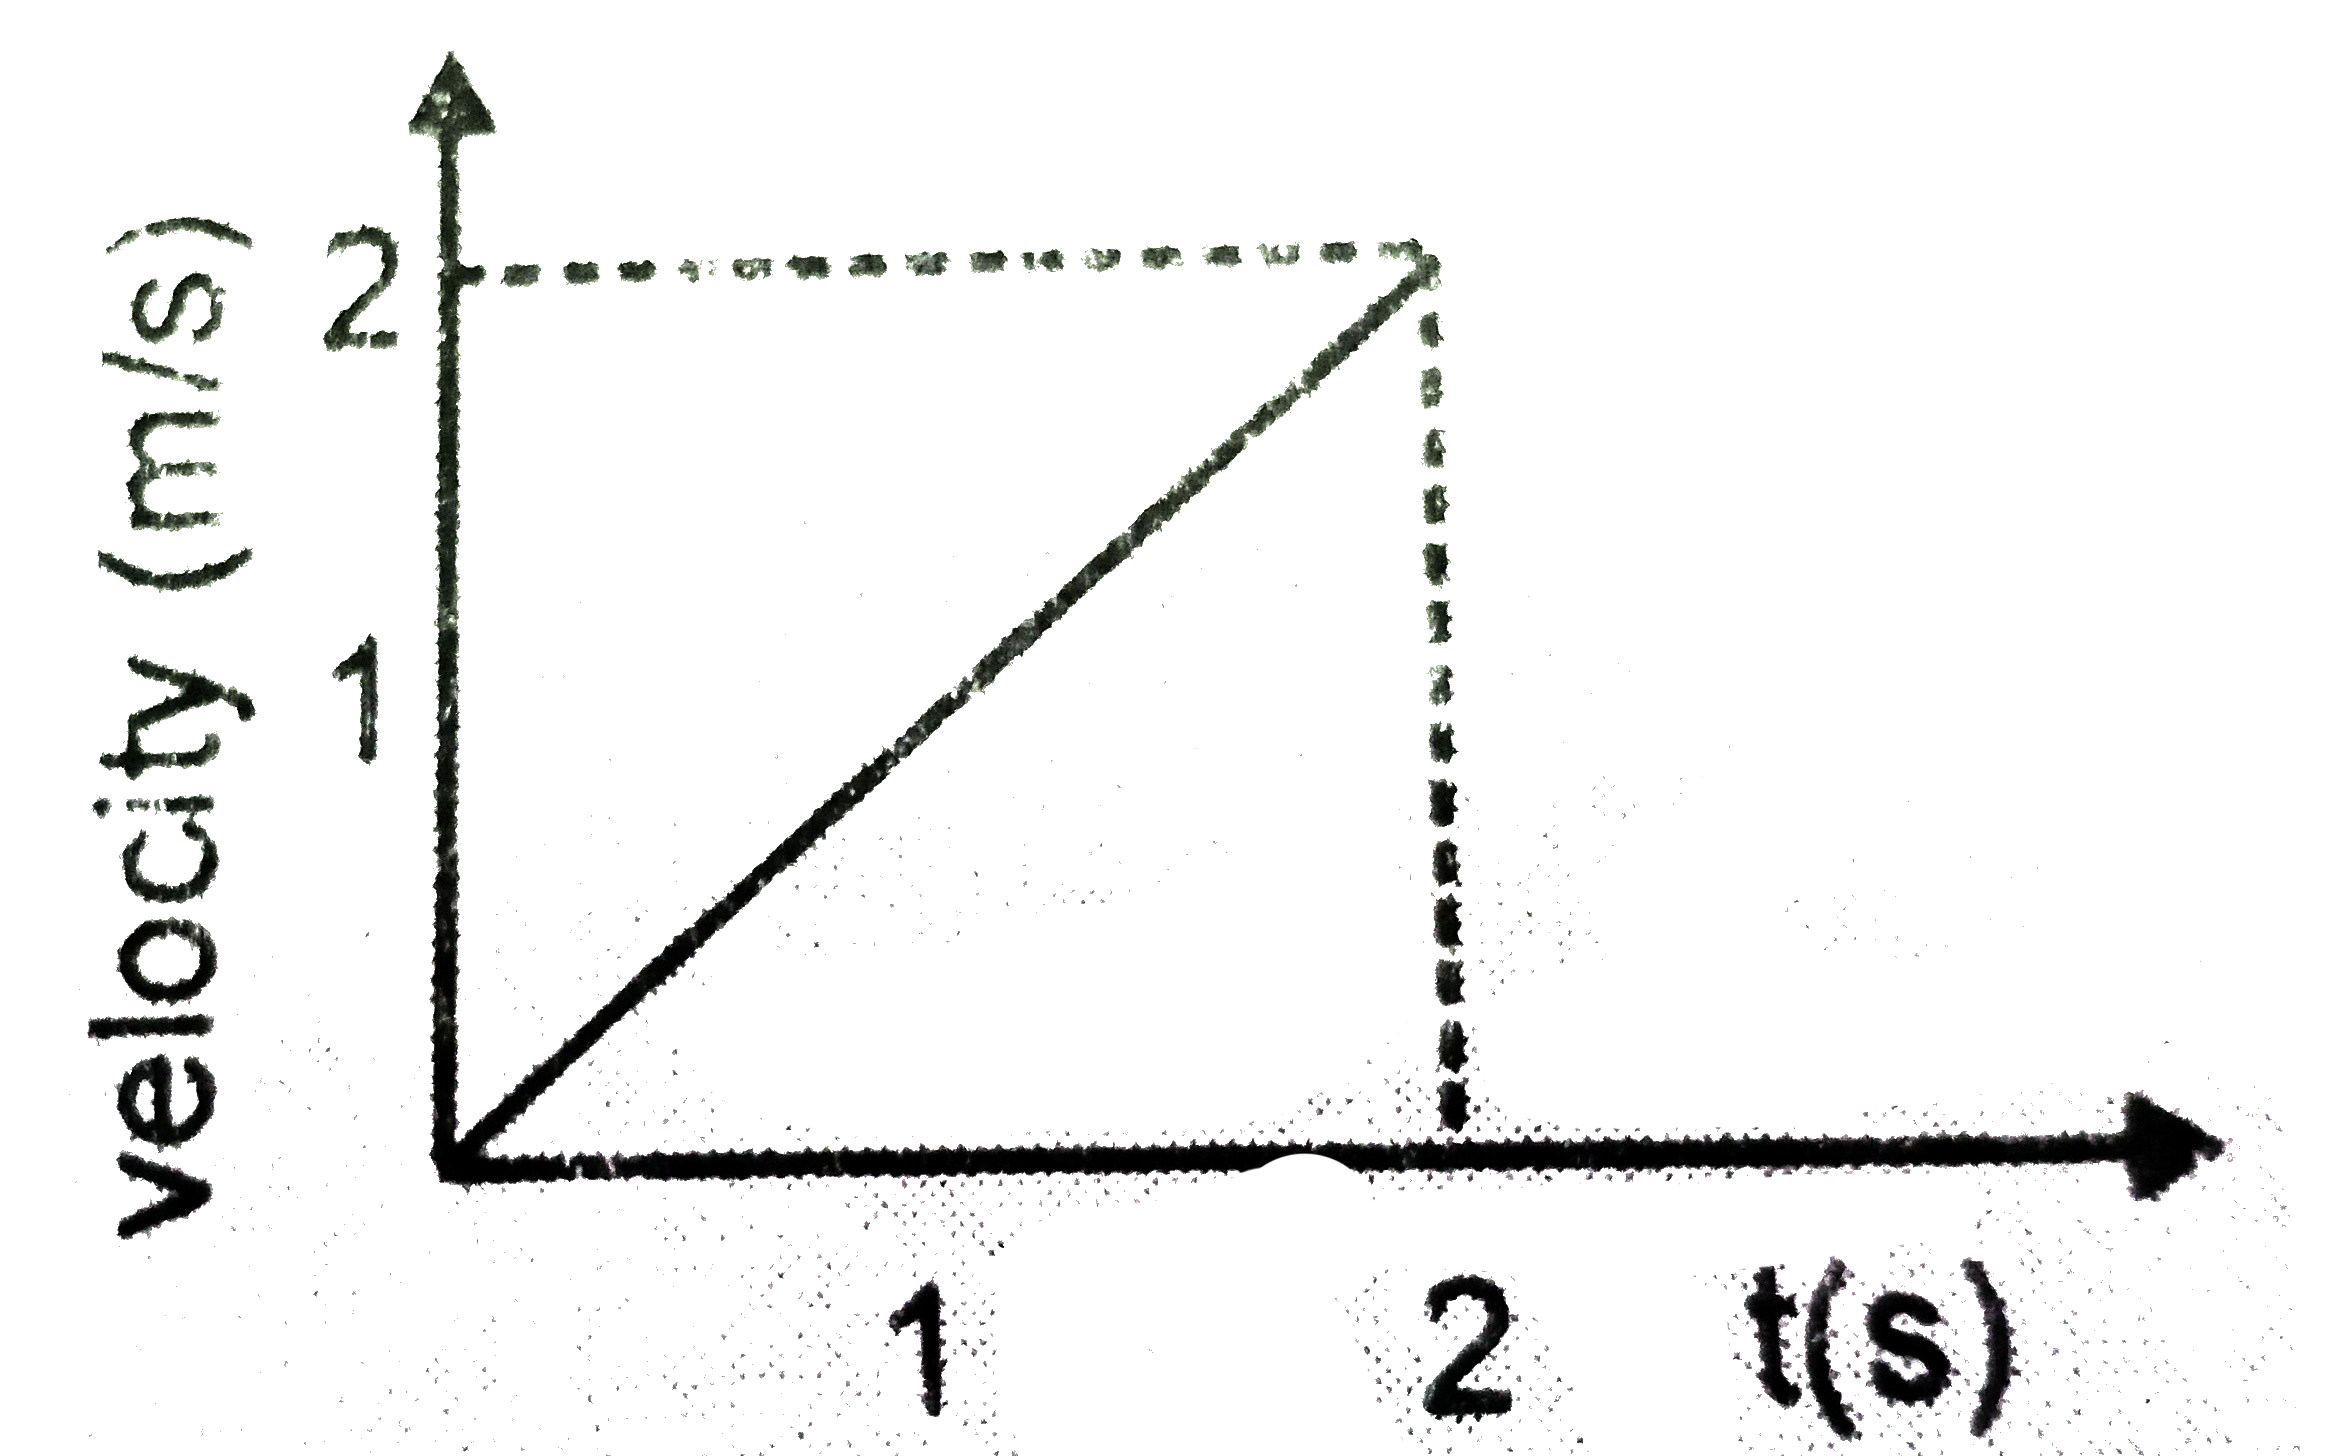 A25NB50NC12.5 ND100 N
Velocity -time graph for a body of mass 10 kg is shown in figure. Work -done on the body in first two seconds of the motion is :
View SolutionThe position-time graph of a particle of mass 0.1 kg is shown. The impulse at t = 2s is :

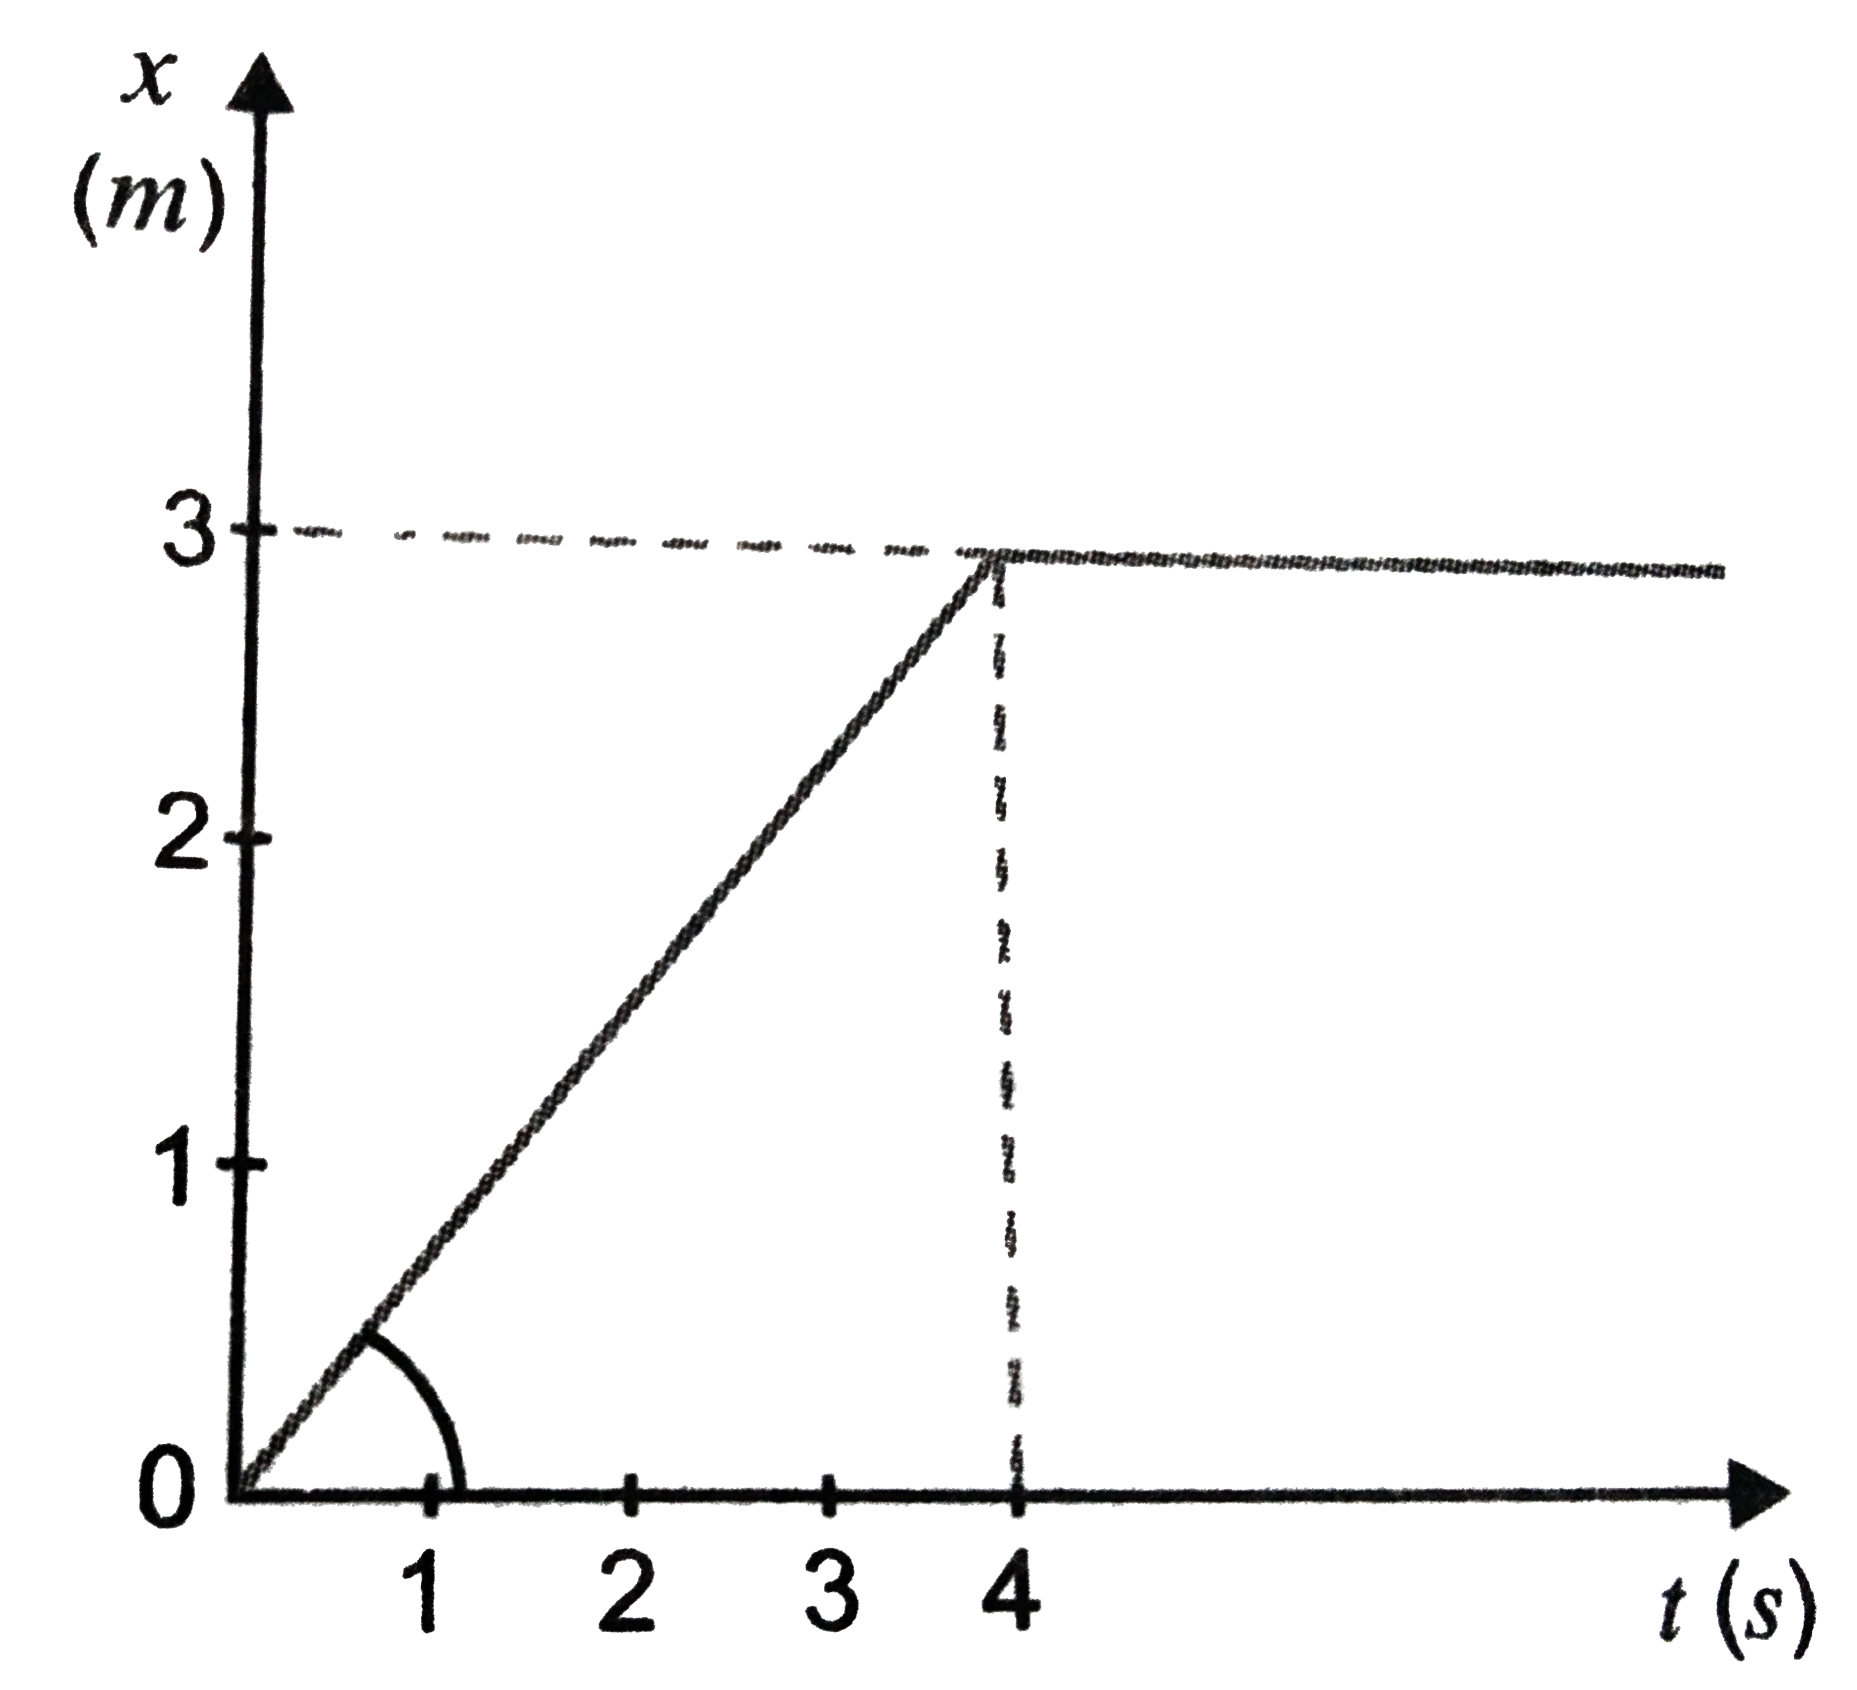
View SolutionThe position time graph of a body of mass 2kg is as given in What is the impulse on the body at t=0 s and t=4s ?
 .
.
View SolutionThe position time graph of a body of mass 2kg is as given in What is the impulse on the body at t=0 s and t=4s ?
 .
.
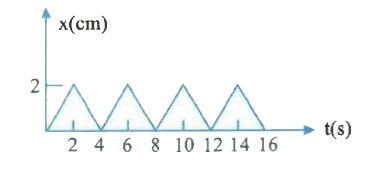
View SolutionThe position-time graph of a body of mass 0.04kg is shown in the figure. The time between two consecutive impulses received by the body and the magnitude of each impulse is
View Solution

