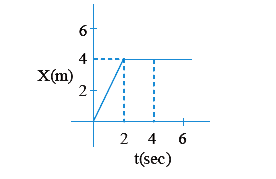
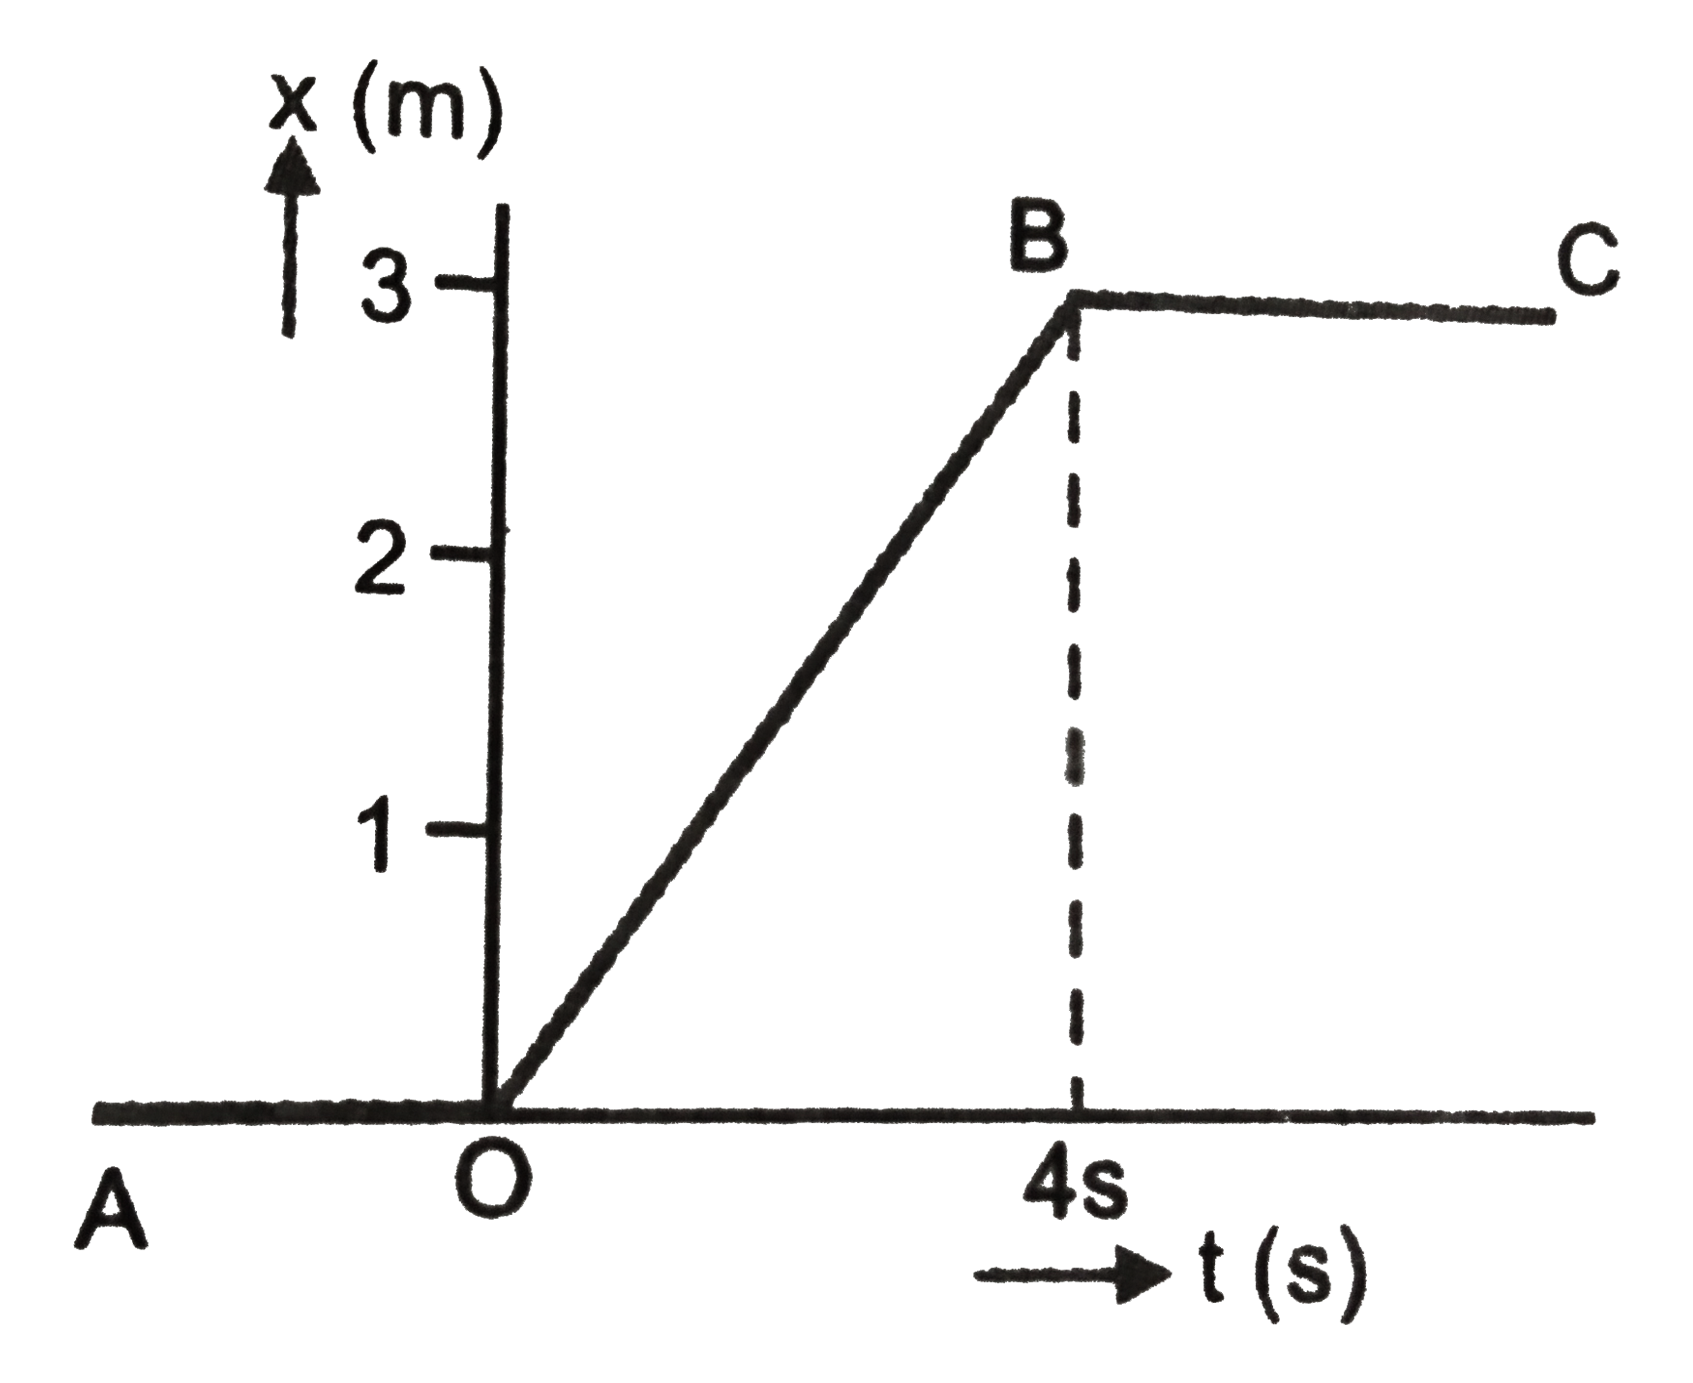
45 Shows position time graph of a particle of mass 100g Find the impulse at t=0 and at t=4s
 .
.
Step by step video solution for 45 Shows position time graph of a particle of mass 100g Find the impulse at t = 0 and at t = 4 s . by Physics experts to help you in doubts & scoring excellent marks in Class 11 exams.
Updated on:21/07/2023Topper's Solved these Questions
Similar Questions
Knowledge Check
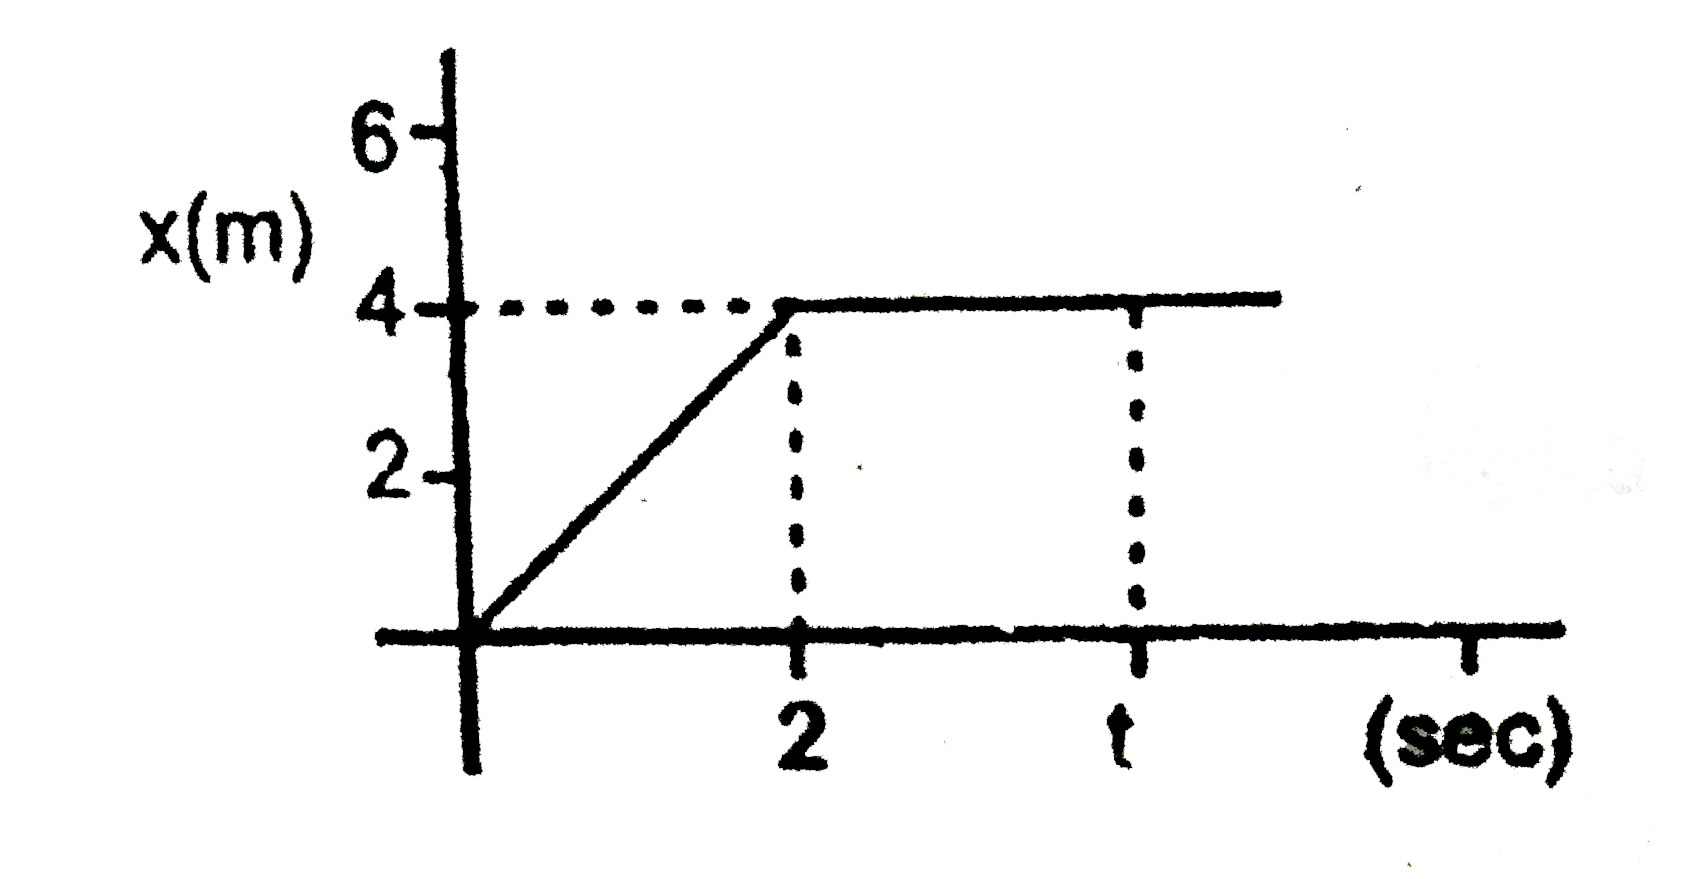
In the figure given below, the position time graph of a particle of mass 0.1kg is shown. The impulse at t=2 sec is
 A0.2gkm/secB−0.2kgmsec−1C0.1kgmsec−1D−0.1kgm/sec
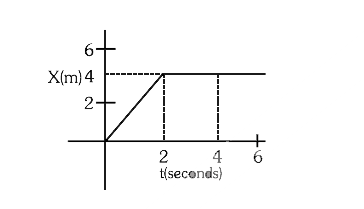
In the figure given below, the position–time graph of a particle of mass 0·1 kg is shown. The impulse at t=2sec is
 A0⋅2 kgmsec −1B−0⋅2 kgmsec −1C0⋅1 kgmsec −1D−0⋅4 kgmsec −1
In the figure given below, the position-time graph of a particle of mass 0.1kg is shown. The impuslse at t=2 sec is
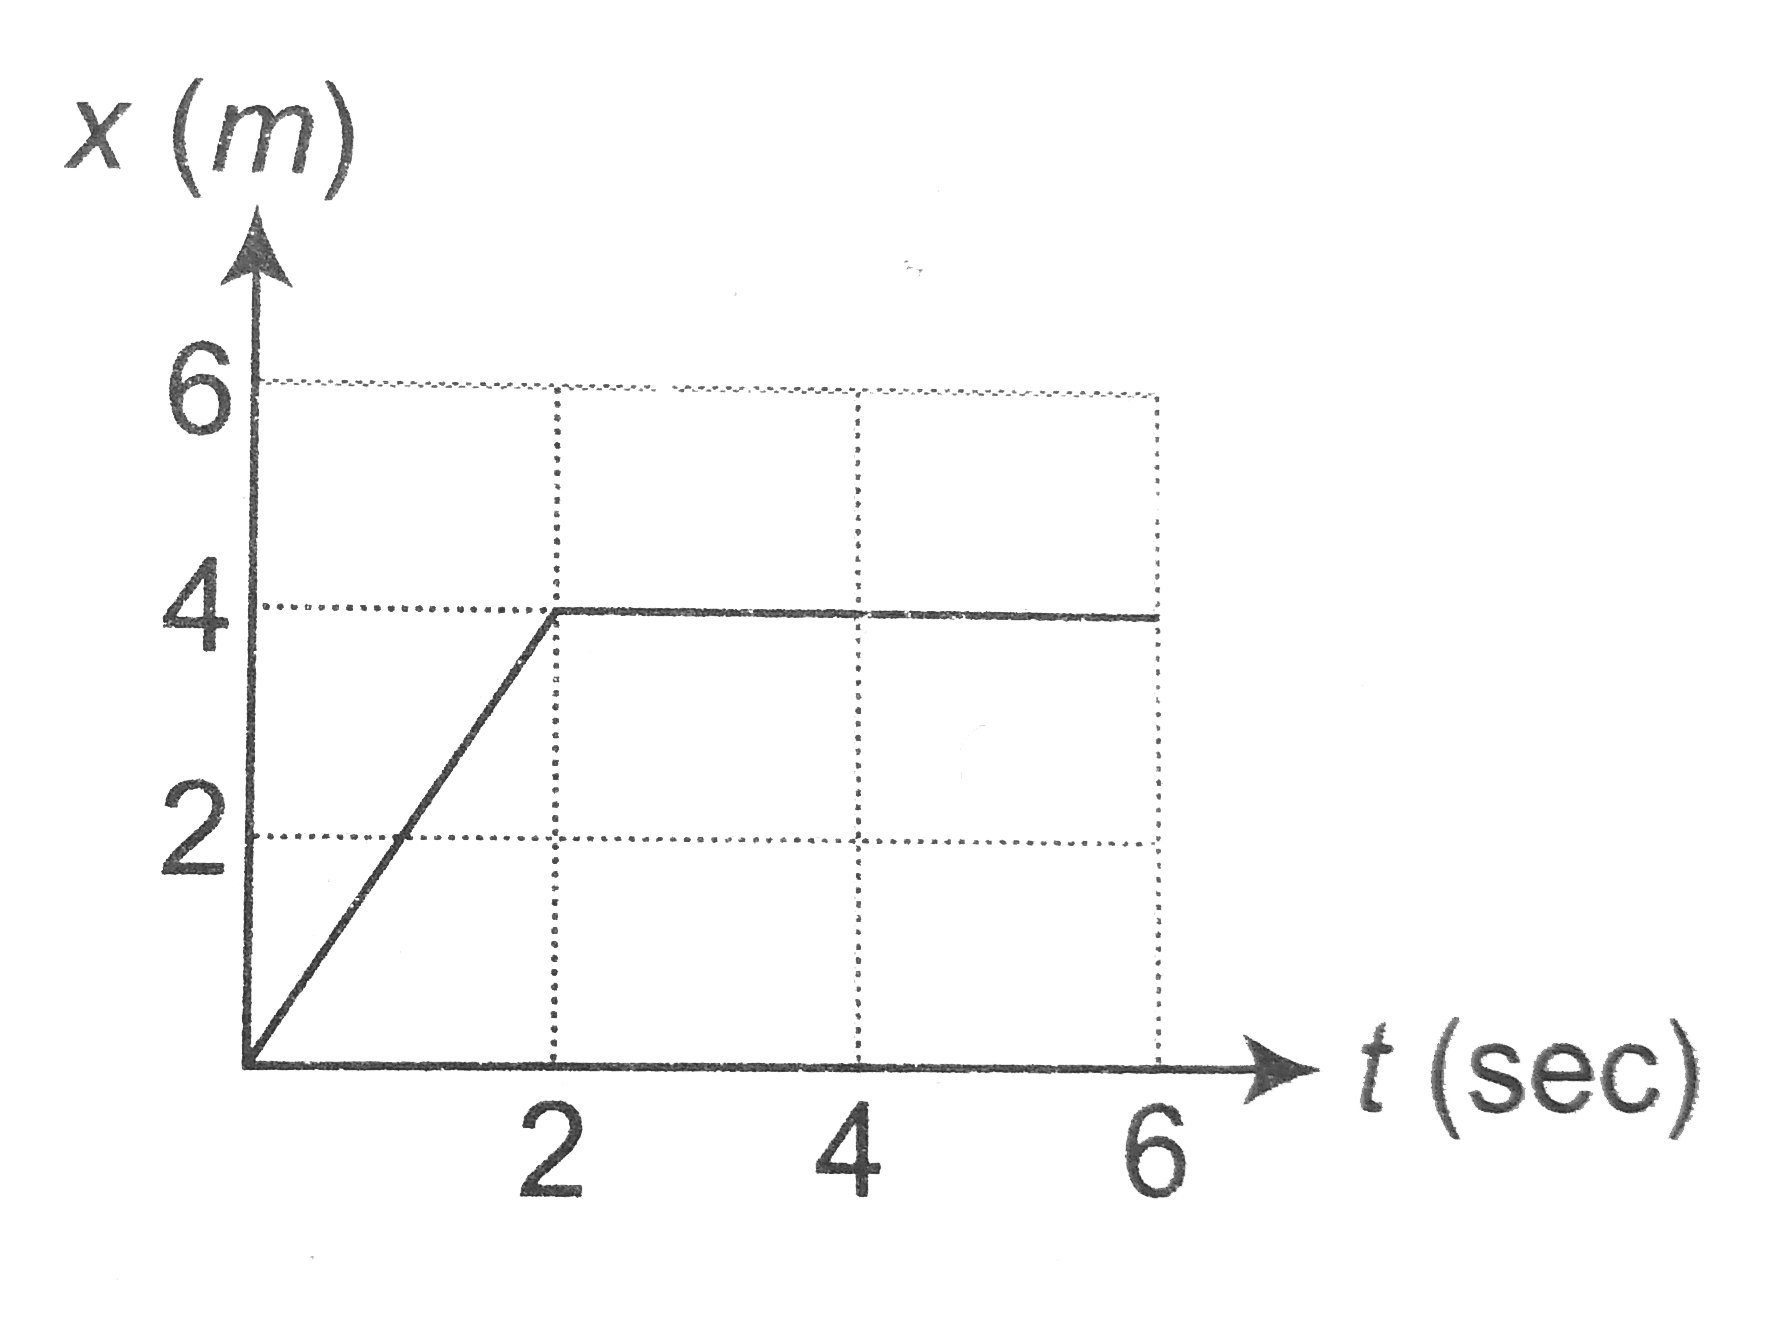 A0.2kgm/secB−0.2kgm/secC−0.1kgm/secD−0.4kgm/sec
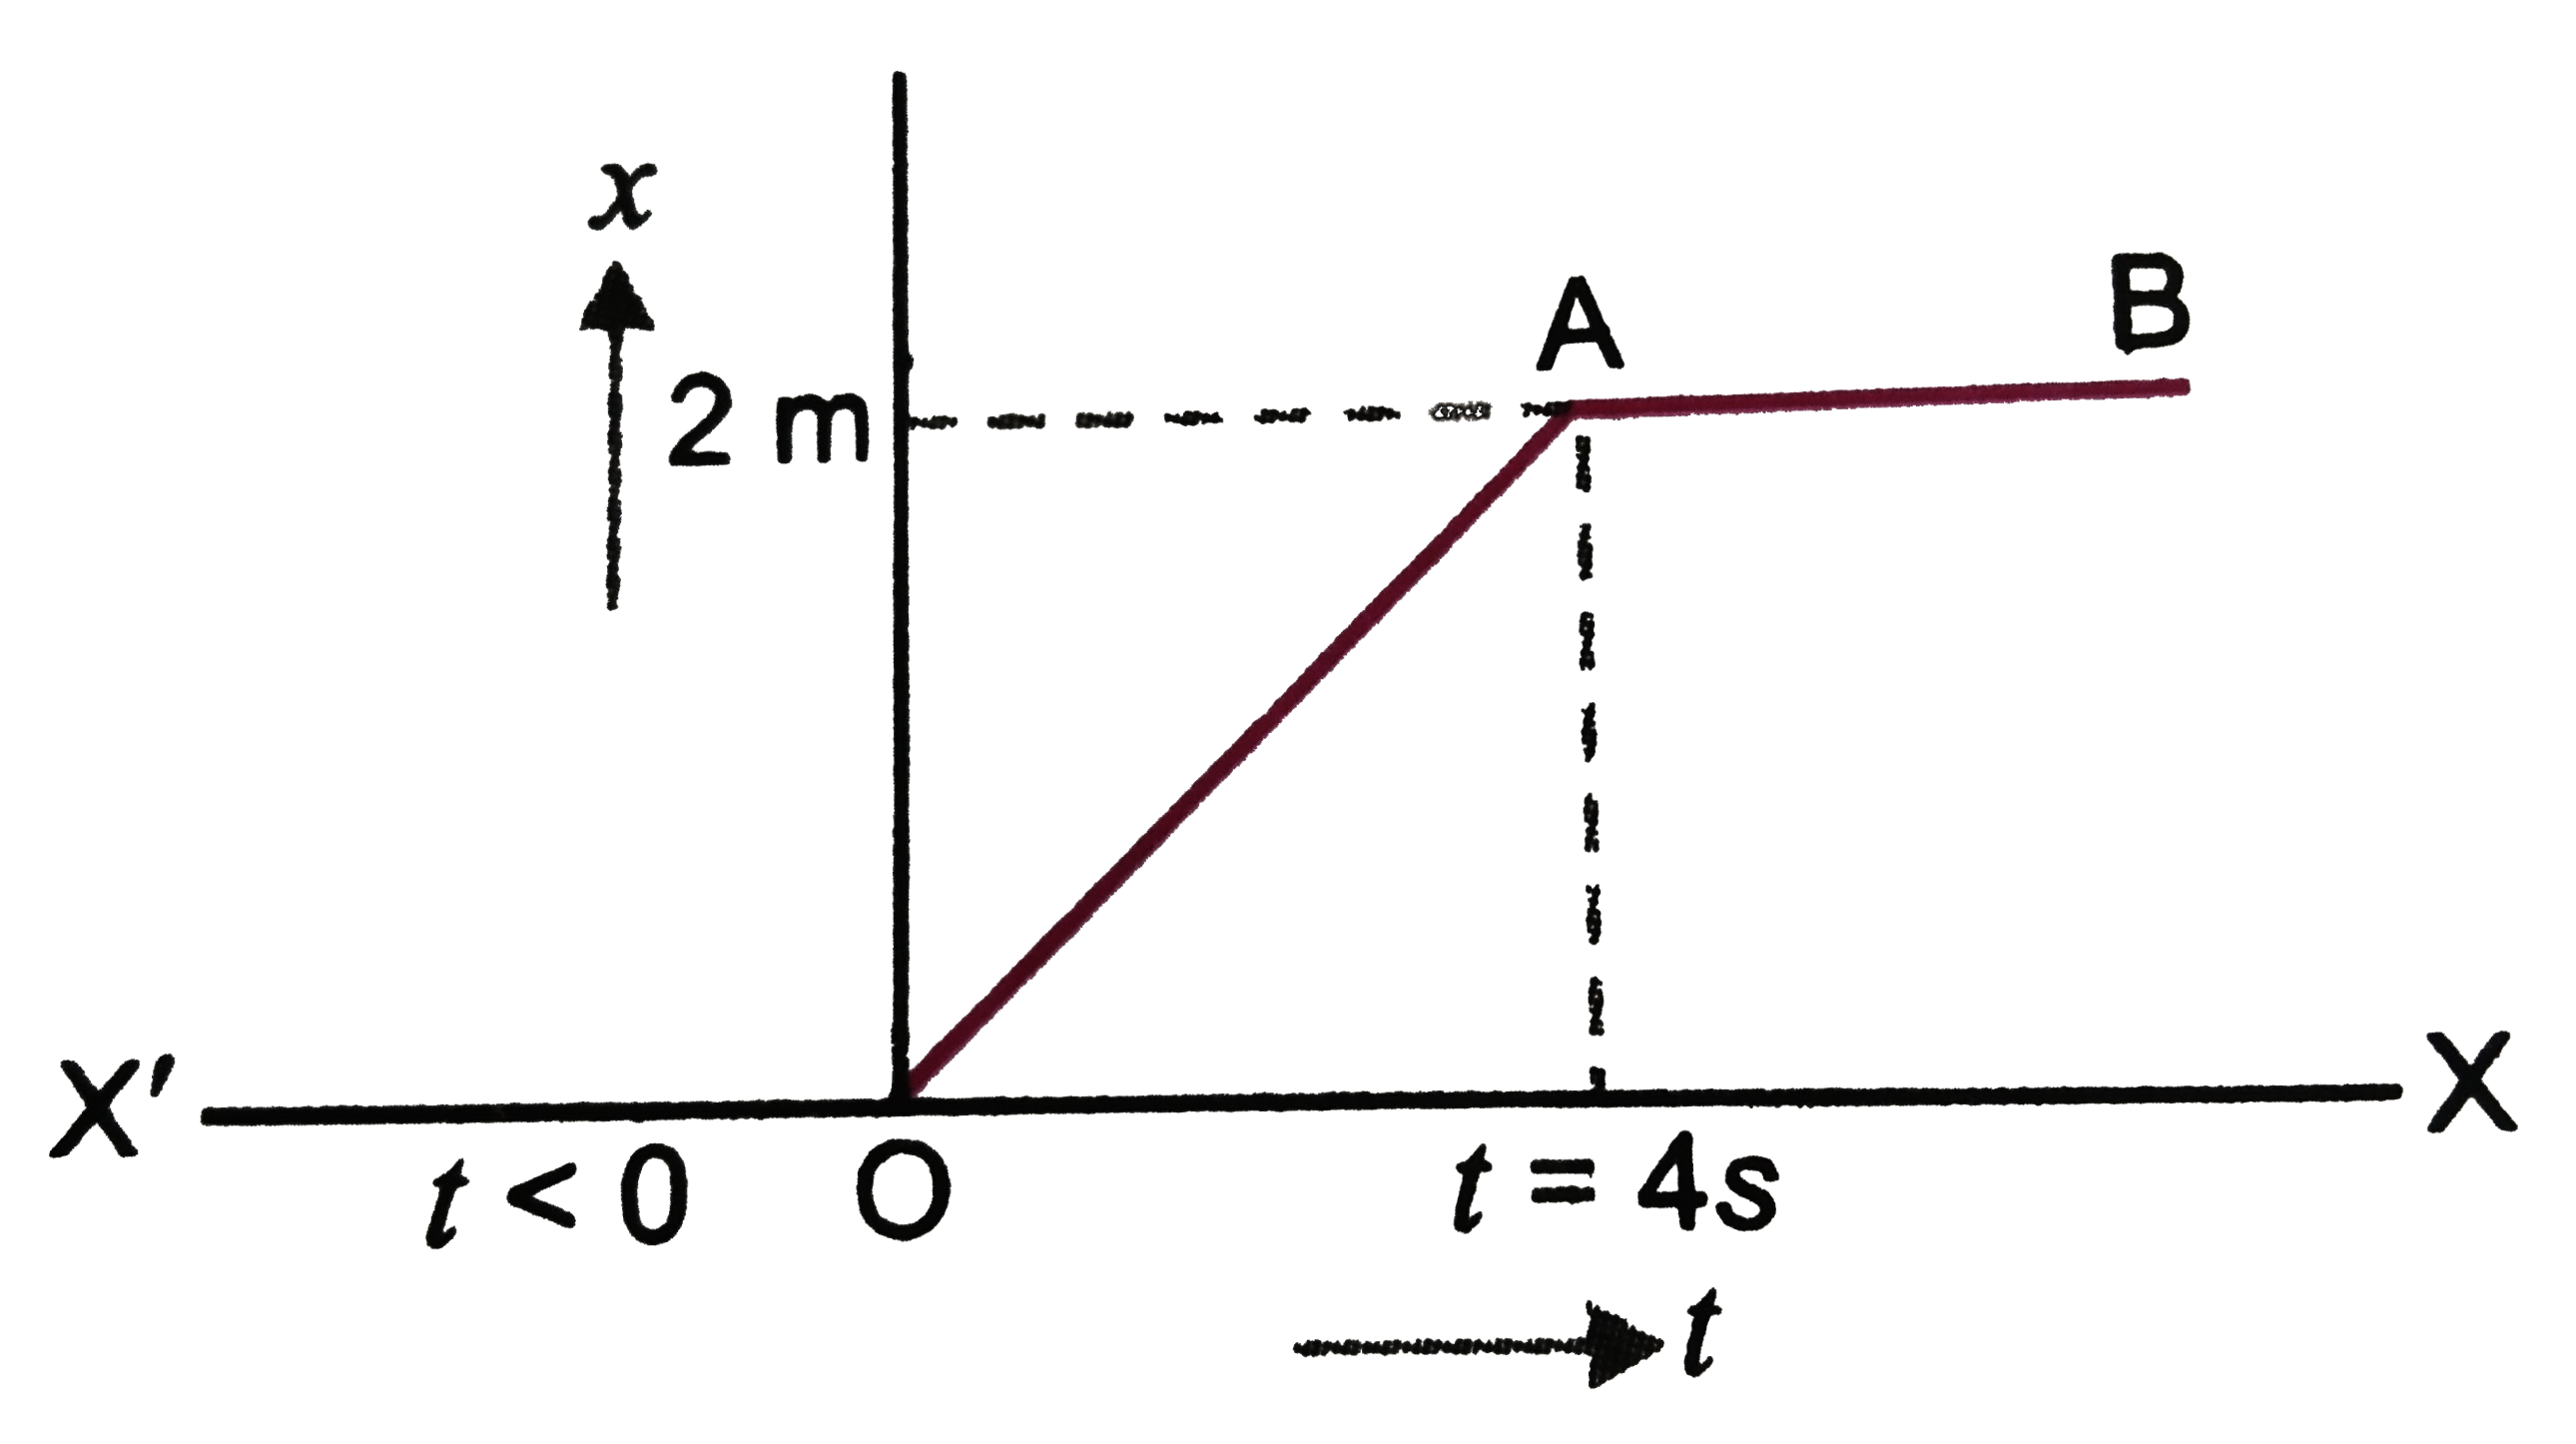
Shown the position time graph of a particle of mass 4 kg What is the force on the particle for t<0,0<t<4s motion only
 .
.
View SolutionFig. shows the position-time graph of a particle of mass 4 kg. What is the (i) force acting on the particle for t<0,t<4s,0<t<4s? (ii) impulse at t = 0 and t = 4 s? Assume that the motion is one dimensional.
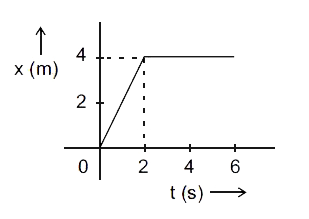
View SolutionThe position-time graph of a particle of mass 0.1 kg is shown. The impulse at t = 2s is :
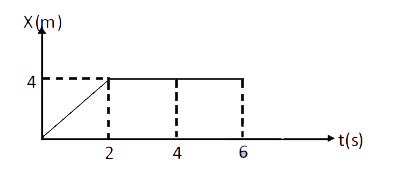
View SolutionIn the figure given, the position-time graph of a particle of mass 0.1 kg is shown the impulse at t = 2s is
View SolutionFigure shows the position time graph of a particle of mass 5kg. The force acting on the particle for 0<t<4s and 8s<t<12s respectively are,

View Solution

