Fig. 2 (NCT). 6 shows x−t plot of one dismensional motion a particle. Is it correct to say from the graph that the particle moves in a straight line for t<0and on a parabolic path form t>0? If not, suggest a suitable physical contxt for this graph.
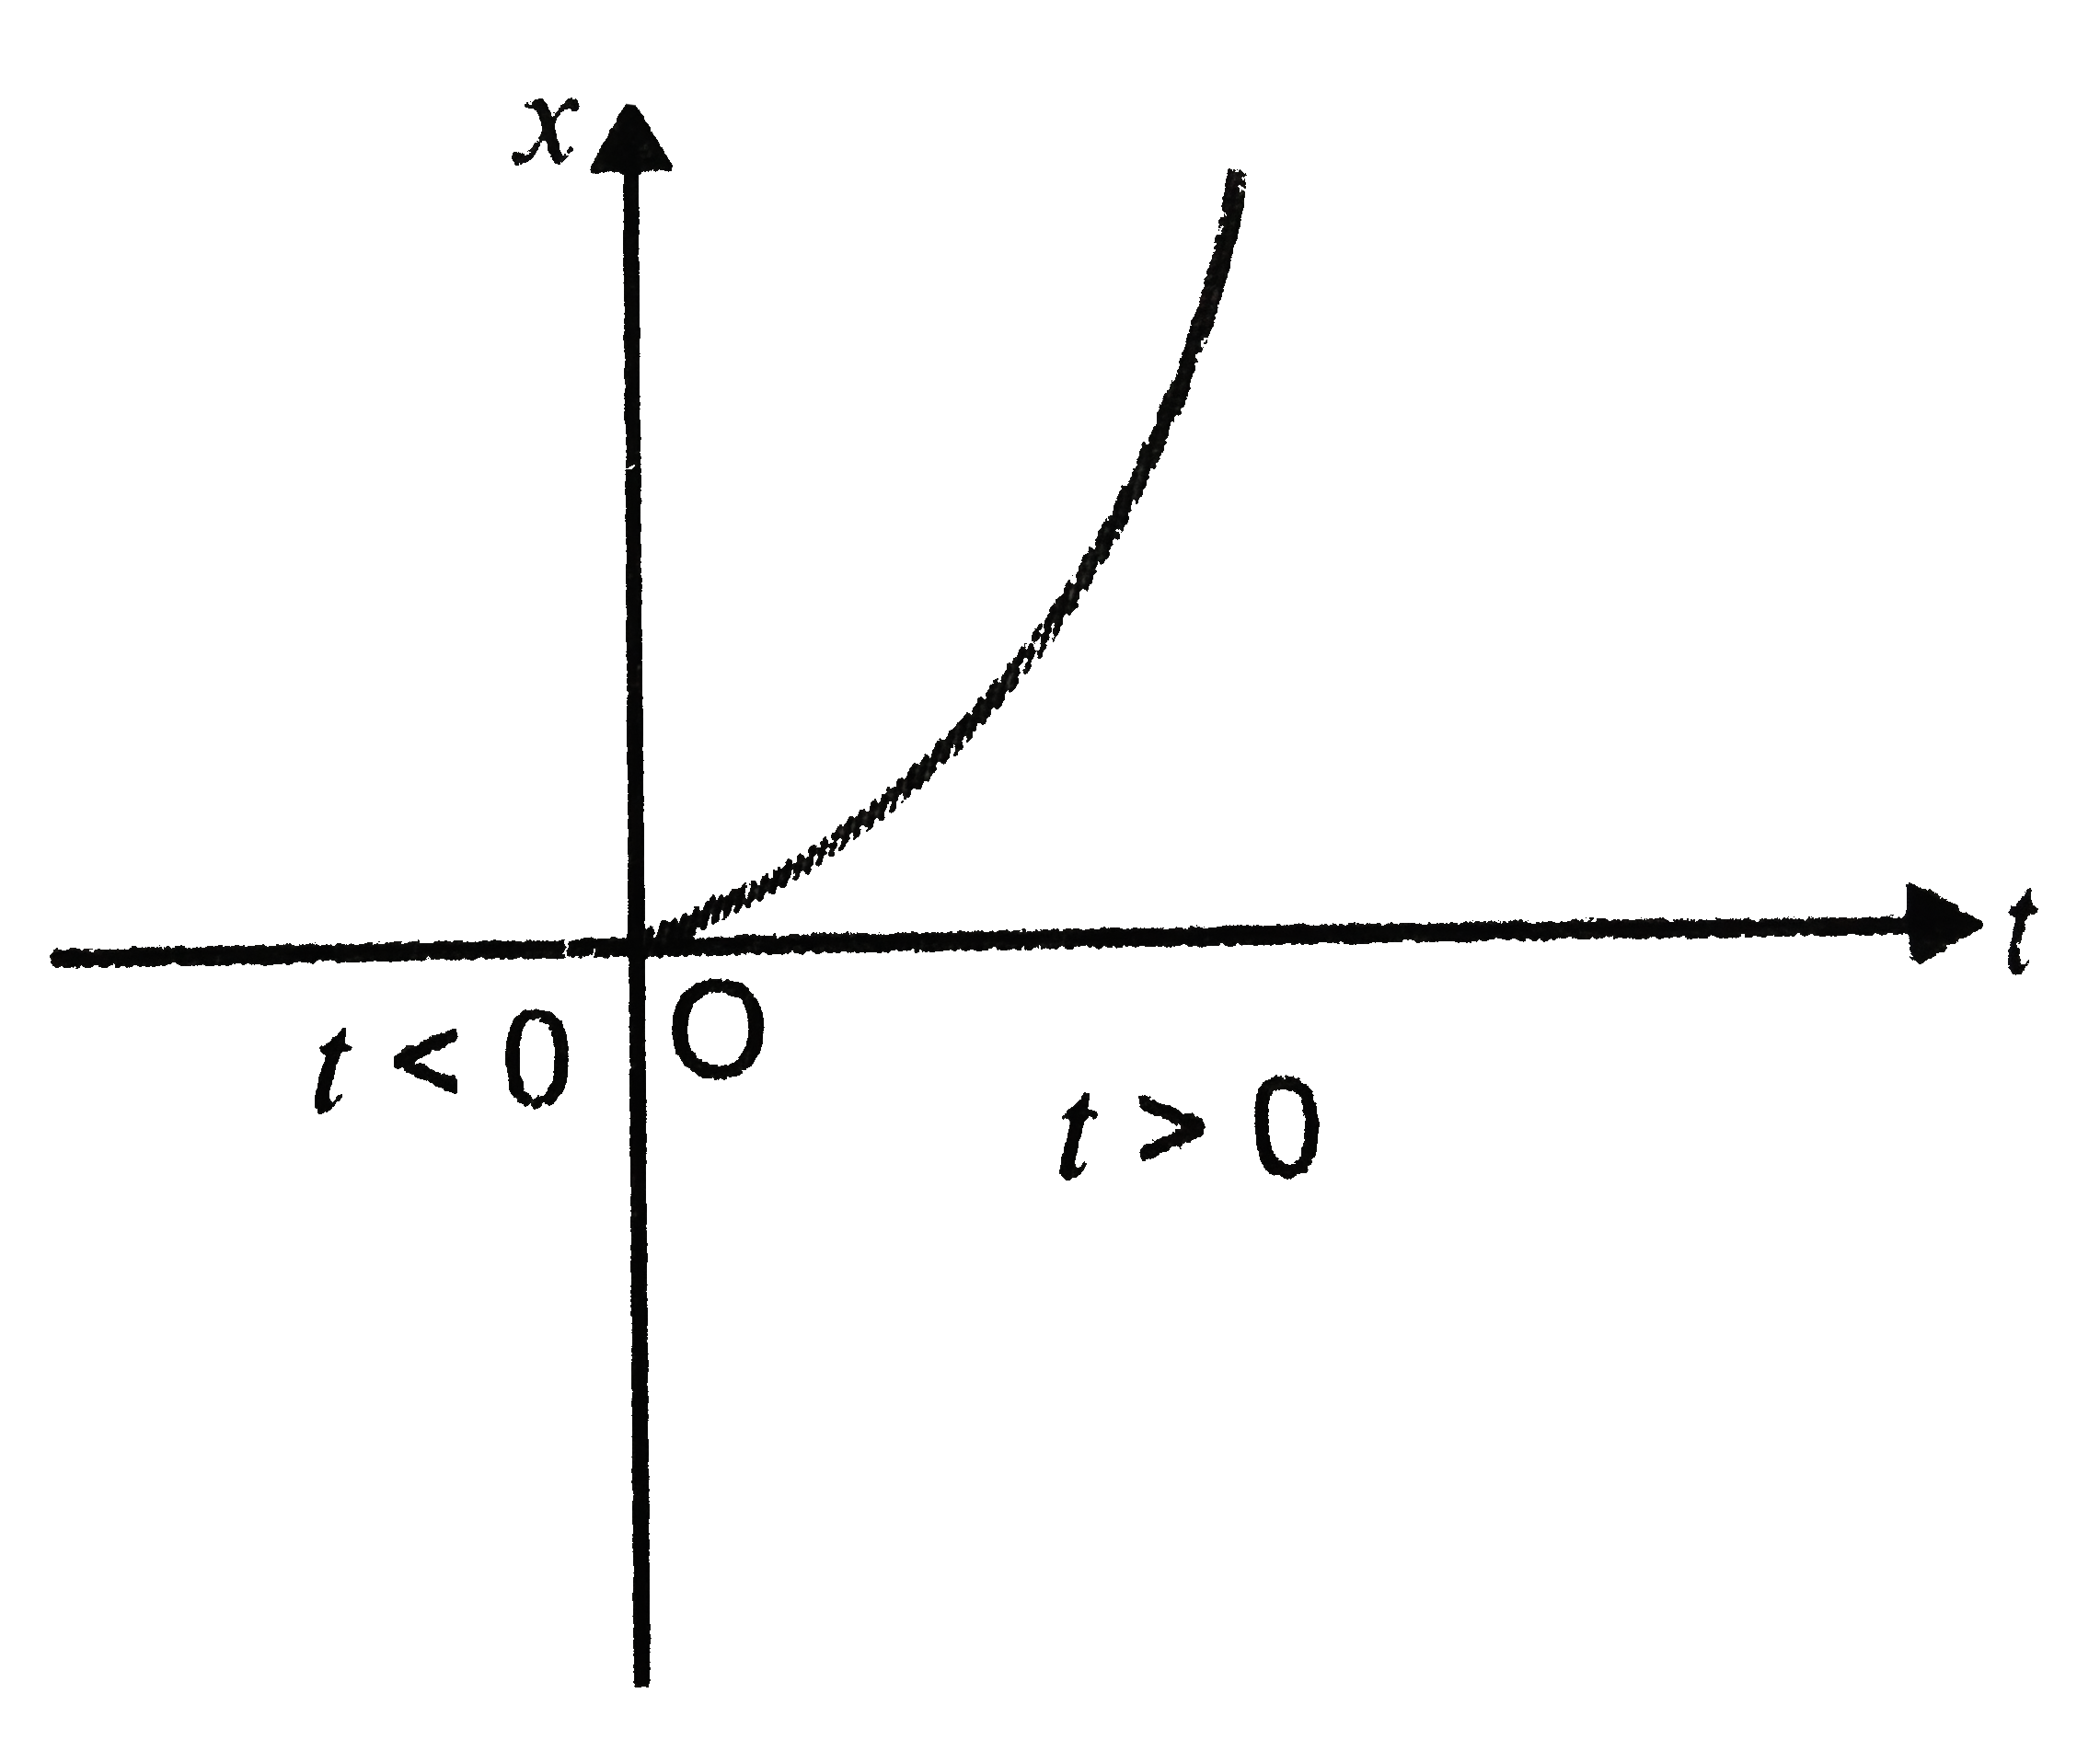
Step by step video solution for Fig. 2 (NCT). 6 shows x-t plot of one dismensional motion a particle. Is it correct to say from the graph that the particle moves in a straight line for t lt 0 and on a parabolic path form t gt 0 ? If not, suggest a suitable physical contxt for this graph. by Physics experts to help you in doubts & scoring excellent marks in Class 11 exams.
Updated on:21/07/2023Topper's Solved these Questions
Similar Questions
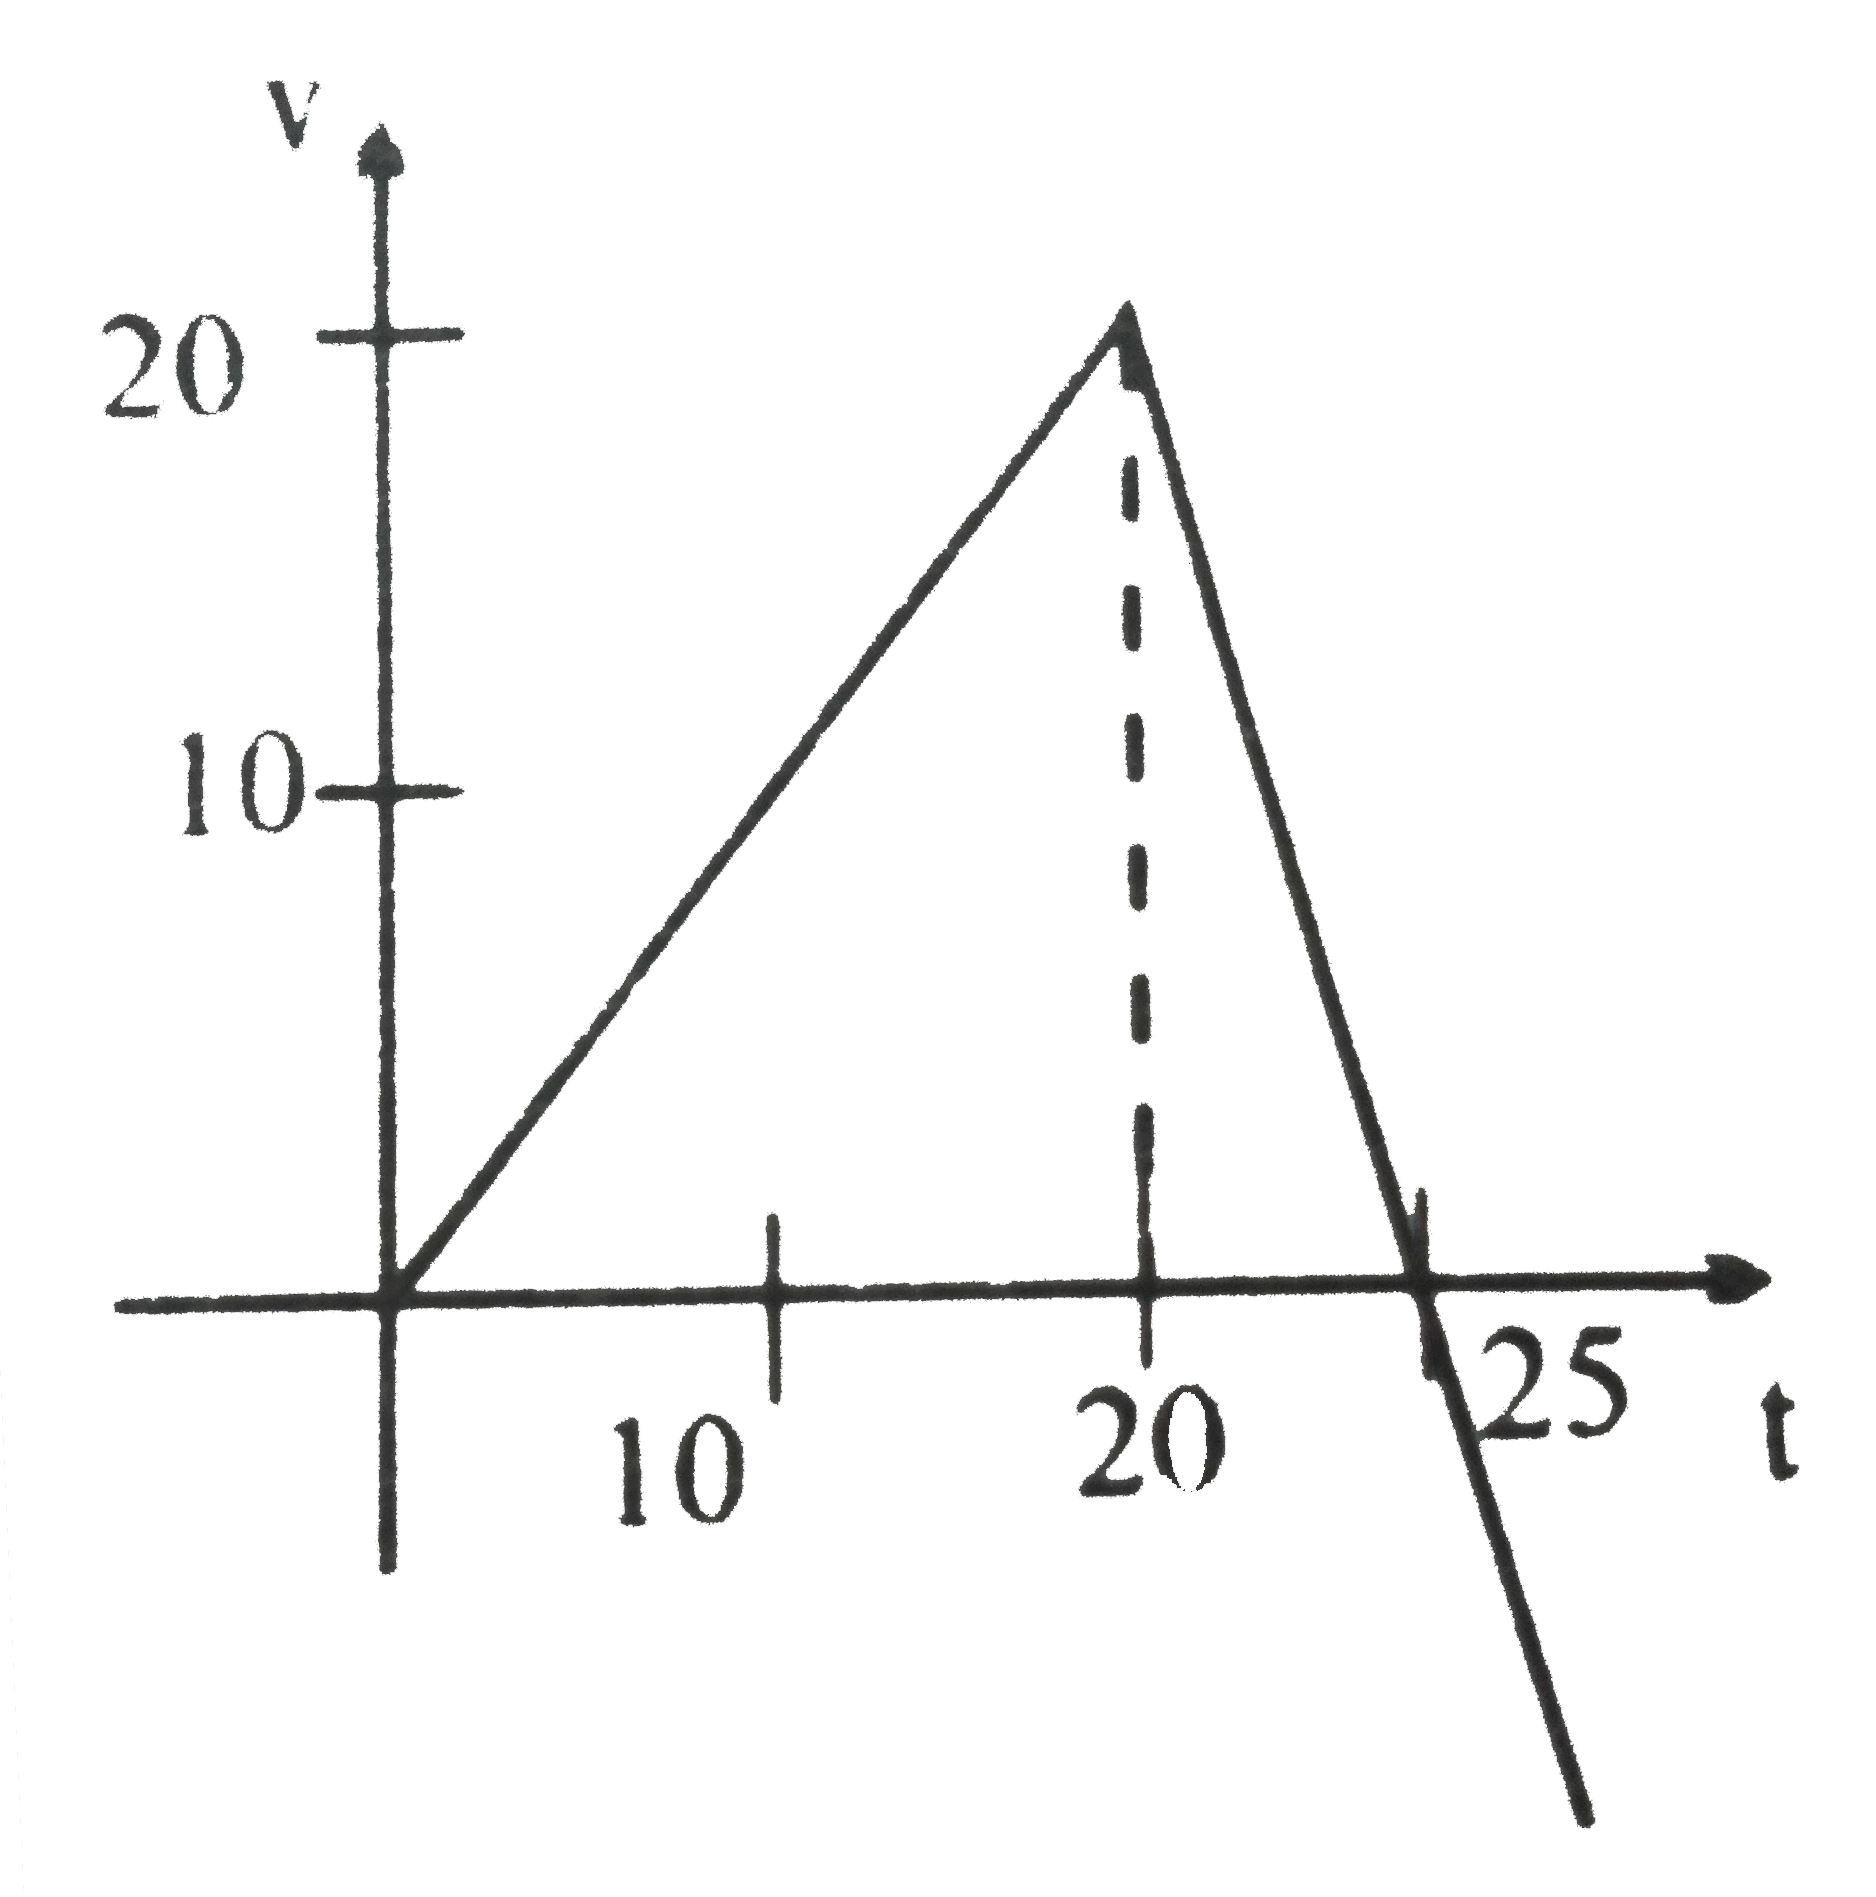
The fig. shows the v−t graph of a particle moving in straight line. Find the time when particle returns to the starting point.
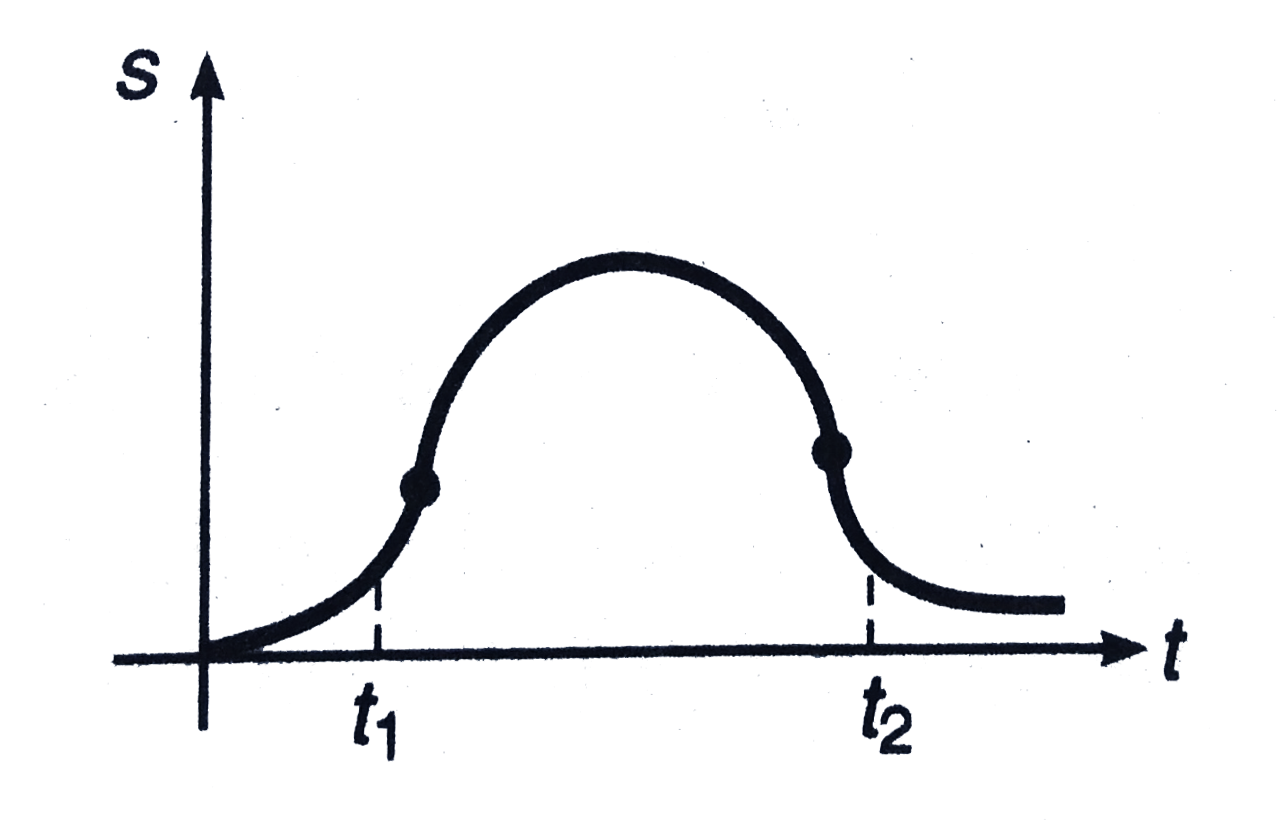
View SolutionFigure shows the displacement-time graph of a particle moving in a straight line. Find the signs of velocity and acceleration of particle at time t=t1andt=t2.
View Solution
Knowledge Check
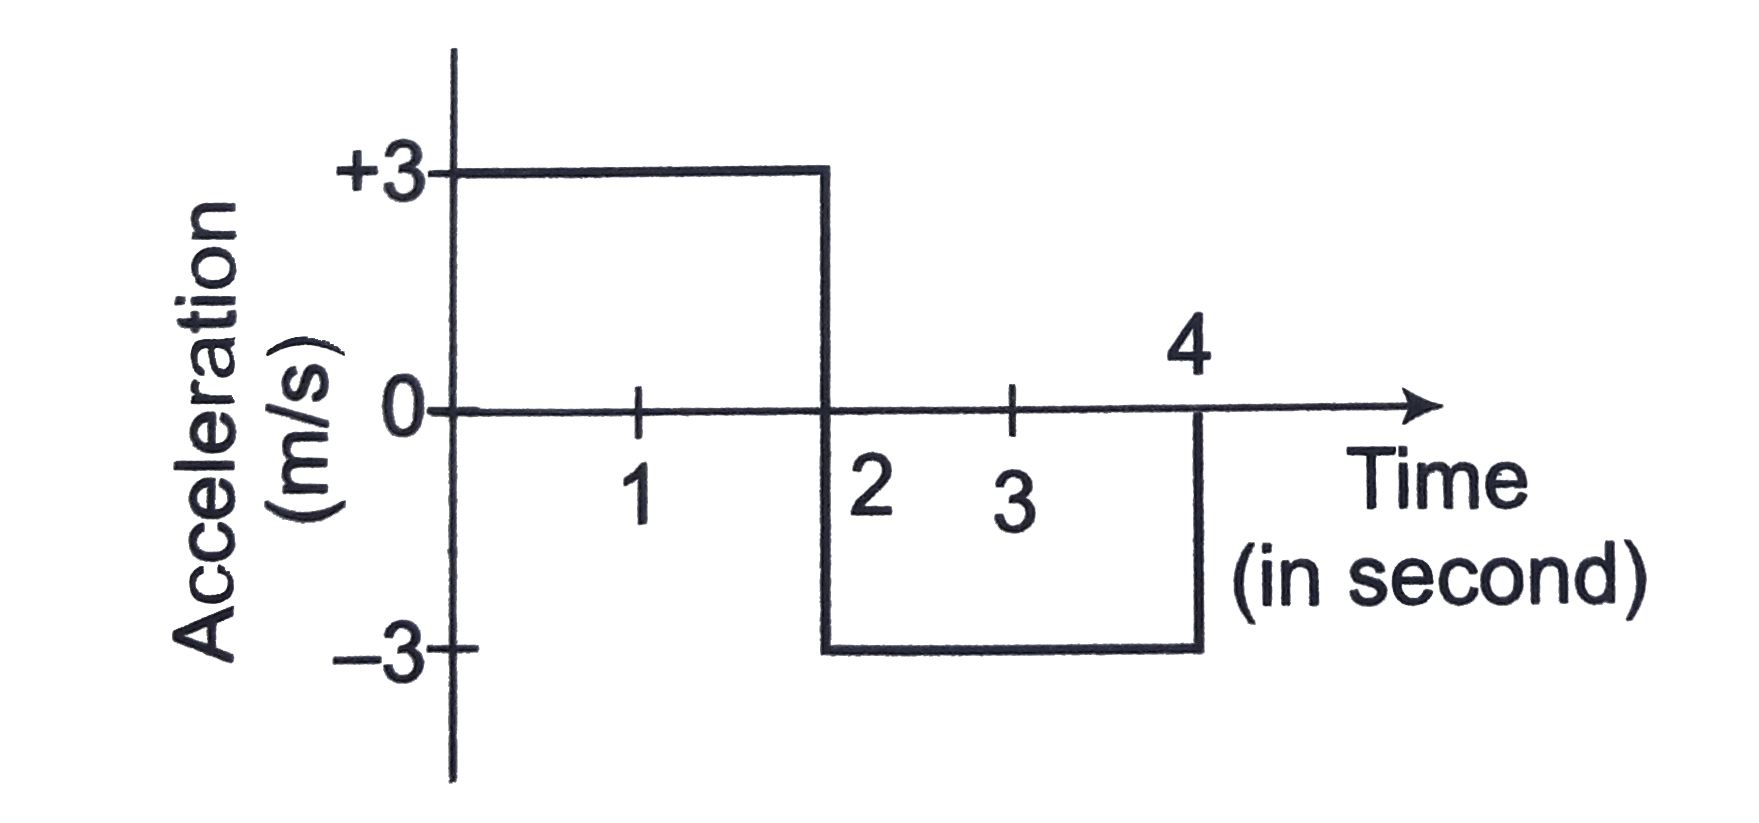
A particle starts from rest at t=0 and moves in a straight line with an acceleration as shown below. The velocity of the particle at t=3 s is
 A2m/sB3m/sC4m/sD6m/s
A particle starts from rest at t=0 and moves in a straight line with an acceleration as shown below. The velocity of the particle at t=3 s is
 A5m/s2B6m/s2C10m/s2D15m/s2
The velocity -time (v−t) graph of a particle moving in a straight line is shown in figure. The acceleration of the particle at t=9 is:
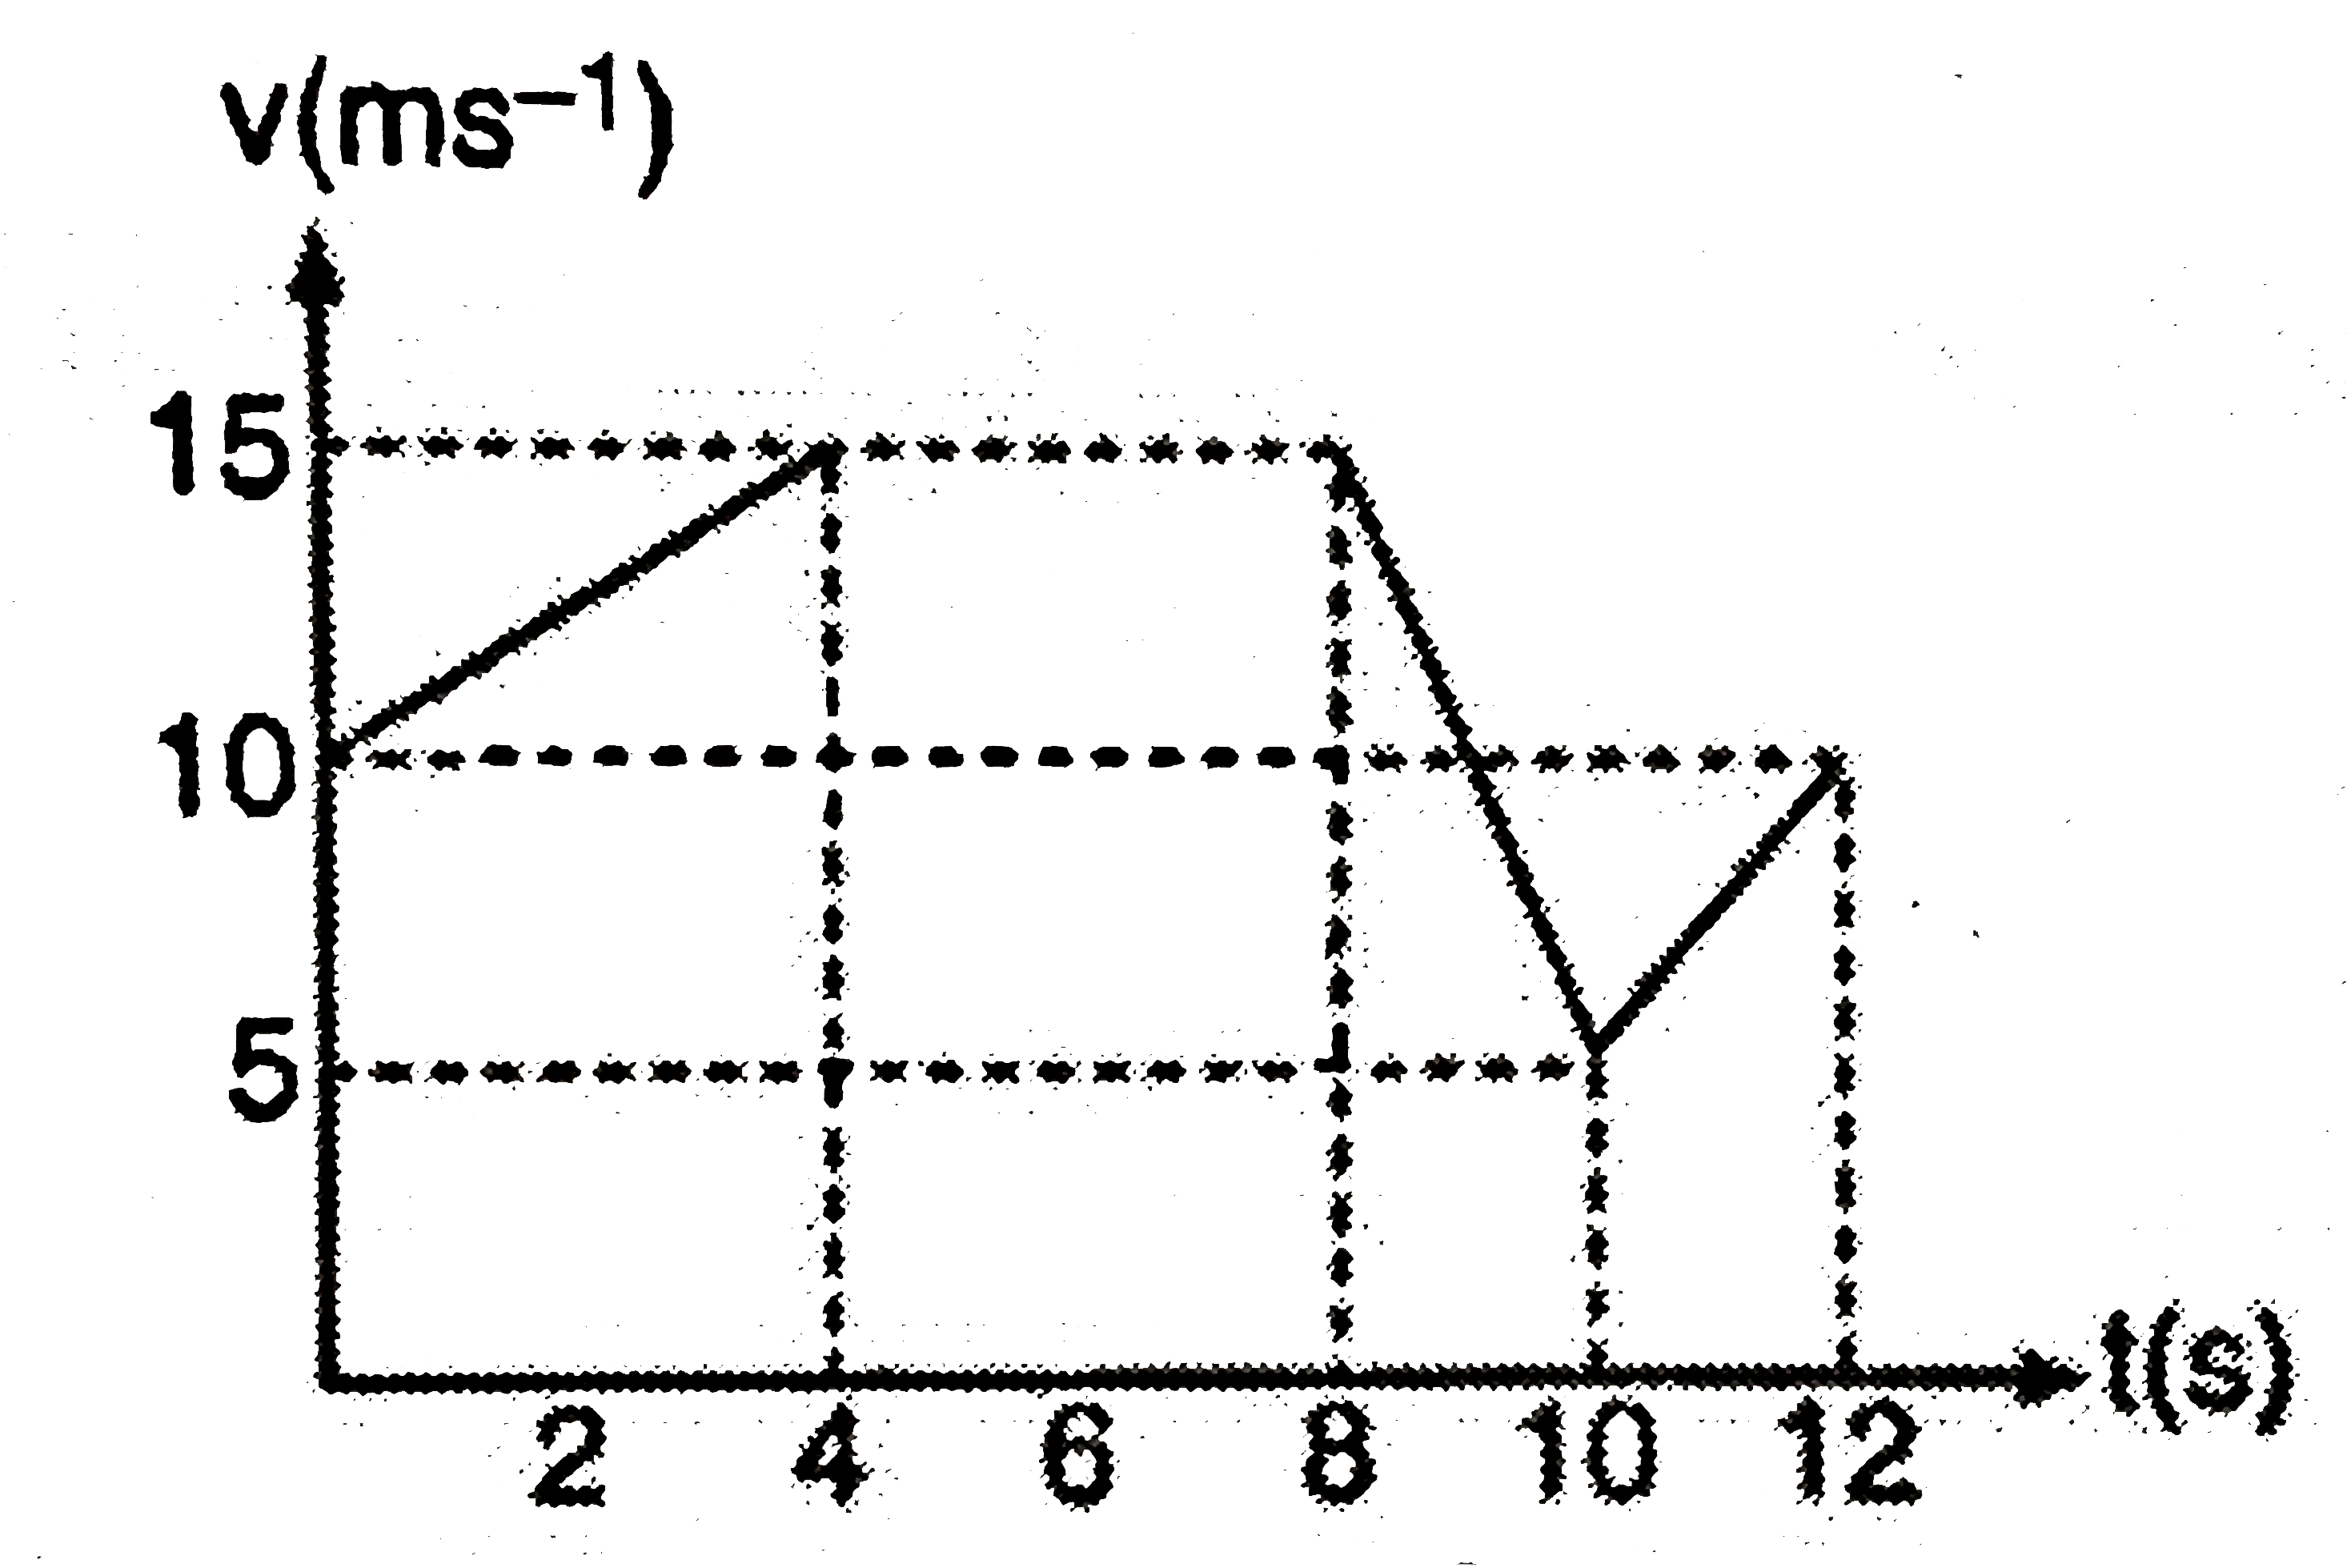 AzeroB5ms−2C−5ms2D−2ms−2
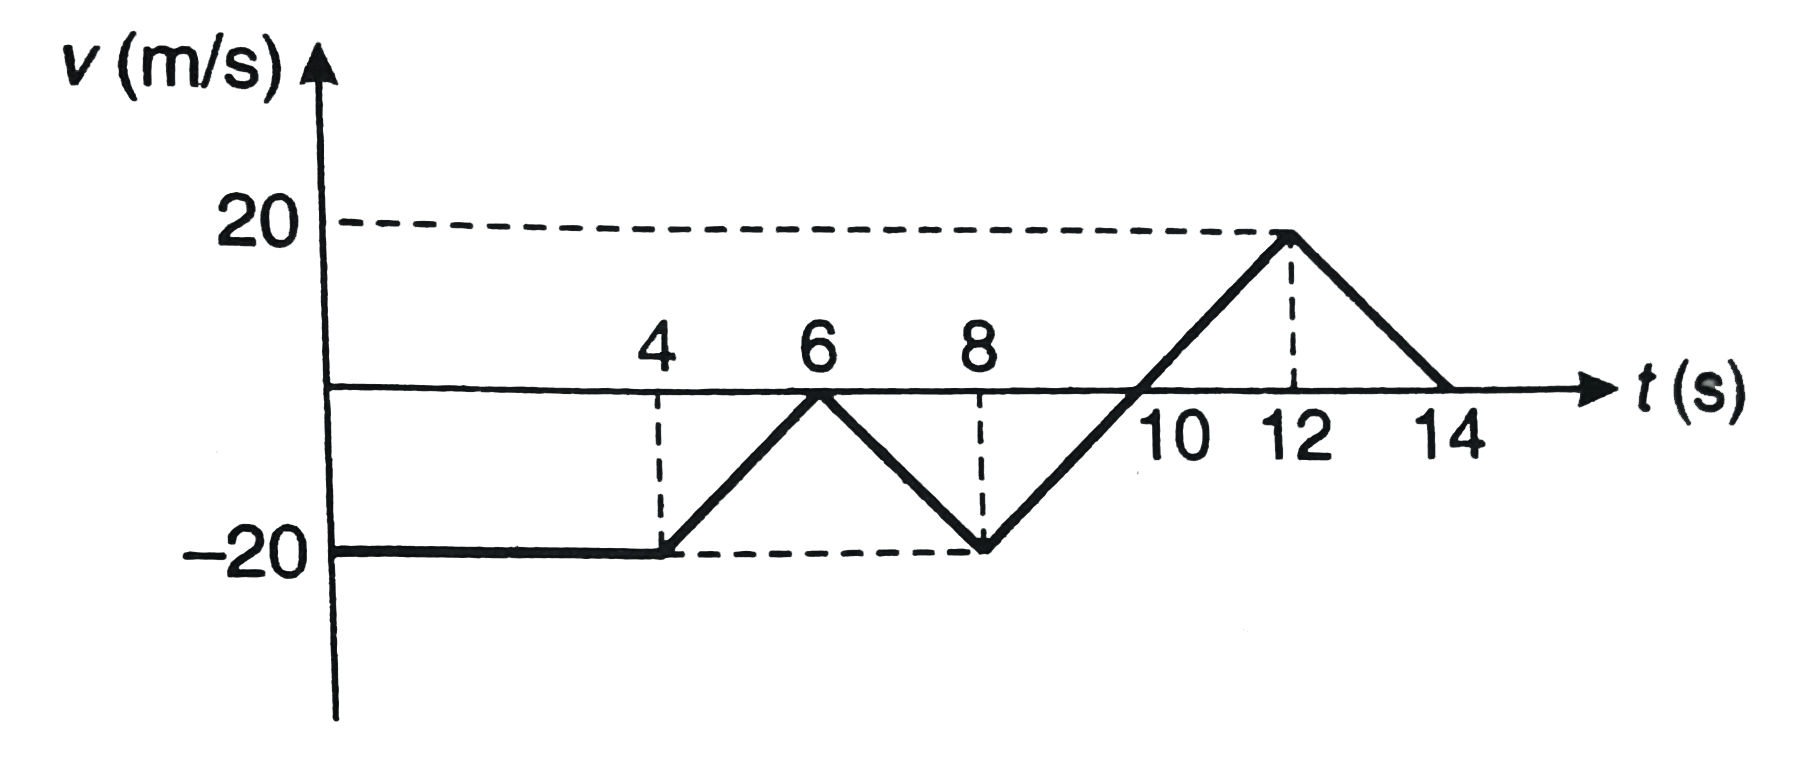
Velocity-time graph of a particle moving in a straight line is shown in figure. At time t=0.s=20m. Plot a-t and s-t graphs of the particle.
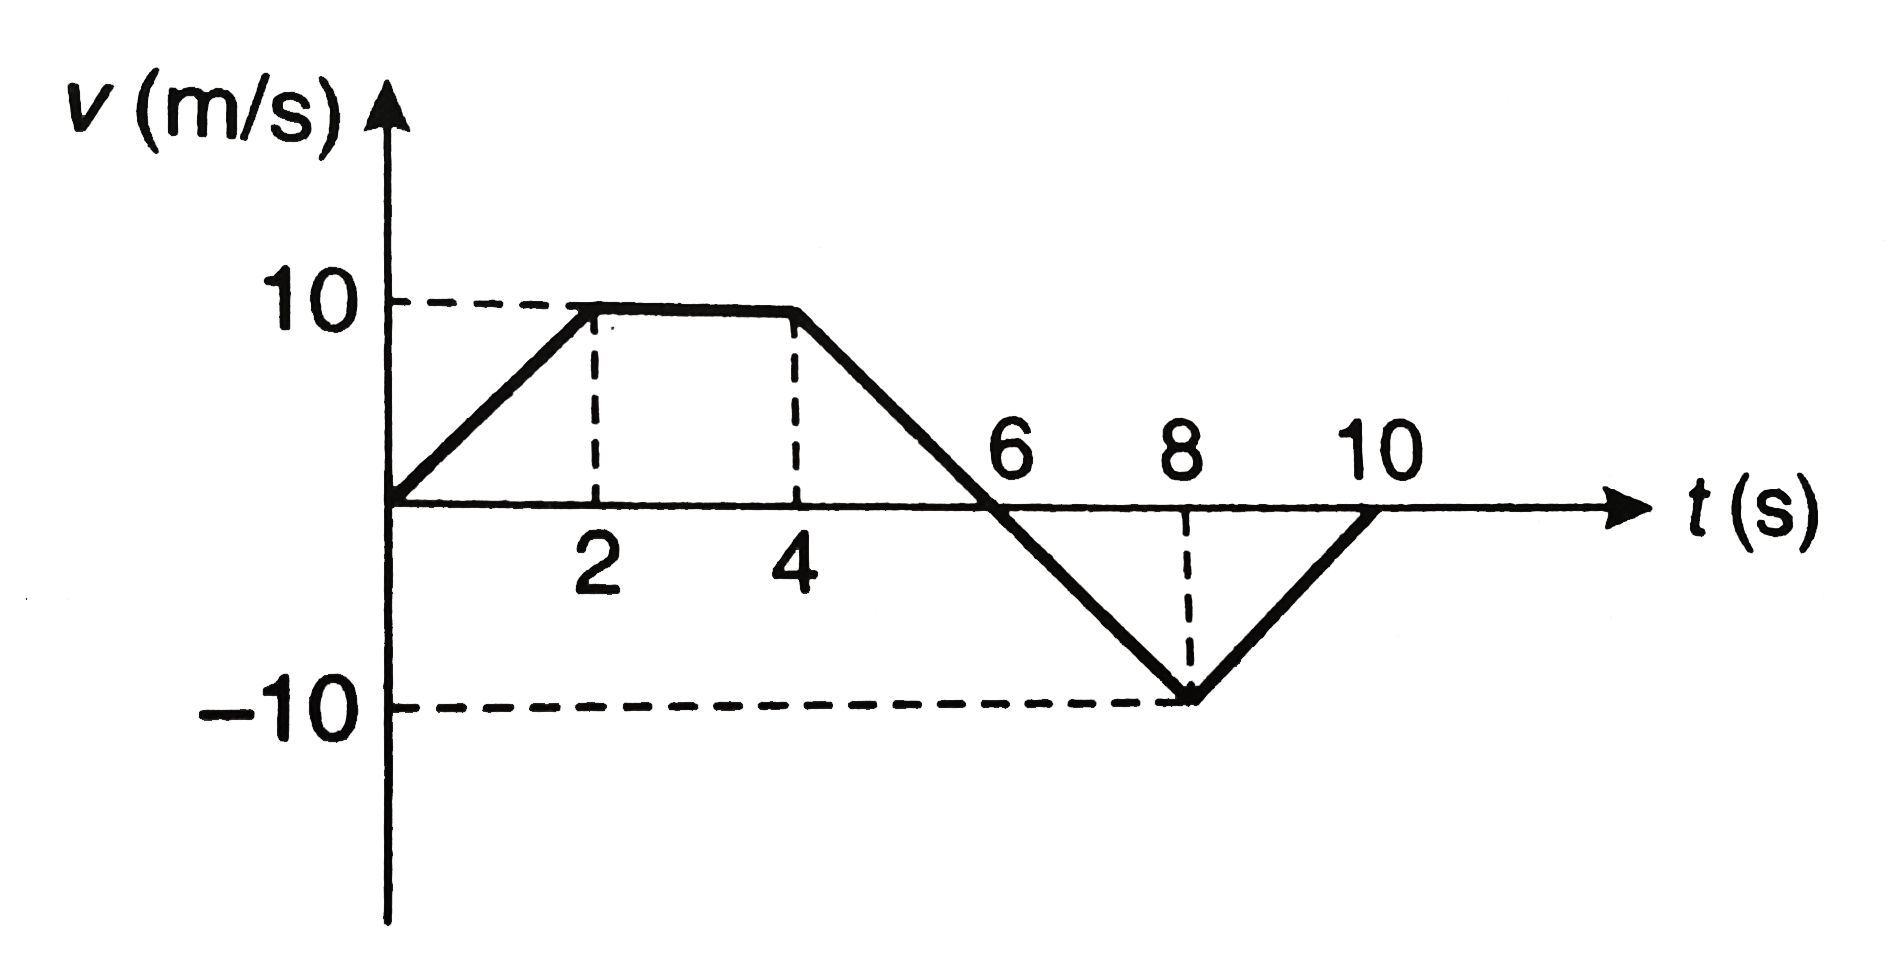
View SolutionVelocity-time graph of a particle moving in a straight line is shown in figure. At time t=0,s=−10m. Plot corresponding a-t and s-t graphs.
View SolutionDuring one dimensional motion on x-axis Velocity time graph for particle is given.
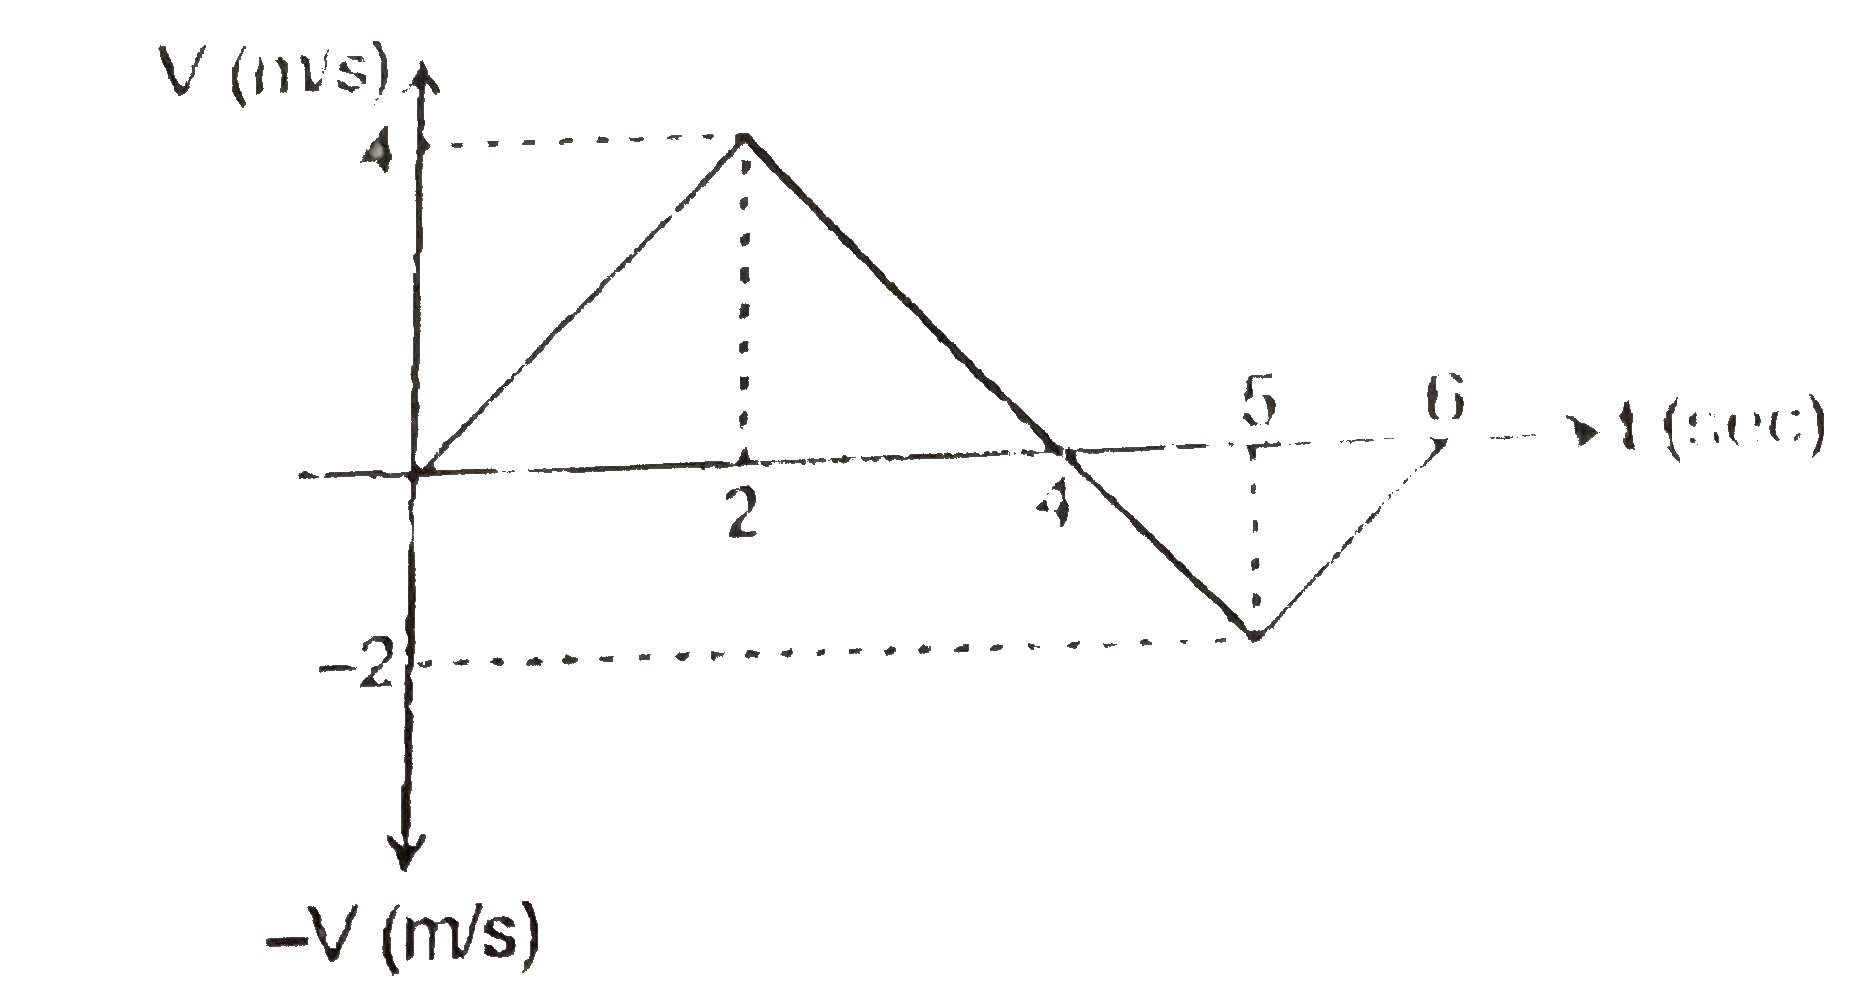
Average acceleration between (t = 0 sec) to (t = 6 sec)
View SolutionThe diagram shows the displacement-time graph for a particle moving in a straight line. Find the average velocity for the interval from t=0 to t=5s.
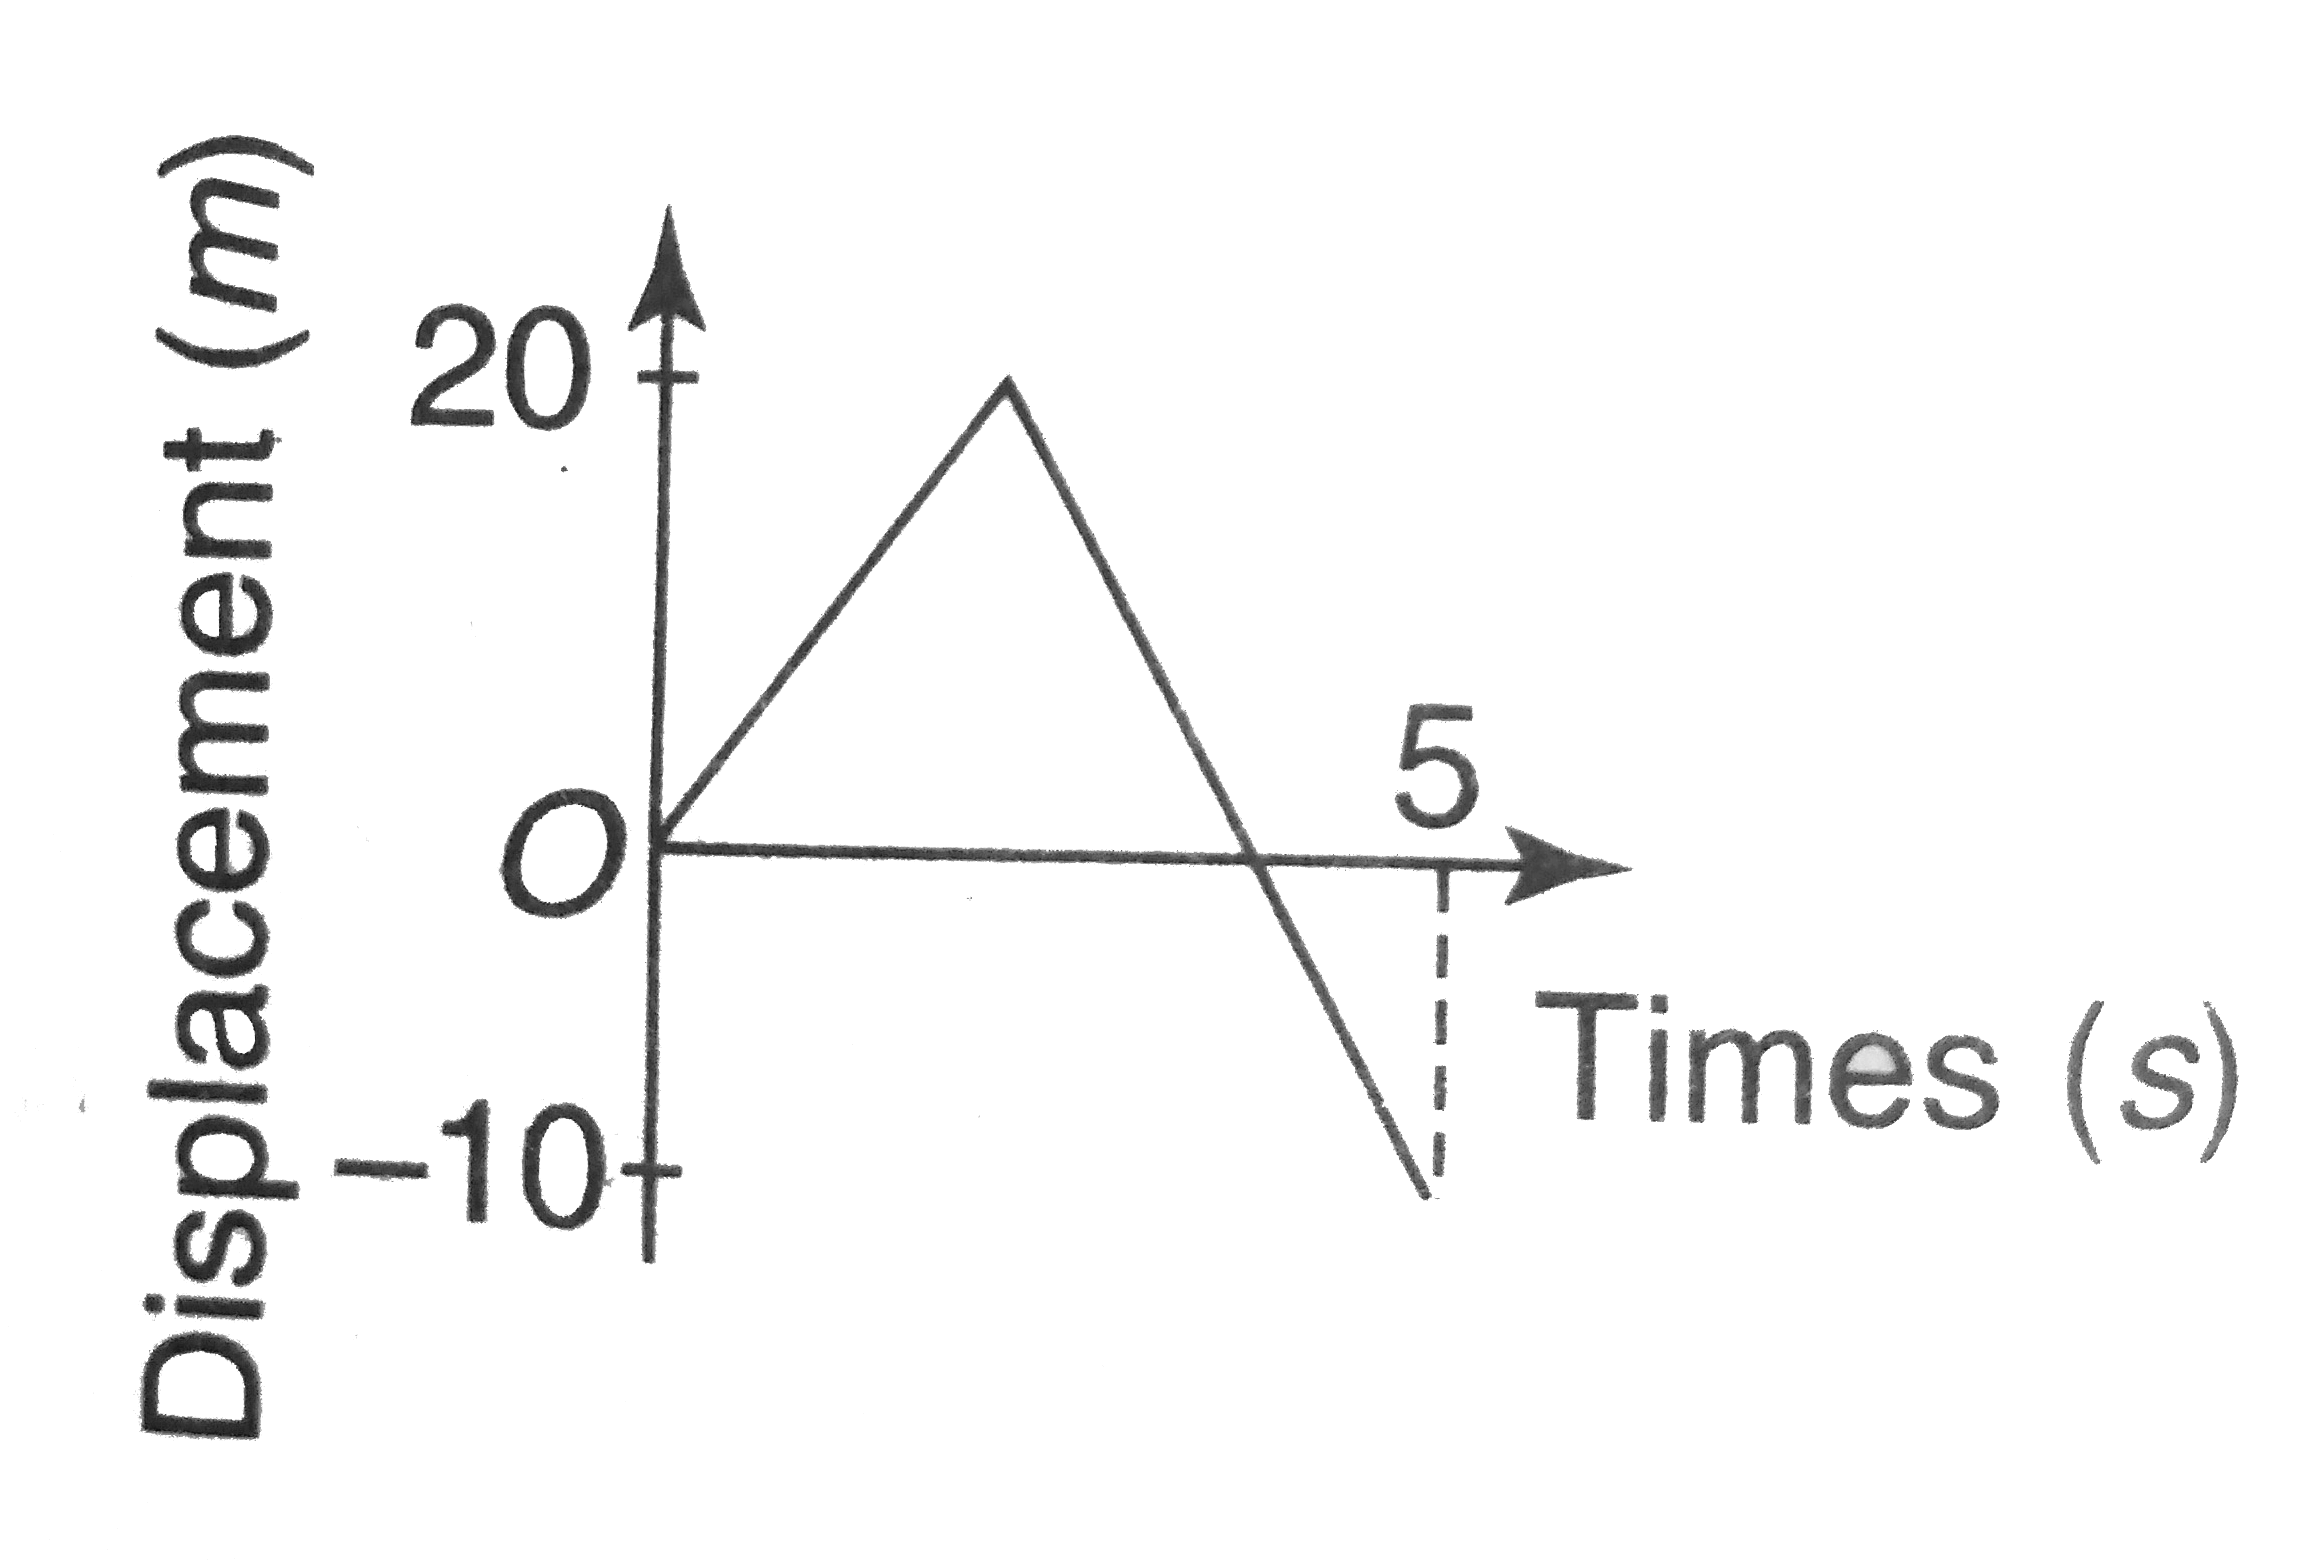
View SolutionThe diagram shows the displacement-time graph for a particle moving in a straight line. Find the average velocity for the interval from t=0 to t=5s.

View Solution
