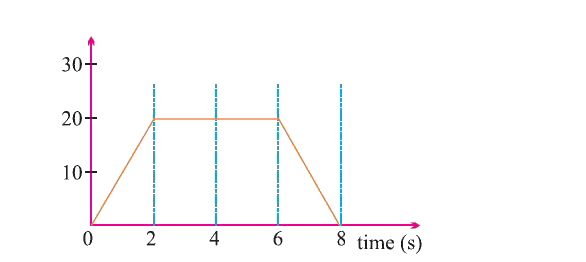
the velcoity - time graph for a vehicle is shown if fig 3.24. drow acceleration - time graph from it .
Video Solution
|
Answer
Step by step video solution for the velcoity - time graph for a vehicle is shown if fig 3.24. drow acceleration - time graph from it . by Physics experts to help you in doubts & scoring excellent marks in Class 11 exams.
Updated on:21/07/2023Topper's Solved these Questions
Similar Questions
Knowledge Check
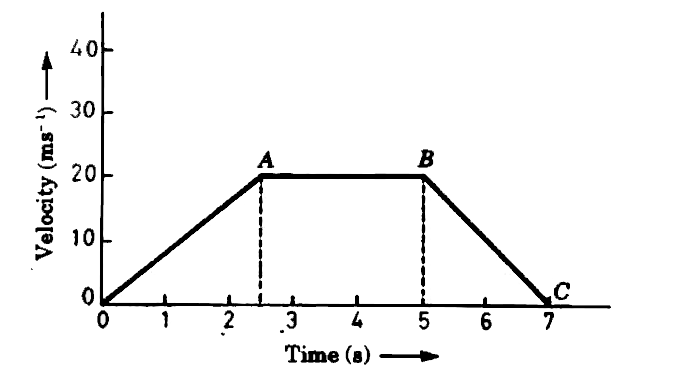
The velocity - time graph of a body is given in figure below .
The acceleration-time graph of the motion of the body isA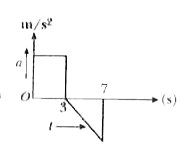 B
B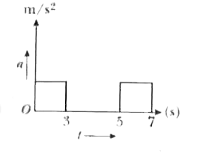 C
C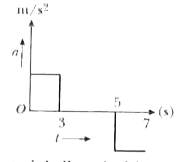 D
D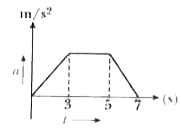
The area under acceleration-time graph gives
ADistance travelledBChange in accelerationCForce actingDChange in velocityThe distance-time graph of a moving vehicle is as shown in the figure.
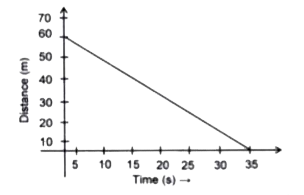 AThe speed of the vehicle is increasing with time.BThe speed of the vehicle is decreasing with time.CThe final speed of the vehicle is zero.DGraph is not possible.
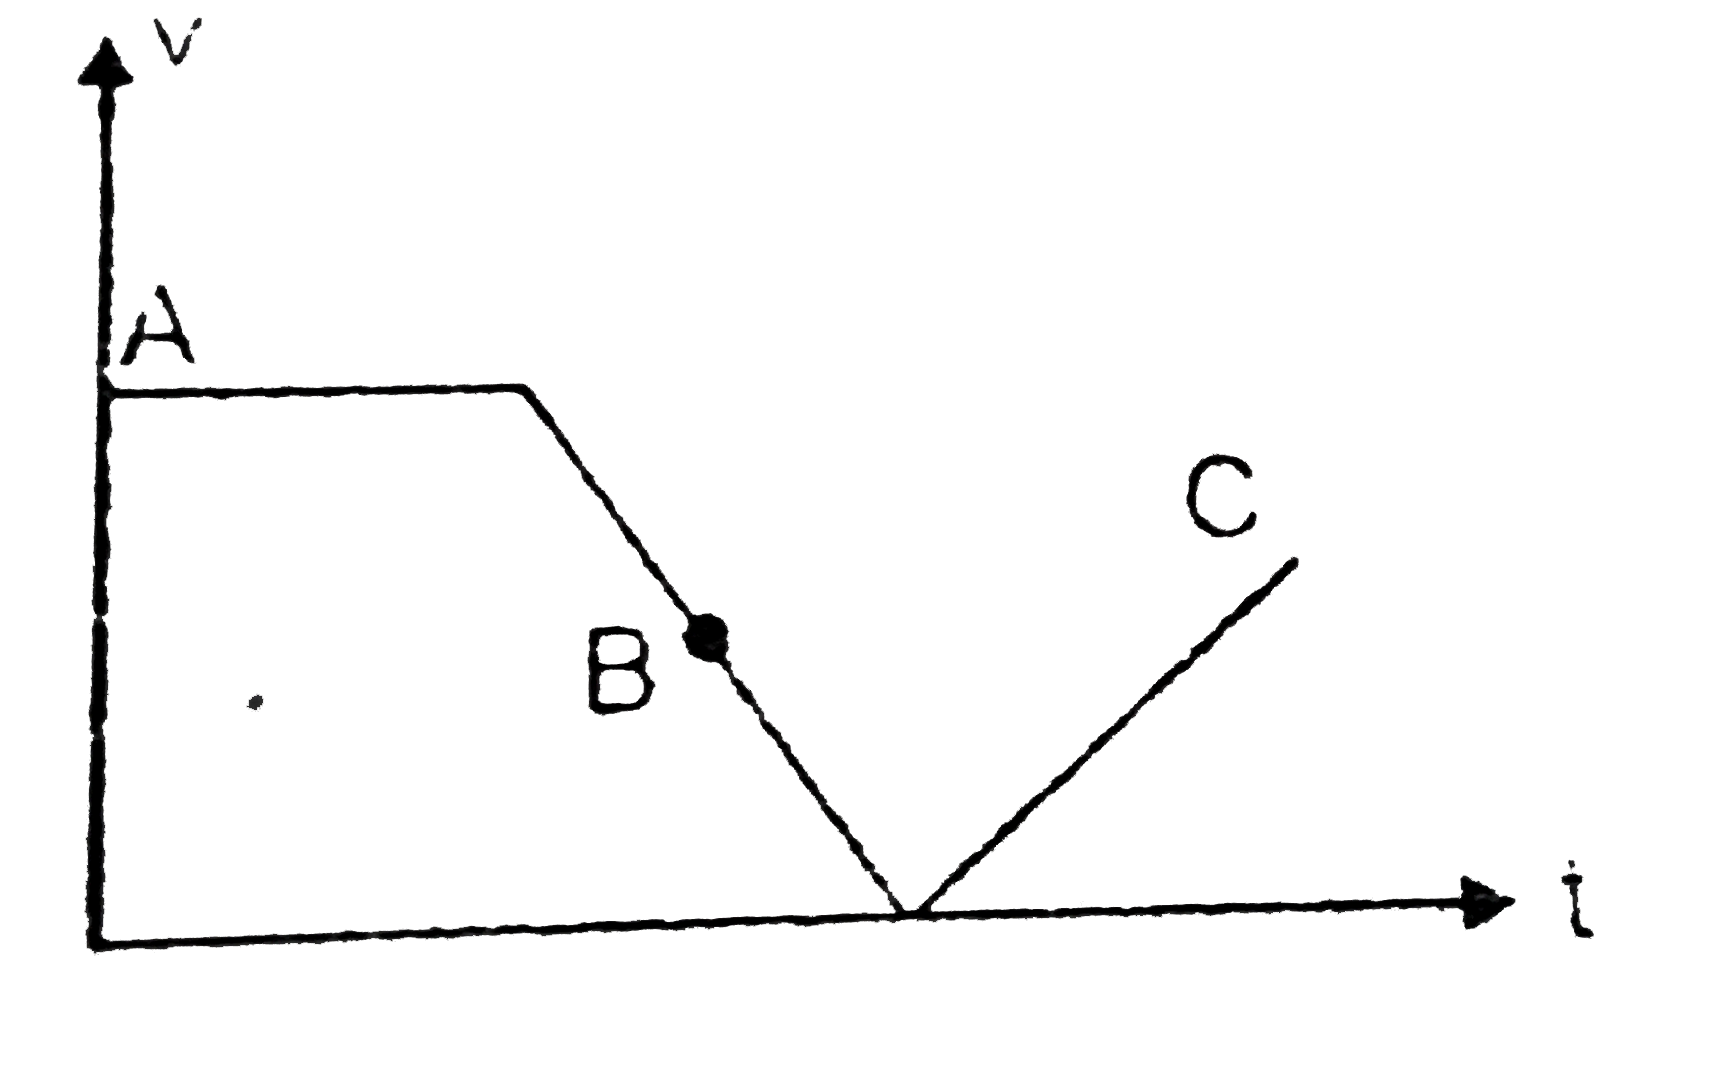
The velocity time graph of a body is shown in fig. it indicates that :
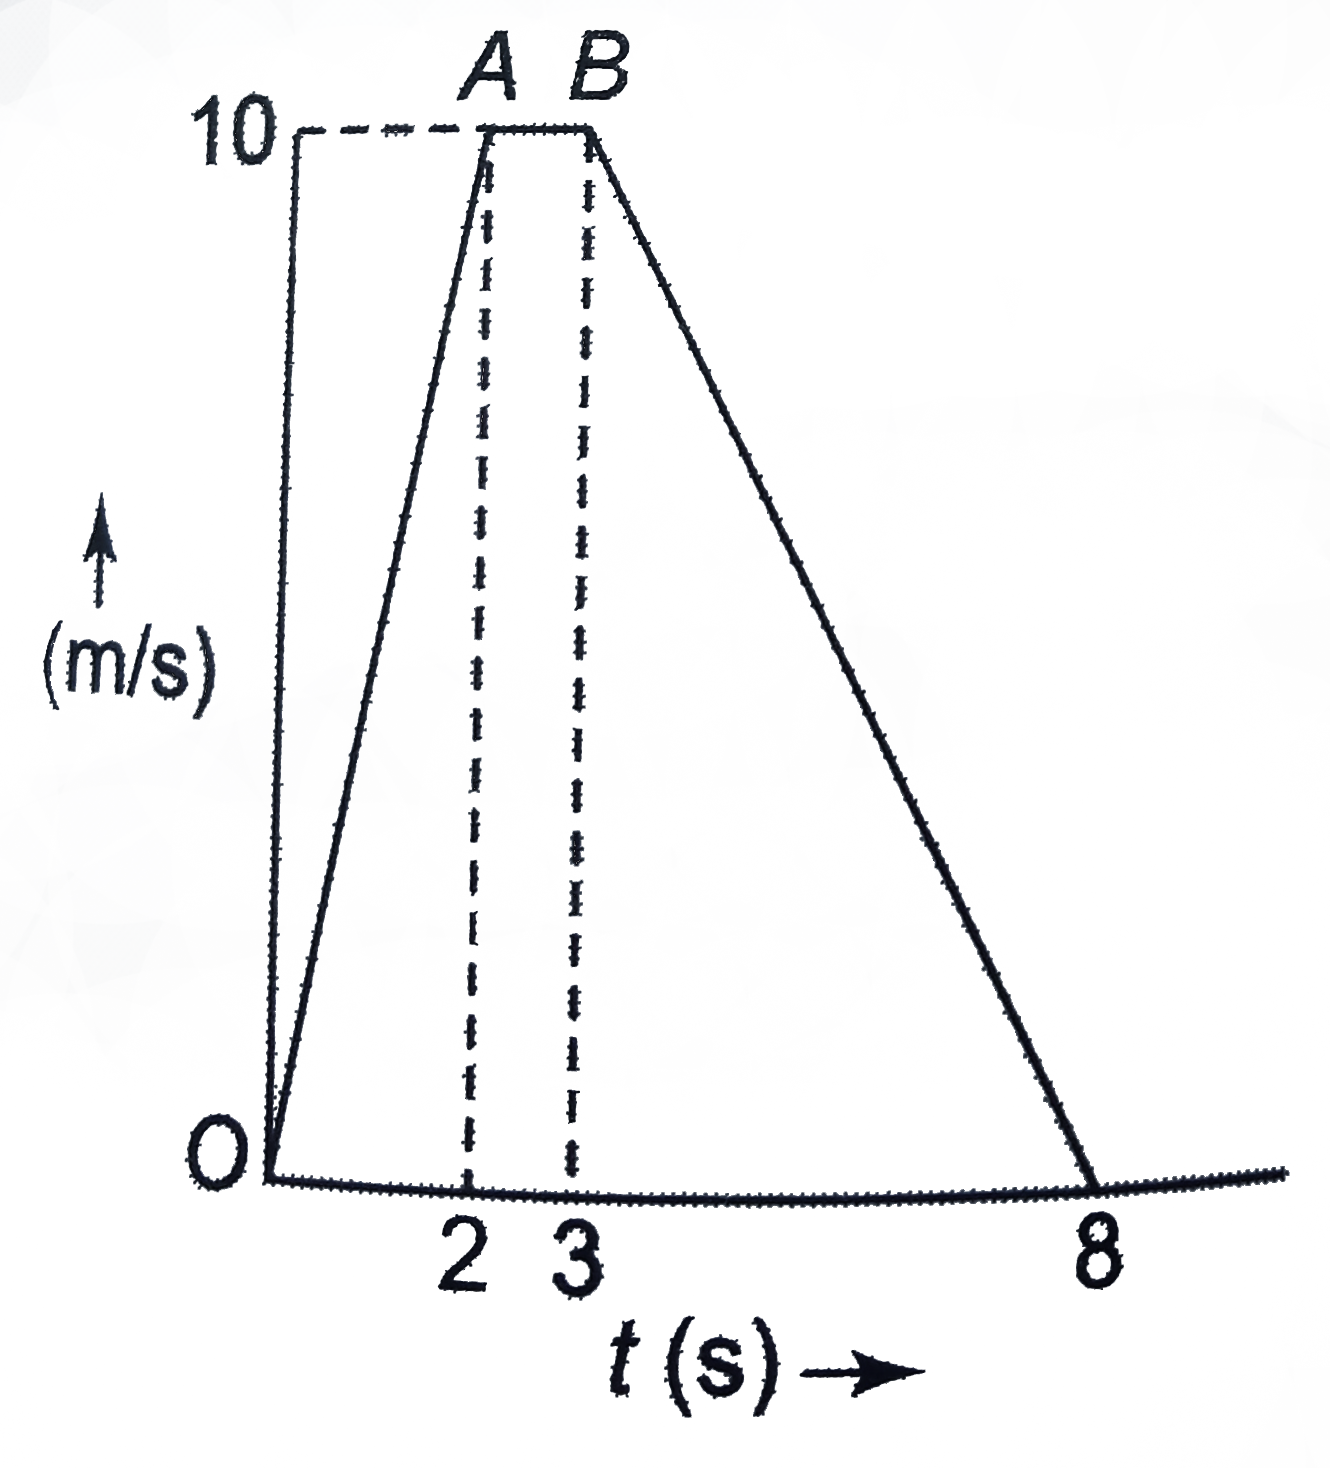
View SolutionFor a particle moving in a straight line, the velocity-time graph is as shown in the figure. Find the acceleration at time t=1s2.5s and 5s. Sketch the acceleration time graph.
View SolutionThe area under acceleration - time graph represents the
View SolutionThe veloctiy - time graph of a body is shown in the fig. It implies that at point B.

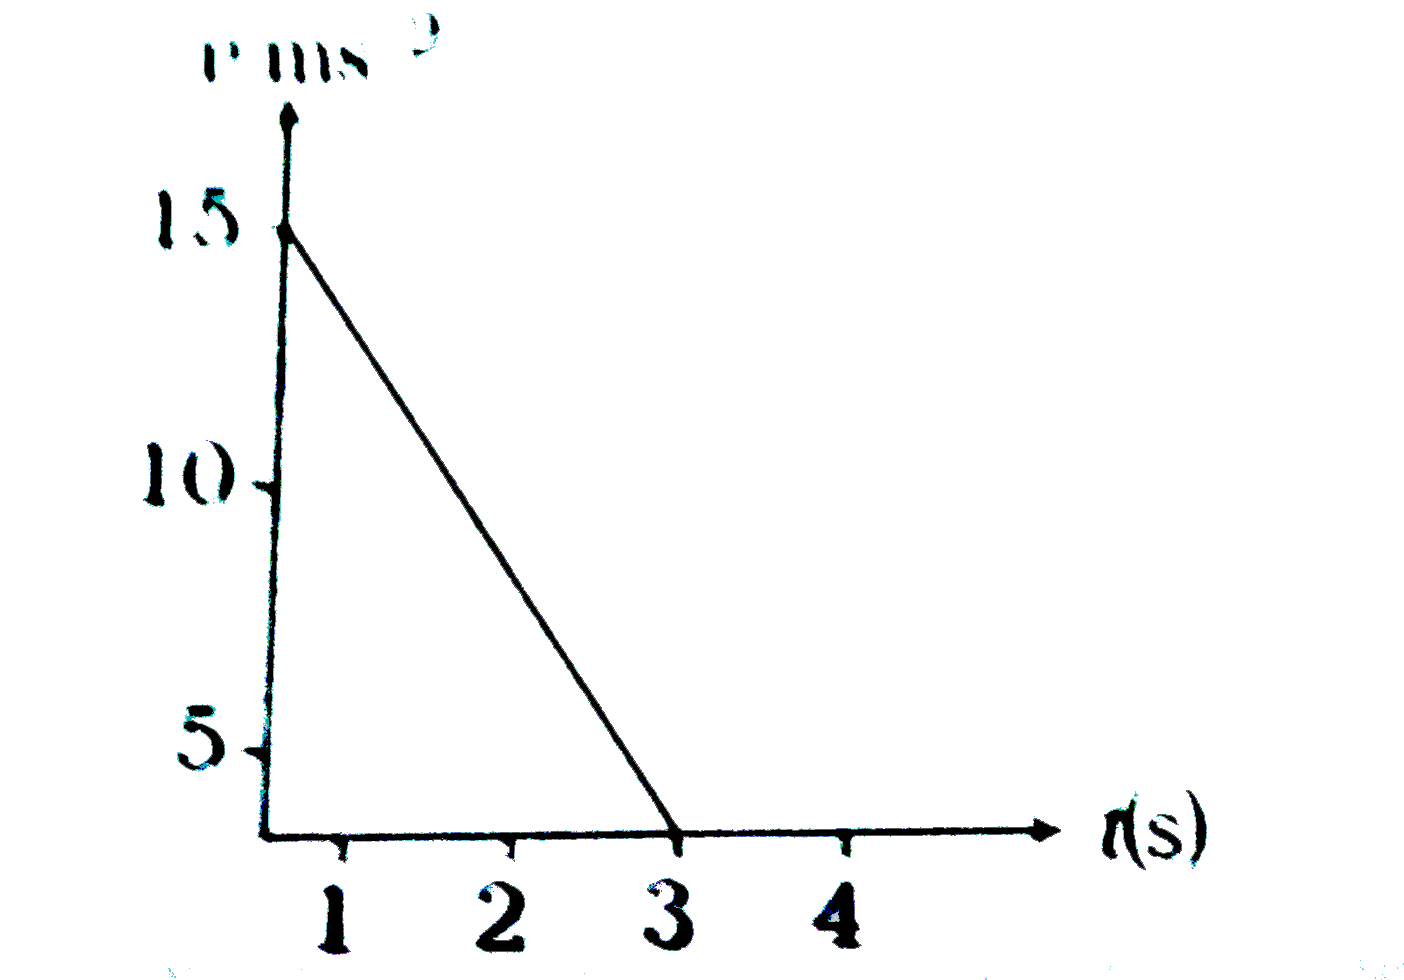
View SolutionThe velocity - time graph is shown in the figure, for a particle. The acceleration of particle is
View Solution

