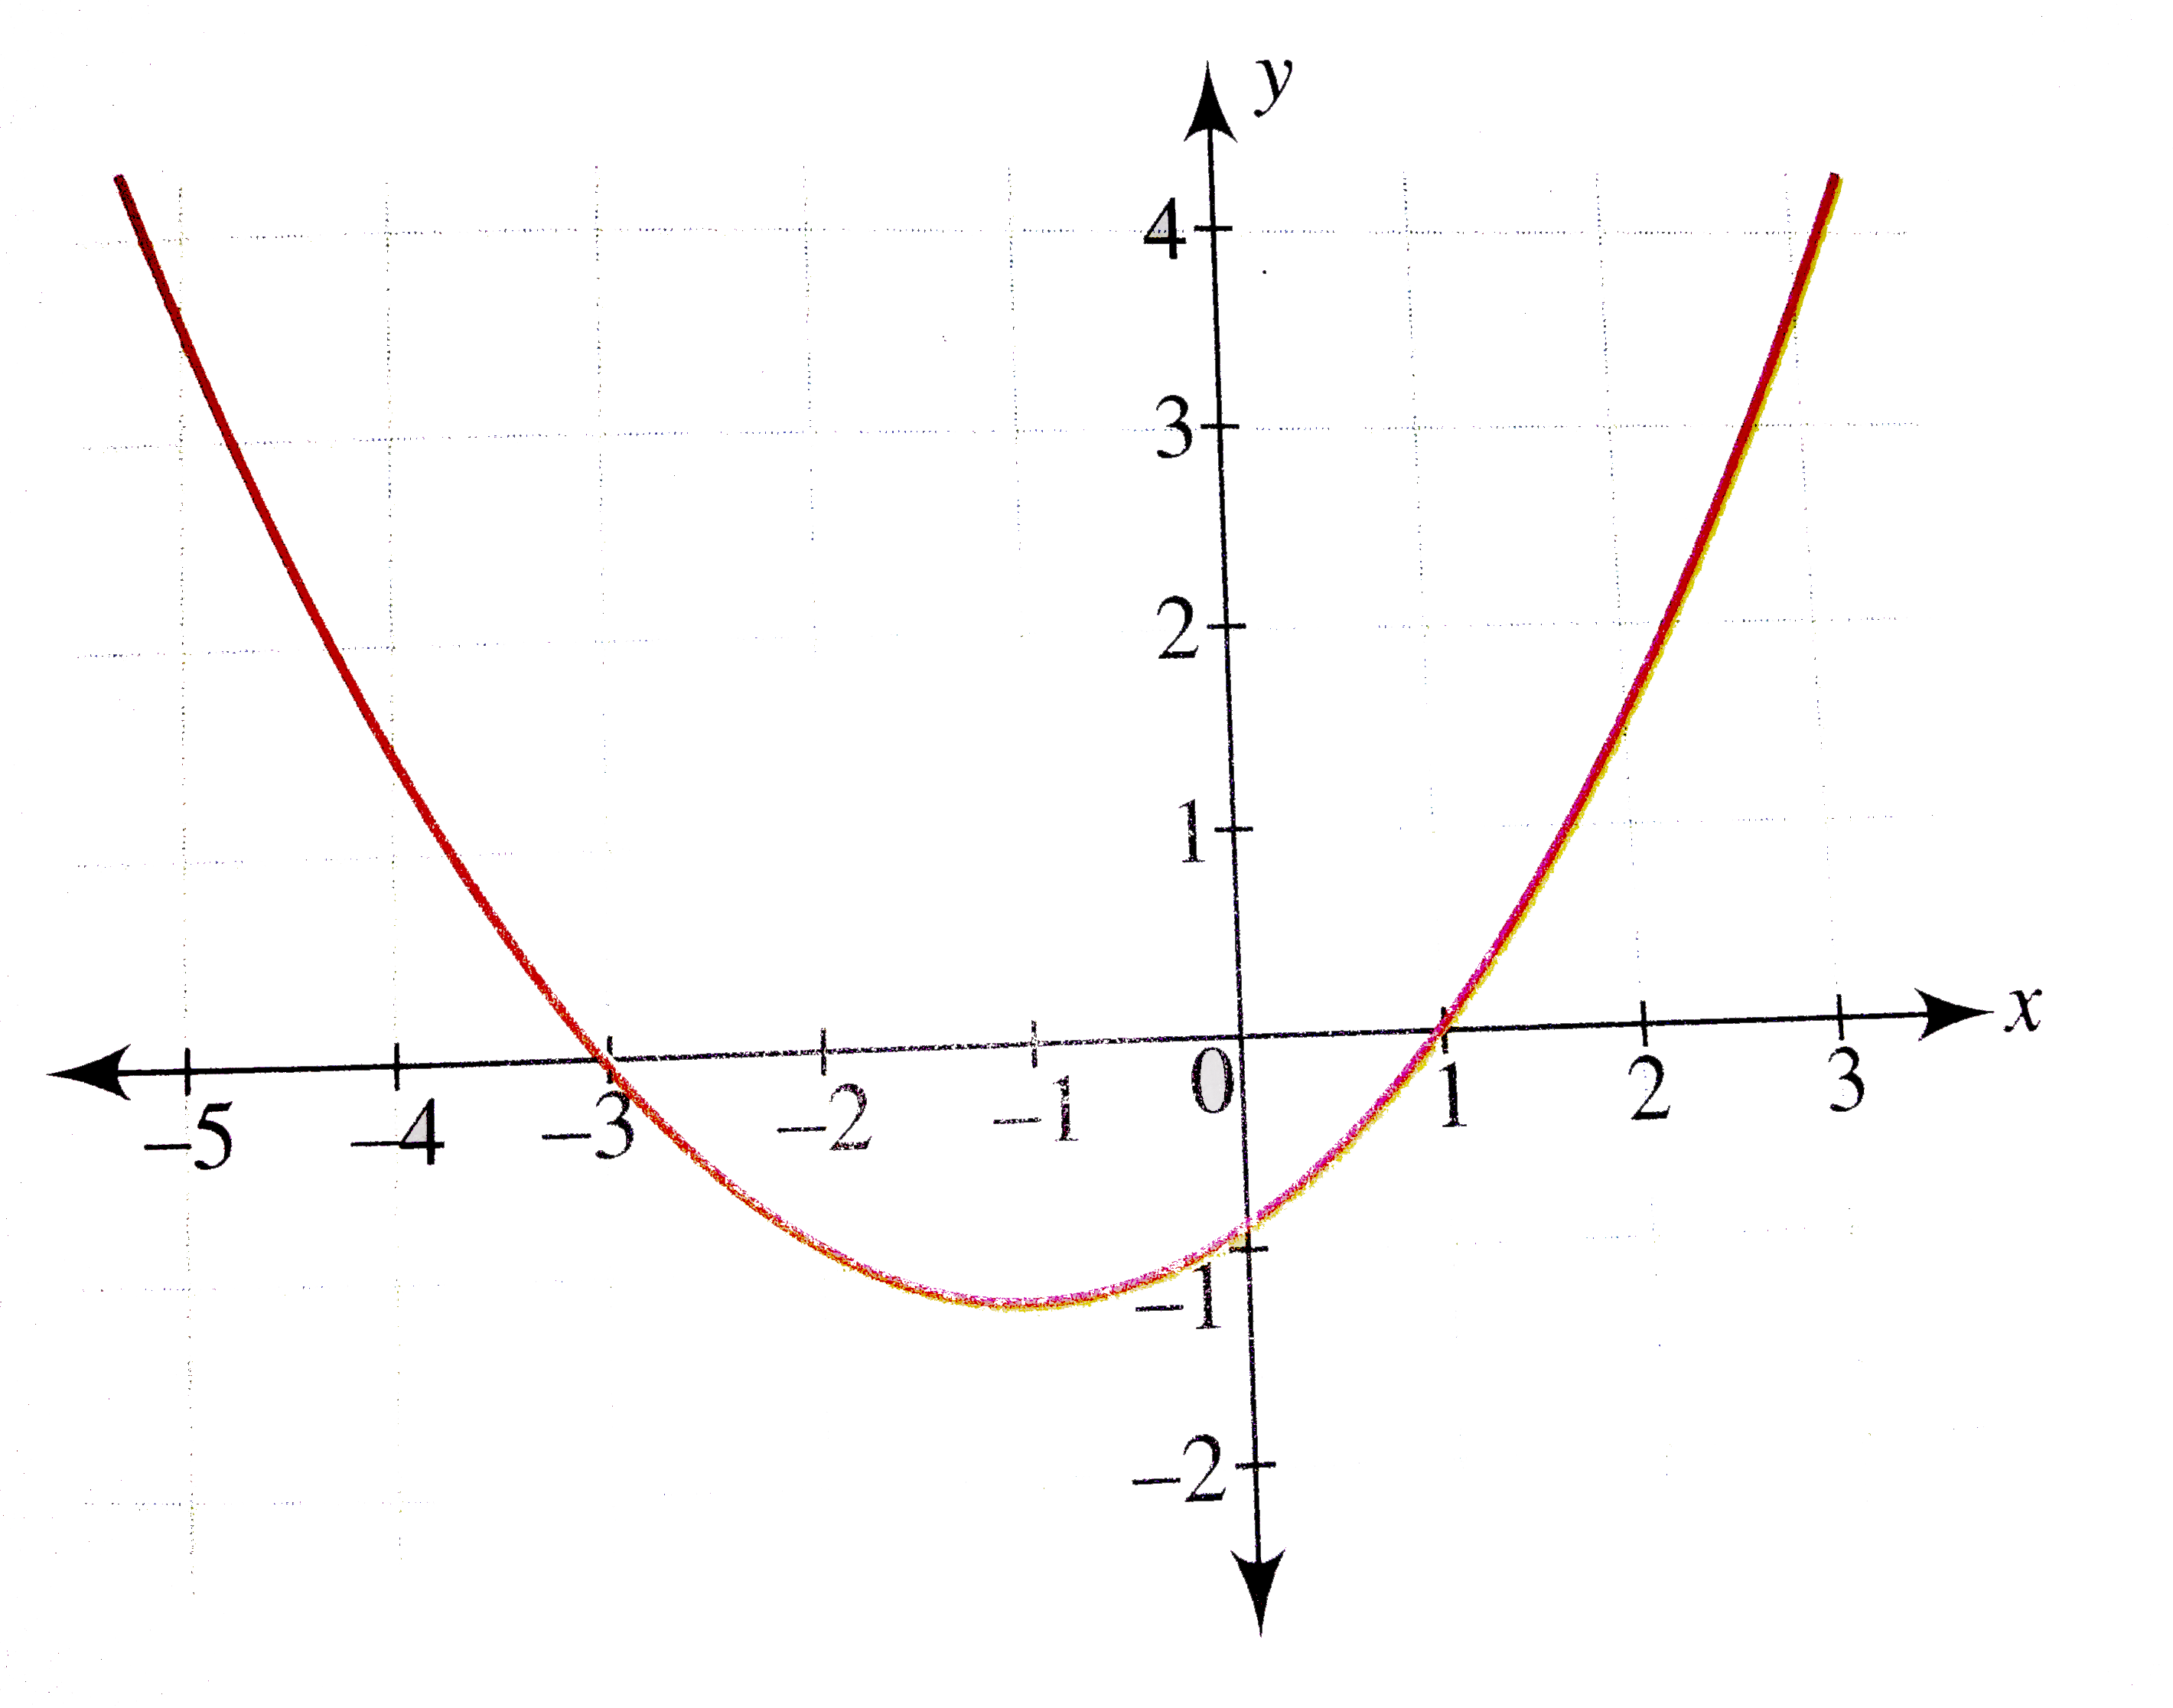
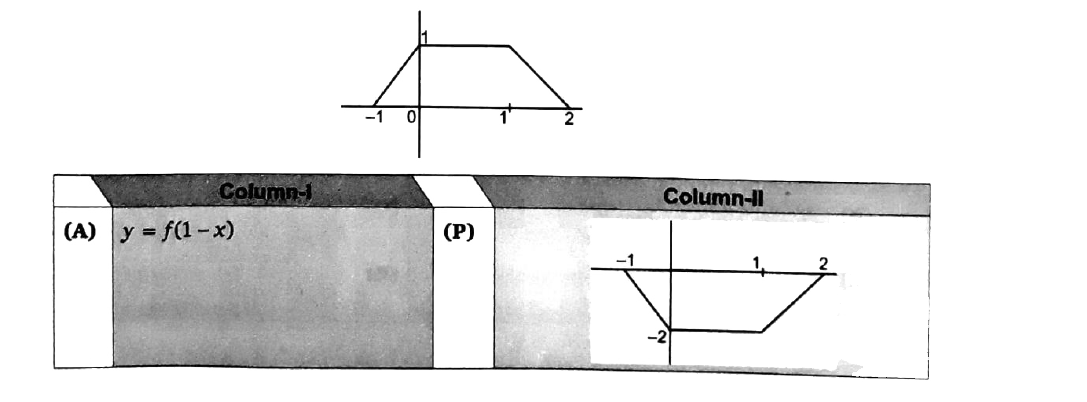
Given the graph of the function y=f(x), draw the graph of y=sgn(x).

Video Solution
Text Solution
x = 1, 4, 6 are the points of local maxima, and the local maximum values are f(1)=2,f(4)=4andf(6)=3.
x = 5, 7 are the points of local minima, and the local minimum values are f(5)=2,f(7)=1 .
x = 2 is the point of absolute minima and the local minimum value is f(2) = 0.
x = 8 is the point of absolute maxima and the absolute maximum value is f (4) = 5.
|
Topper's Solved these Questions
- GETTING STARTED WITH GRAPHSBOOK - CENGAGE ENGLISHCHAPTER - GETTING STARTED WITH GRAPHSEXERCISE - Exercises 1.14
1 Videos
- GETTING STARTED WITH GRAPHSBOOK - CENGAGE ENGLISHCHAPTER - GETTING STARTED WITH GRAPHSEXERCISE - Exercises 1.15
1 Videos
- GETTING STARTED WITH GRAPHSBOOK - CENGAGE ENGLISHCHAPTER - GETTING STARTED WITH GRAPHSEXERCISE - Exercises 1.12
1 Videos
- FUNCTIONSBOOK - CENGAGE ENGLISHCHAPTER - FUNCTIONSEXERCISE - Comprehension Type
7 Videos
- GRAPH OF INVERSE TRIGONOMETRIC FUNCTIONSBOOK - CENGAGE ENGLISHCHAPTER - GRAPH OF INVERSE TRIGONOMETRIC FUNCTIONSEXERCISE - Exercises
18 Videos
Similar Questions
Draw the graph of y=|x|
View SolutionDraw the graph of y=2x.
View SolutionDraw the graph of y=x−sinx
View SolutionDraw the graph of y=sin|x|.
View SolutionDraw the graph of y=x/ln x
View SolutionGiven the graph of y=f(x)

View Solutiondraw graph of y=2x
View SolutionDraw the graph of y=xsinx.
View SolutionDraw the graph of the function f(x)=xx
View SolutionDraw the graph of the function f(x)=|x−1|
View Solution
