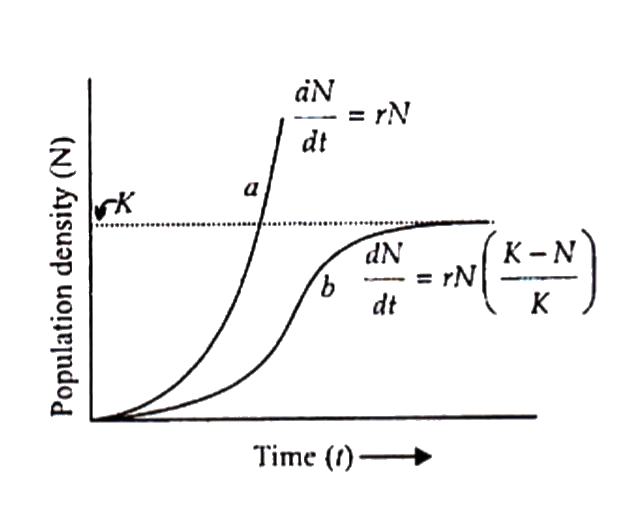
Study the population growth curves shown above
(i) Identify curves'a'and'b'.
(ii) Mention the conditions responsible for the curves 'a' and 'b' respectively.
(iii) Give the necessary eqution for the curve 'b'
(i) a = when resources are not limlting the growrh,
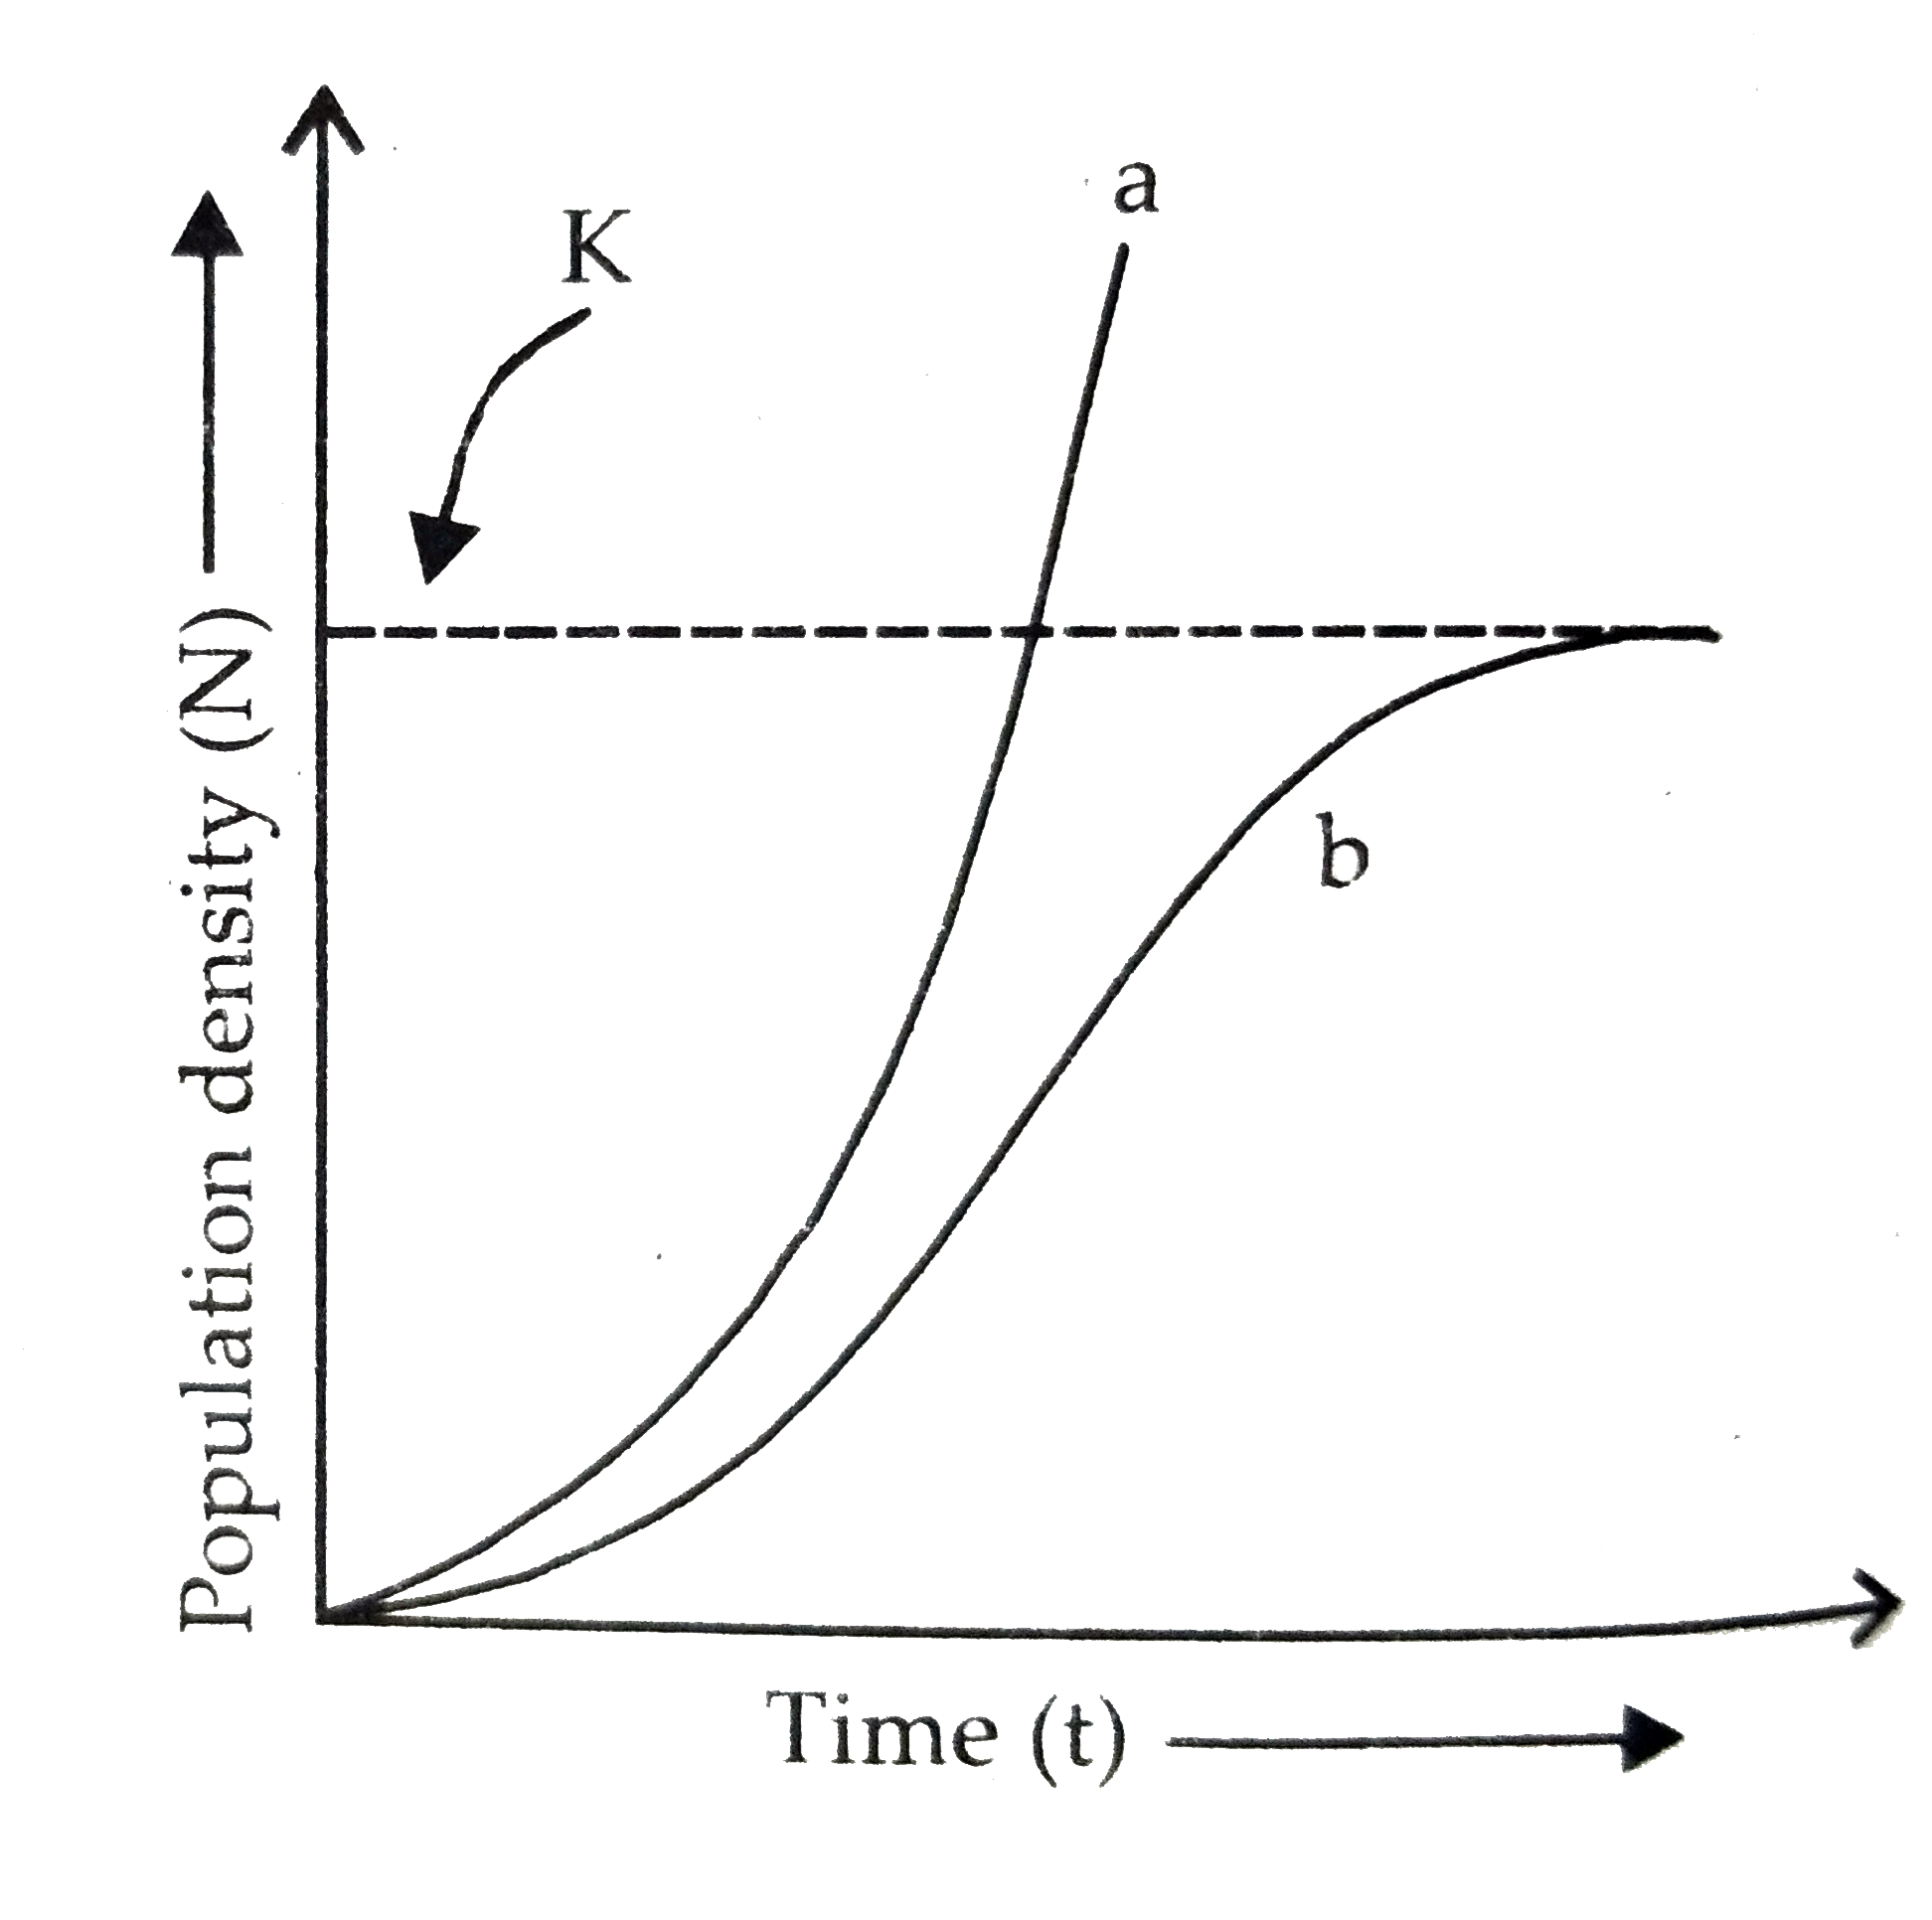
Plot exponental growth curve.
(dN)(dt)=rN
b = when resources are limiting the growth, Plot is logistic growth curve.
dNdt=rN(K−NK)
(ii) In nature a given habitat has enough resources to support a maximum possible number, beyond which no further growth is possible.
Aa population growing in a habitat with limited resources shows a lag phase which is followed by phases of acceleration and declaration and finally an asymptote.
(iii) dNdt=rN(K−NK)
N = Population density at time (t)
r = Instrinsic rate of natural increase
K = carring capacity.
Topper's Solved these Questions
- XII BOARDSBOOK - XII BOARD PREVIOUS YEAR PAPER ENGLISHCHAPTER - XII BOARDSEXERCISE - SET - I SECTION C
14 Videos
- XII BOARDSBOOK - XII BOARD PREVIOUS YEAR PAPER ENGLISHCHAPTER - XII BOARDSEXERCISE - SET - I SECTION D
8 Videos
- XII BOARDSBOOK - XII BOARD PREVIOUS YEAR PAPER ENGLISHCHAPTER - XII BOARDSEXERCISE - [OUTSIDE DELHI : SET-III] SECTION - C
10 Videos
- SAMPLE PAPER 2019BOOK - XII BOARD PREVIOUS YEAR PAPER ENGLISHCHAPTER - SAMPLE PAPER 2019EXERCISE - Section E Part B
3 Videos
Similar Questions
Population growth curve in most animals , except humans, is
View SolutionStudy the population growth curves in the graph given below and answer the questions which follow :
(i) Identify the growth curves ‘a’ and ‘b’.
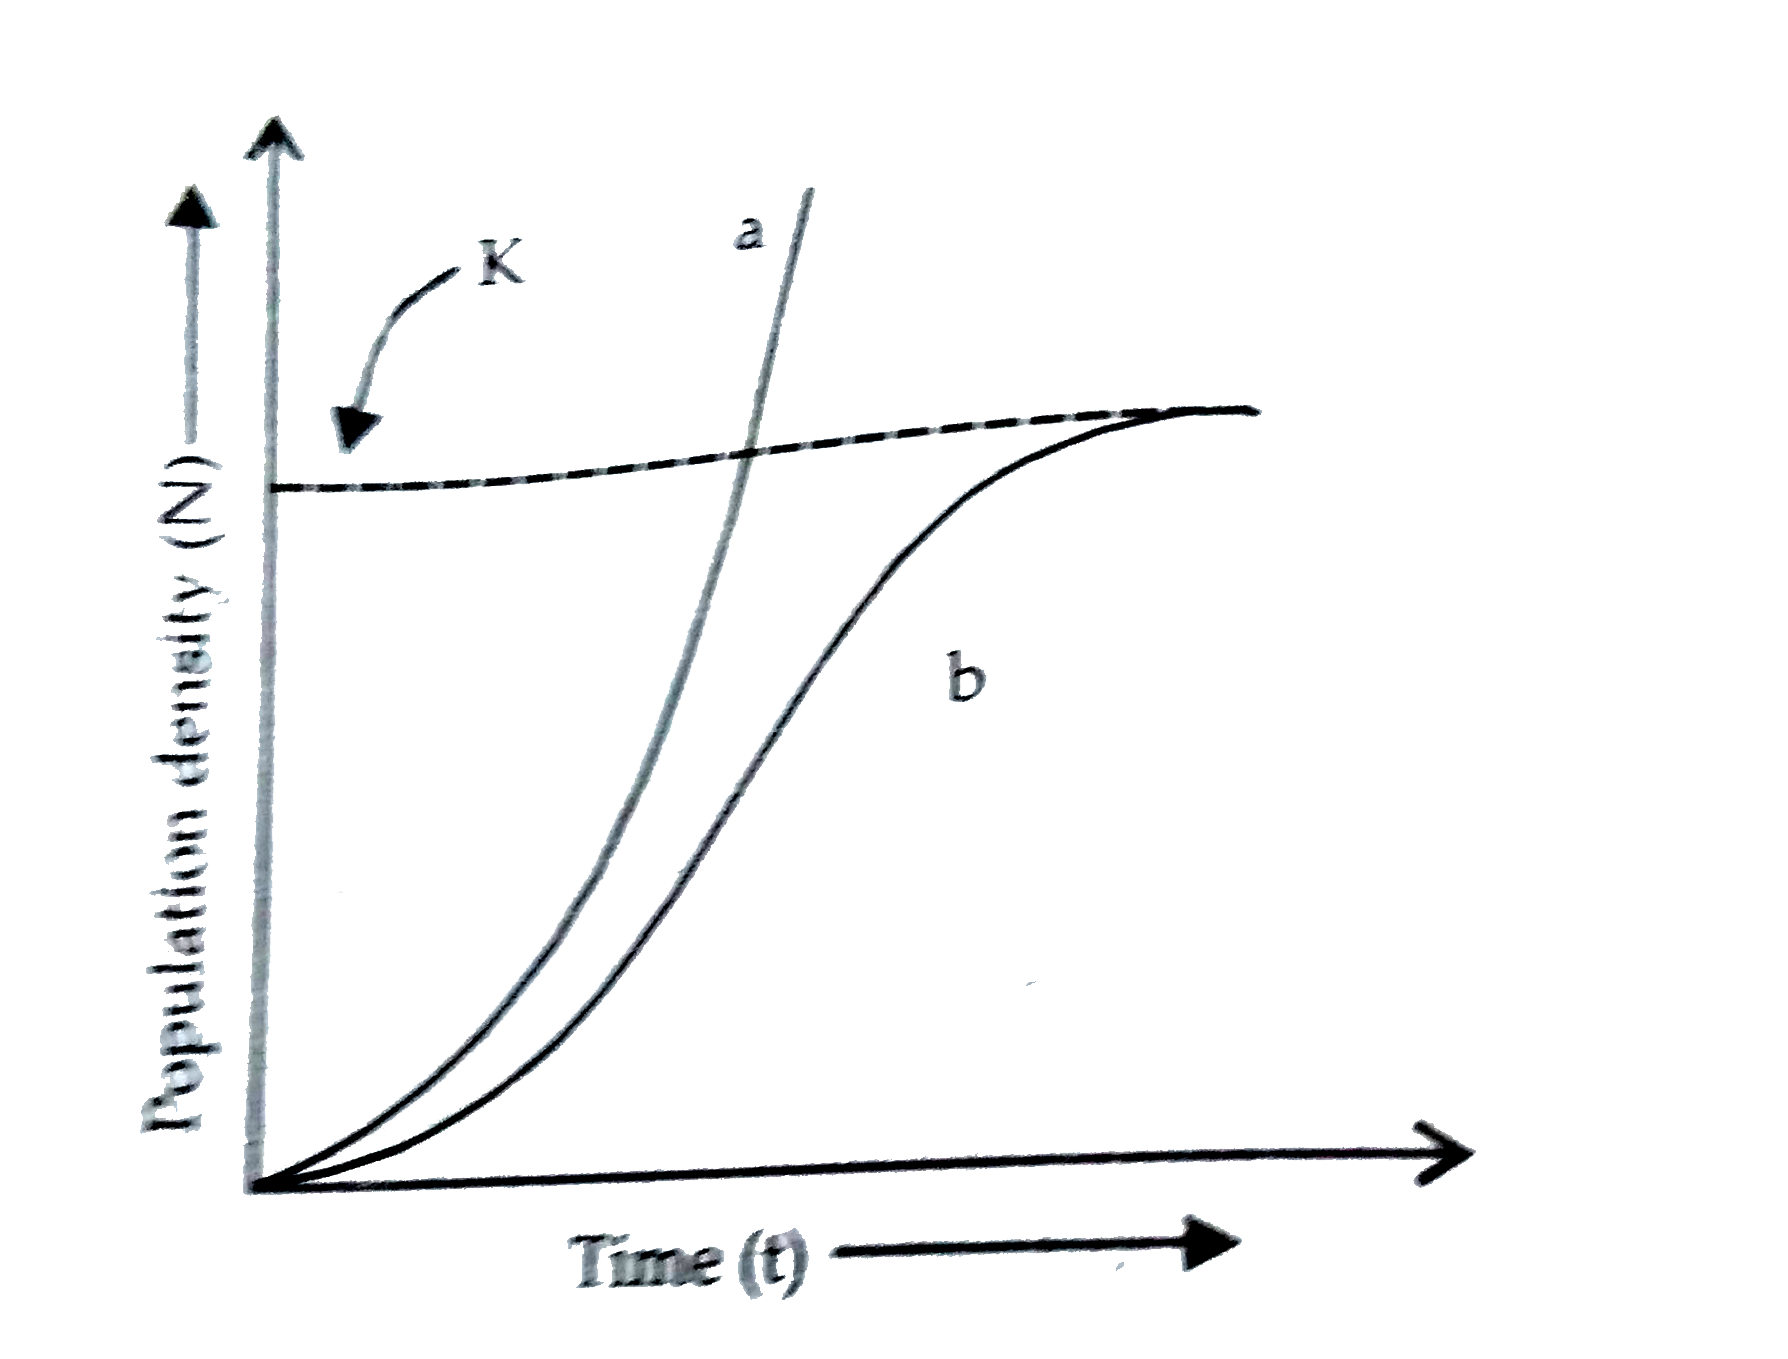
(ii) Which one. of them is considered a more realistic one and why ?
If dN9dt)=rN(K−NK) is the equation of the logistic growth curve, what does K stand for ?
(iv) What is symbolised by N ?
View Solution
Knowledge Check
Study the population growth curves (A and B) in the given graph and select the incorrect option.
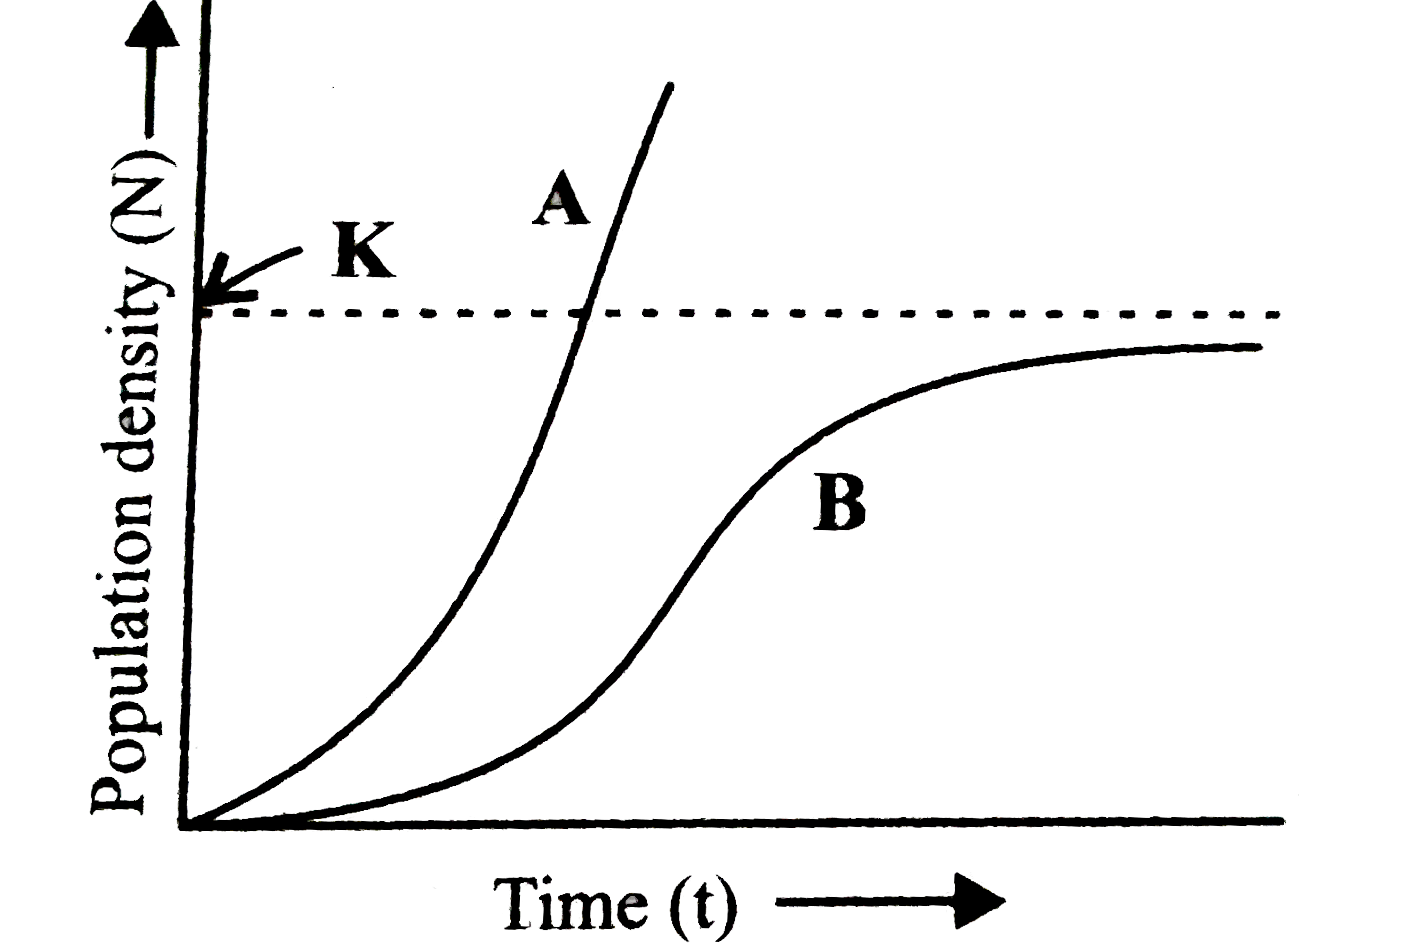 ACurve 'A' shows exponential growth, represented by equation dNdt=rN.BCurve 'B' shows logistic growth, represented by equation dNdt=rN(K−NK)CExponential growth curve is considered as more realistic than the logistic growth curve.DCurve 'A' can also be represented by equation Nt=N0ert.
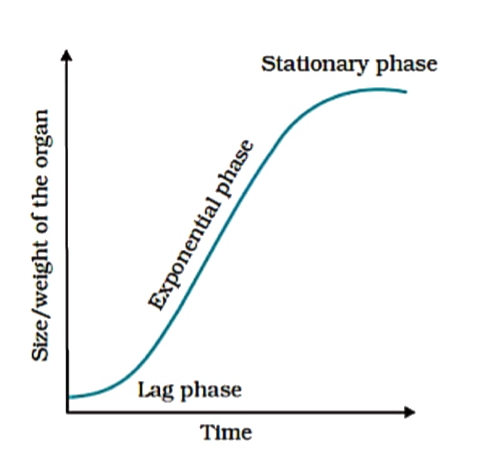
A growth curve of a plant is shown below. The mathematical expression for growth curve will be:
View SolutionConditions responsible for shifting of O2 dissociation curve away from Y-axis (Right side) are
View SolutionThe graph shows two types of the population growth curve, 'a' - Exponential and 'b' - Logistic. Which of the following graph models is considered to be the more realistic one?
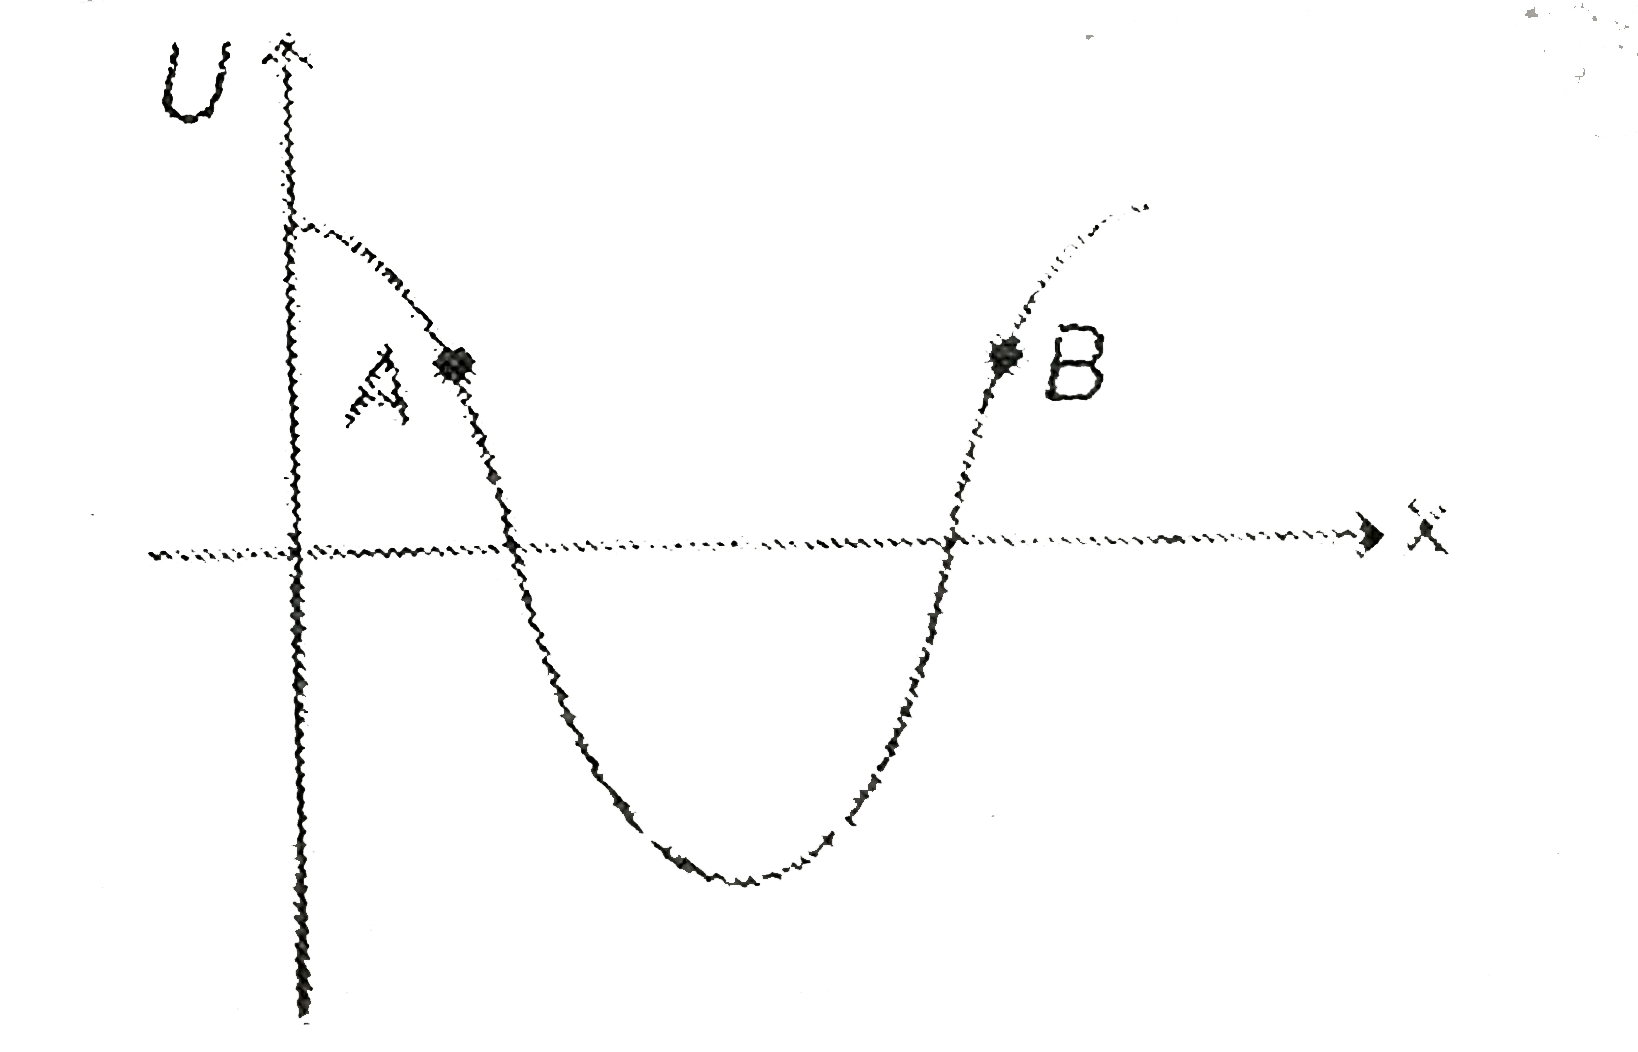
View SolutionPotential energy v/s position curve for one dimensional conservative field is shown. Force at A and B is respectively.
View SolutionThe differential equation corresponding to curve y=acos(x+b) is :
View SolutionThe differential equation corresponding to the family of curves y=ex(ax+b) is
View SolutionWhen environmental conditions are favourable, then population growth curve will be
View Solution
