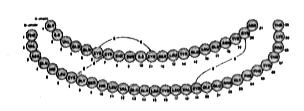
Identify 'a' and'b' in the figure given below representing proportionate number of major vertebrate taxa.
To identify 'A' and 'B' in the pie chart representing the proportionate number of major vertebrate taxa, we can follow these steps:
1. Understand the Pie Chart: The pie chart represents the proportionate number of species across different major vertebrate taxa. It includes fishes, reptiles, birds, mammals, and amphibians.
2. Identify Major Taxa: The major vertebrate taxa represented in the pie chart are:
- Fishes
- Reptiles
- Birds
- Mammals
- Amphibians
3. Analyze the Proportions: According to the information provided:
- Fishes account for approximately 26,759 species, which is the largest portion of the pie chart.
- Reptiles account for about 7,150 species.
- Birds account for around 9,700 species.
- Mammals and amphibians occupy the remaining portions of the pie chart equally.
4. Identify 'A' and 'B':
- Based on the description, 'A' represents mammals, and 'B' represents amphibians. This is because the pie chart indicates that both mammals and amphibians occupy equal portions of the chart.
5. Conclusion: Therefore, we conclude that:
- 'A' = Mammals
- 'B' = Amphibians
- Fishes
- Reptiles
- Birds
- Mammals
- Amphibians
- Fishes account for approximately 26,759 species, which is the largest portion of the pie chart.
- Reptiles account for about 7,150 species.
- Birds account for around 9,700 species.
- Mammals and amphibians occupy the remaining portions of the pie chart equally.
- Based on the description, 'A' represents mammals, and 'B' represents amphibians. This is because the pie chart indicates that both mammals and amphibians occupy equal portions of the chart.
- 'A' = Mammals
- 'B' = Amphibians
Topper's Solved these Questions
- XII BOARDSBOOK - XII BOARD PREVIOUS YEAR PAPER ENGLISHCHAPTER - XII BOARDSEXERCISE - Section B
43 Videos
- XII BOARDSBOOK - XII BOARD PREVIOUS YEAR PAPER ENGLISHCHAPTER - XII BOARDSEXERCISE - Section C
19 Videos
- XII BOARDSBOOK - XII BOARD PREVIOUS YEAR PAPER ENGLISHCHAPTER - XII BOARDSEXERCISE - DELHI BOARD- SET-III (SECTION-B)
2 Videos
- SAMPLE PAPER 2019BOOK - XII BOARD PREVIOUS YEAR PAPER ENGLISHCHAPTER - SAMPLE PAPER 2019EXERCISE - Section E Part B
3 Videos
Similar Questions
Knowledge Check
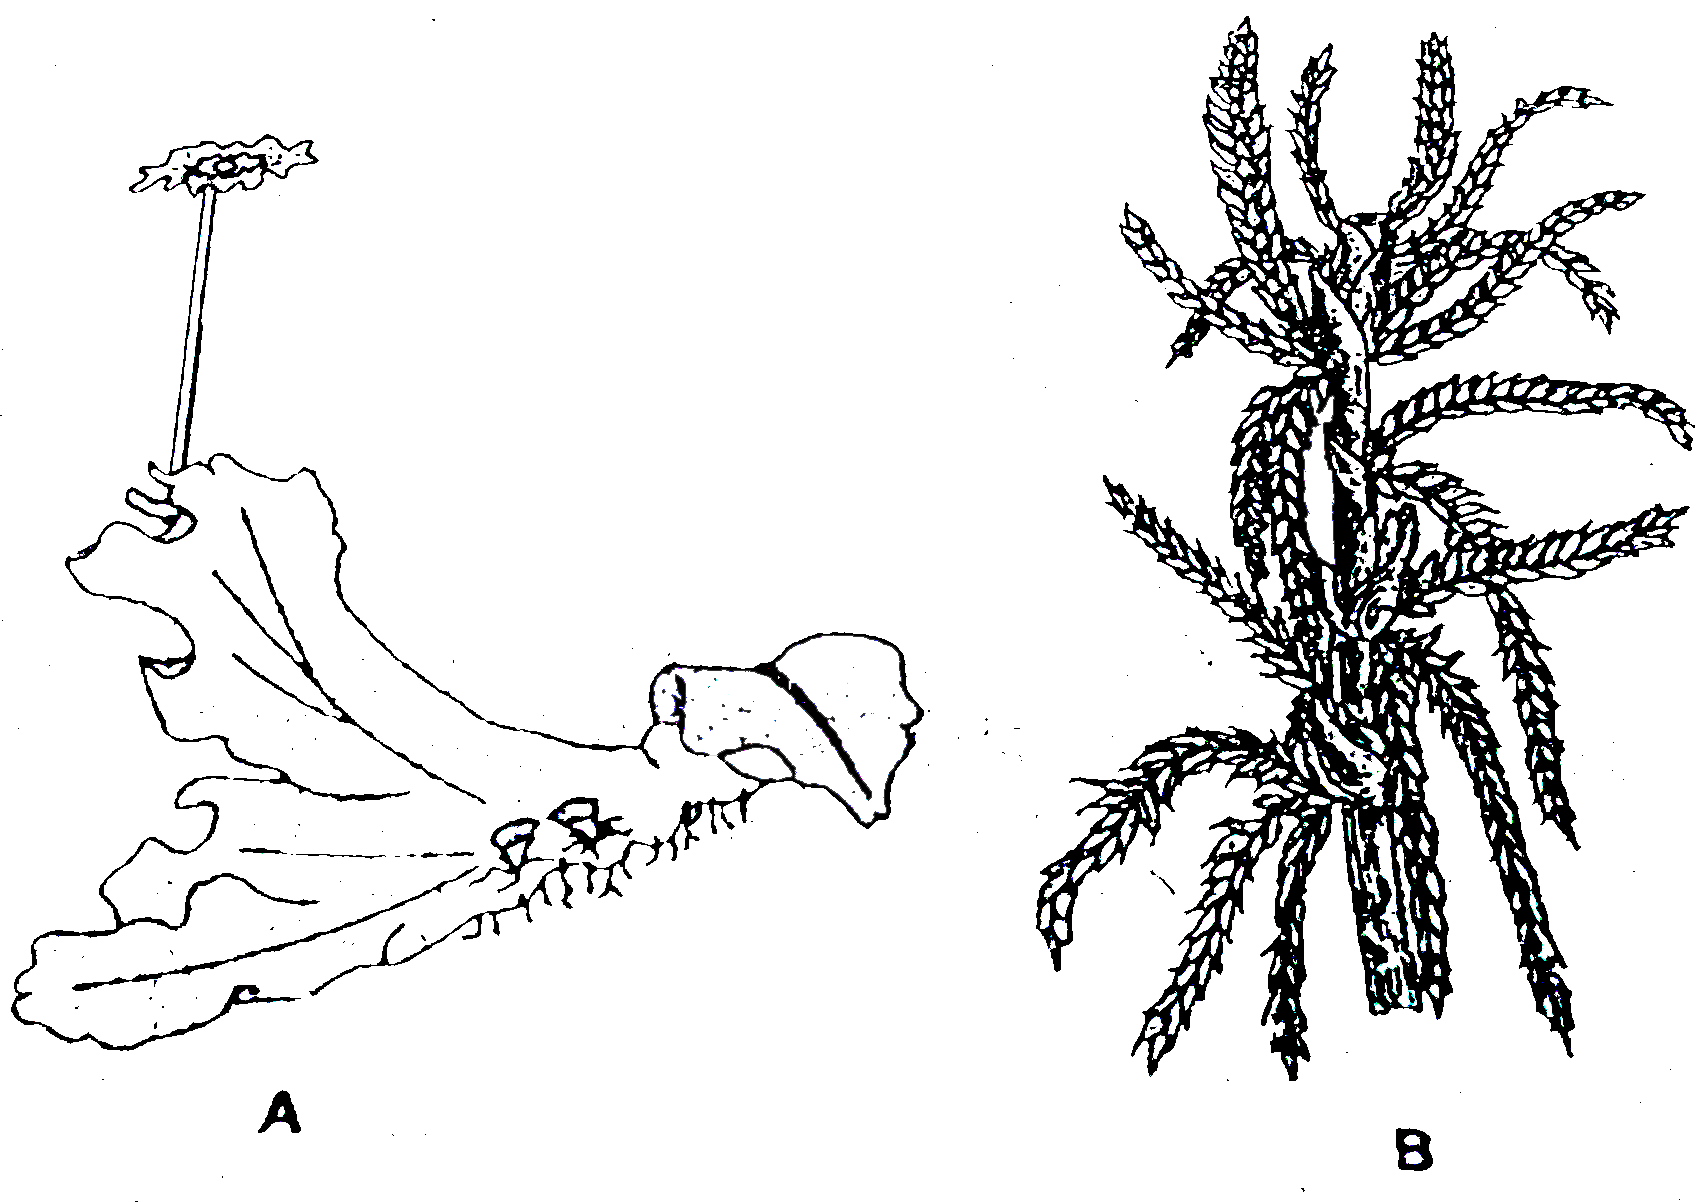
- AA - Bryophytes, B - GymnospermsBA - Fungi, B - GymnospermsCA - Fungi, B - AngiospermsDA - Algae, B - Angiosperms
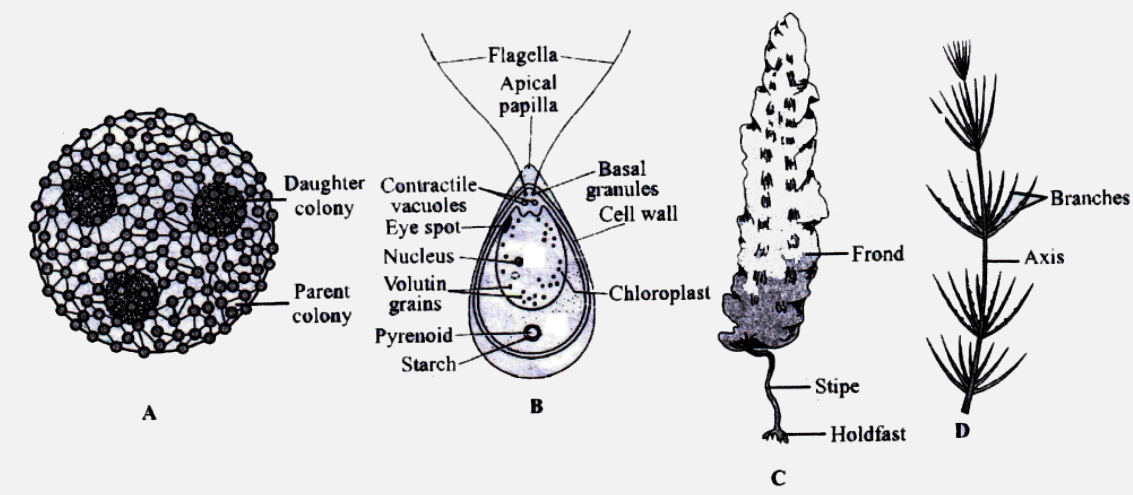
Identify the figures given below marked as A,B,C and D.
View SolutionIdentify the figure given below and the part labelled “A”.
View SolutionIdentify A, B, C, D, E and F in the table given below :

View SolutionIdentify A, B, C, D, E and F in the table given below :

View SolutionIdentify the labels A , B , C , and D in the figure given below
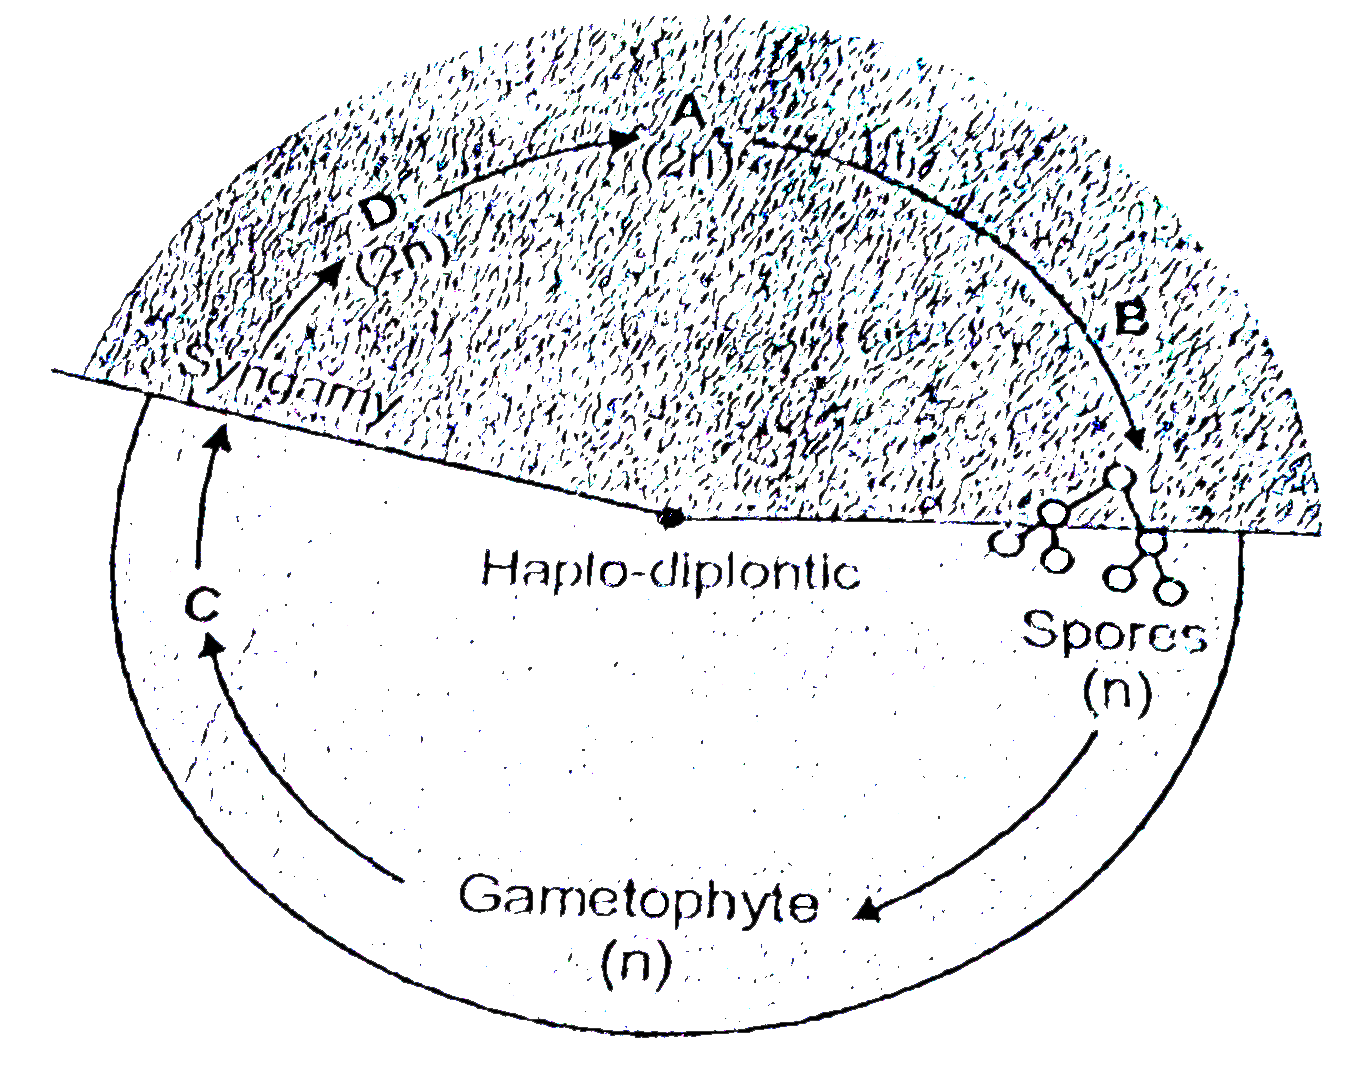
View SolutionIdentify A and B in the given figure and select the correct option.
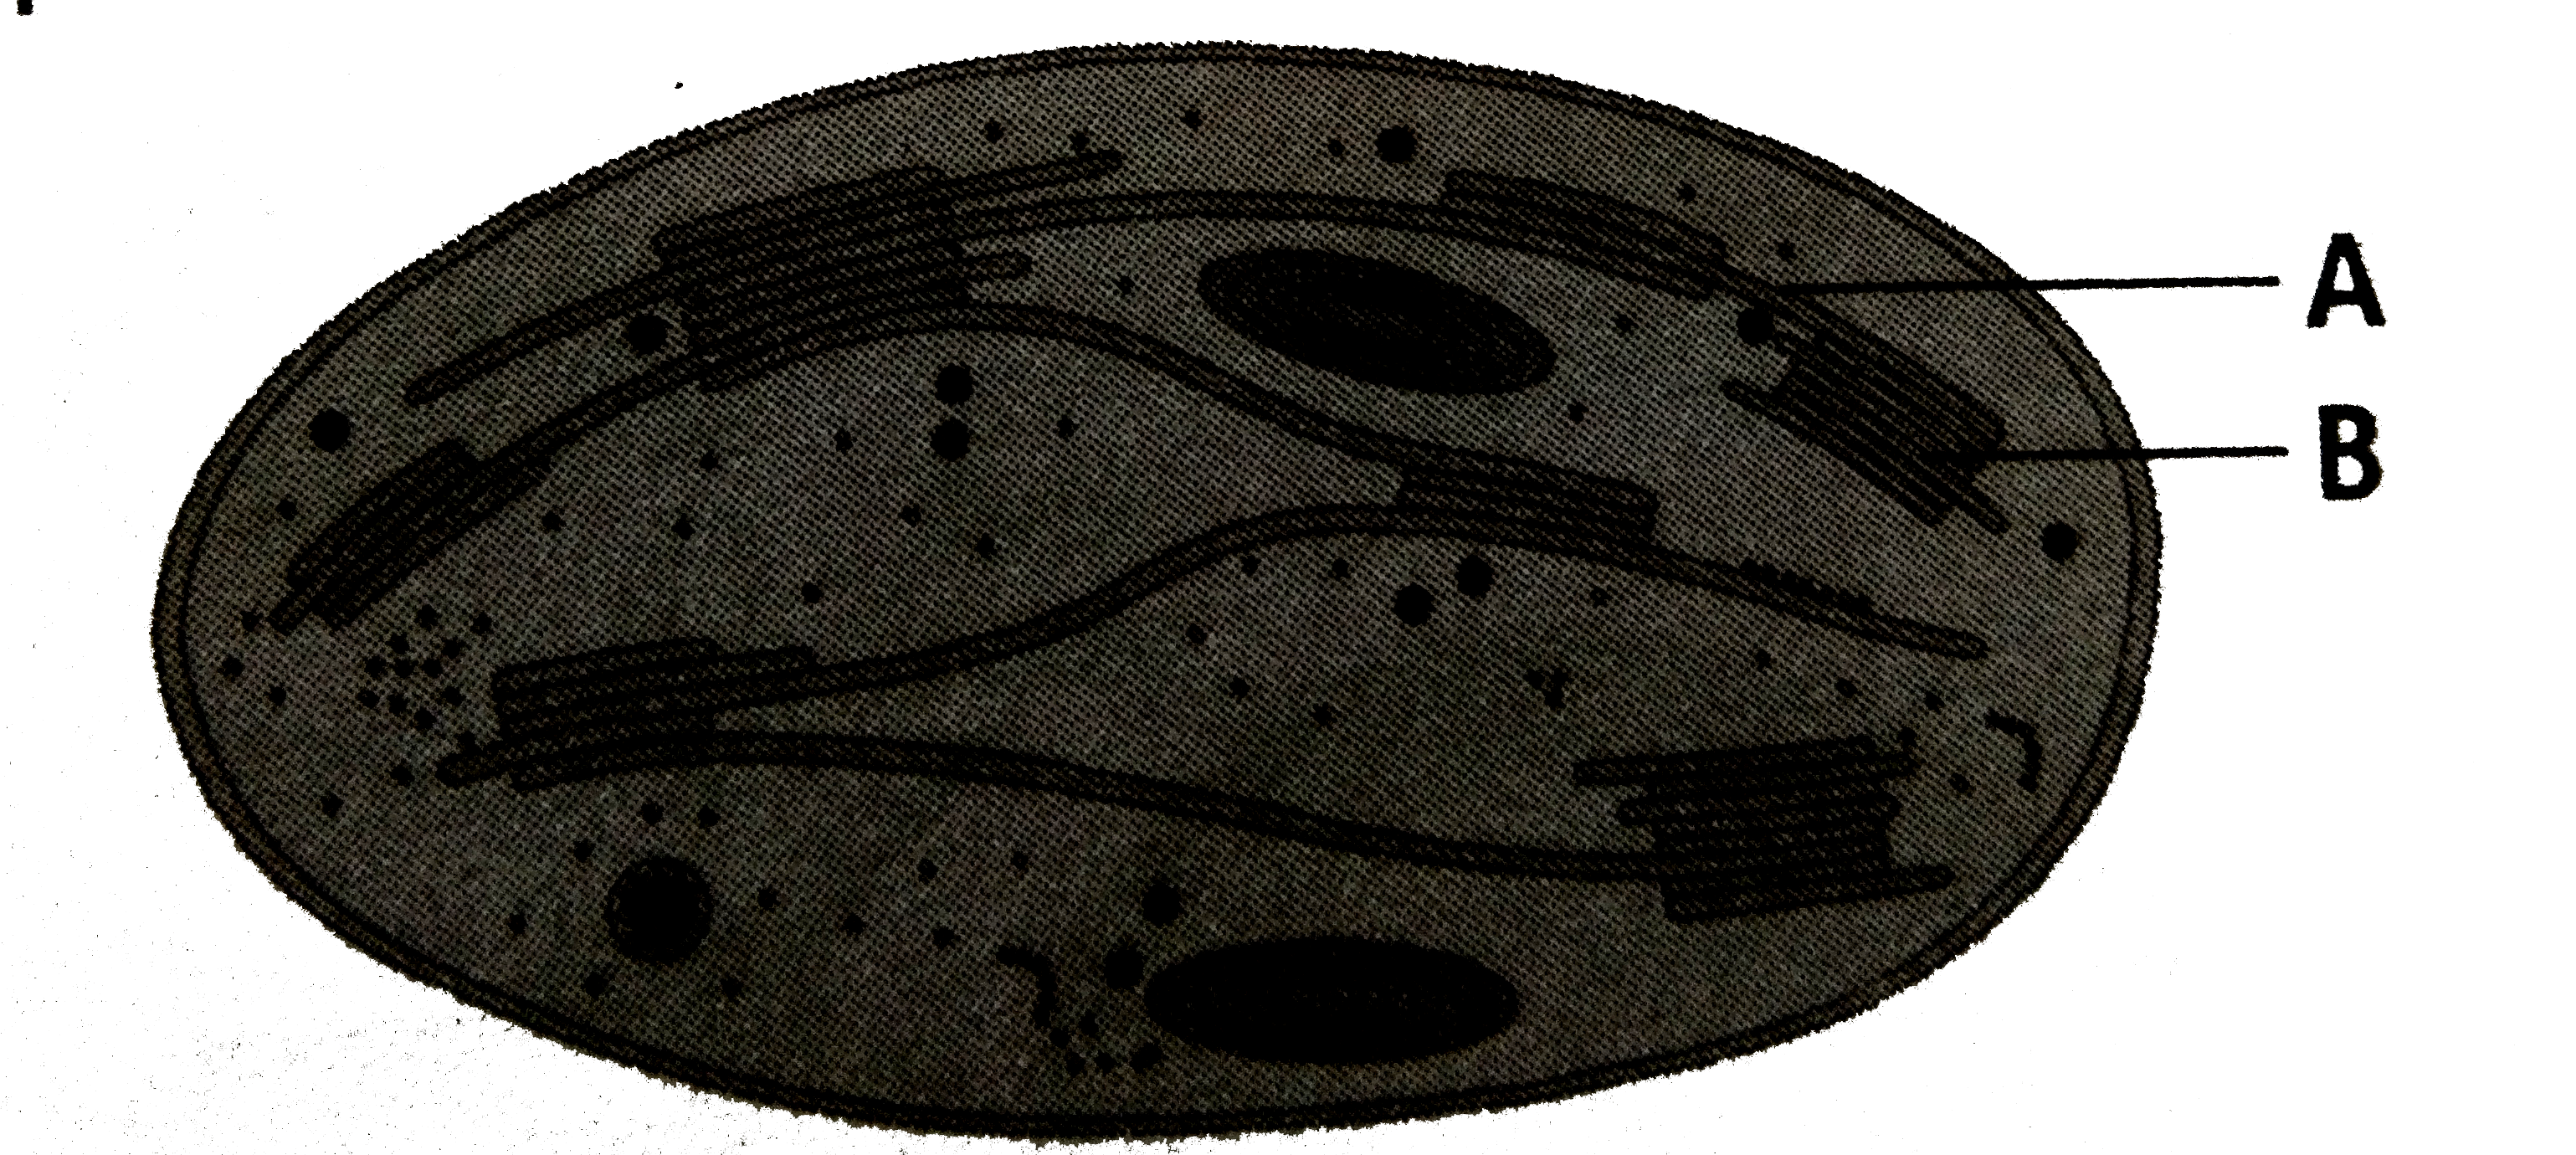
View SolutionIdentify A and B given below.
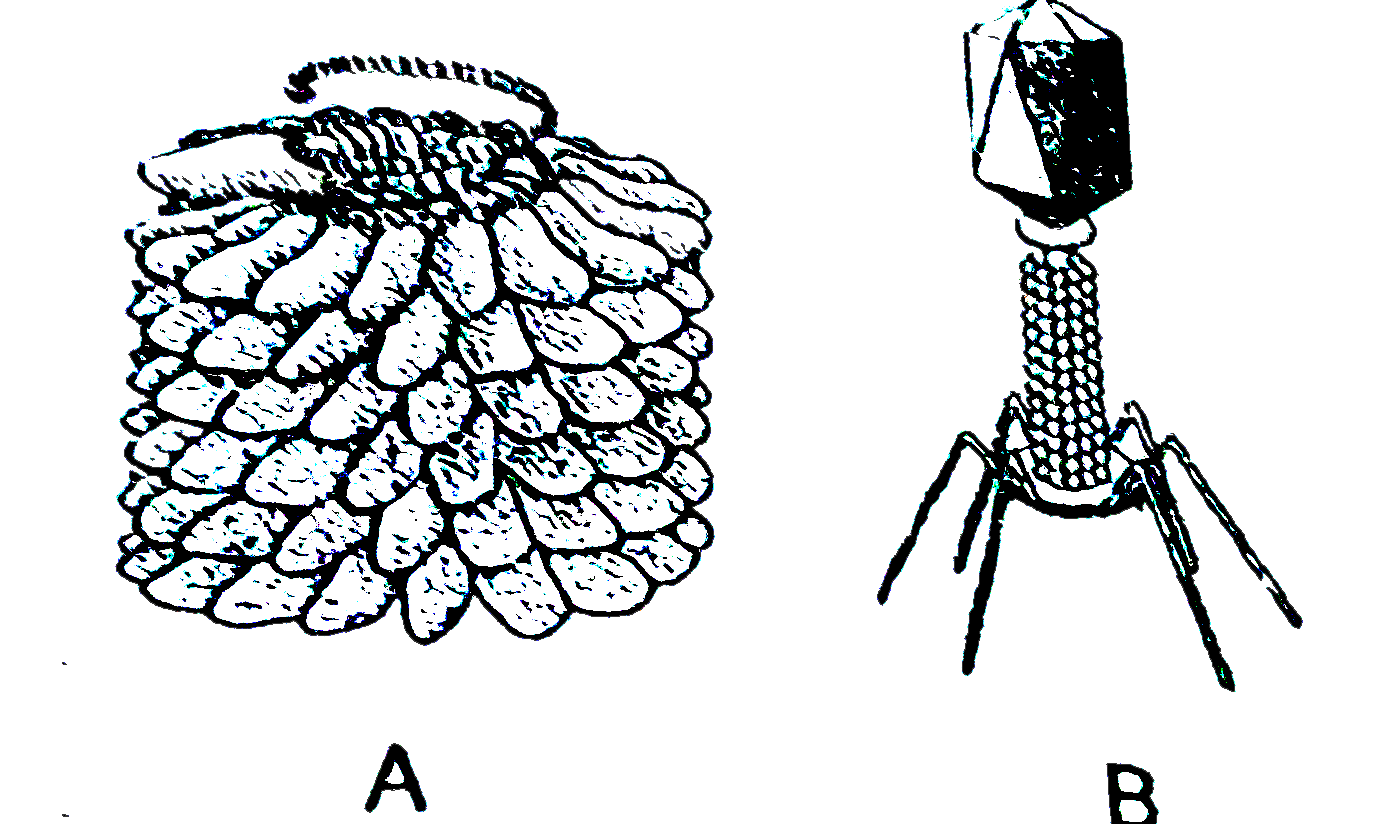
View Solution

