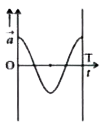
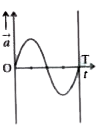
The oscillation of a body on a smooth horizontal surface is represented by the equation x=Acosωt where x = displacement at time t, ω= frequency of oscillation. Which of the following graphs shows the corrects variation of acceleration 'a' with time 't'.Solution in Gujrati


The correct Answer is:C
Here x=acosωt
velocity v=−aωsinωt and
Acceleration a=−aω2cosωt
and graph (C ) shows the change in acceleration with time.
Topper's Solved these Questions
- OSCILLATIONSBOOK - KUMAR PRAKASHANCHAPTER - OSCILLATIONSEXERCISE - SECTION-F (QUESTIONS FROM MODULE SIMPLE QUESTIONS)
20 Videos
- OSCILLATIONSBOOK - KUMAR PRAKASHANCHAPTER - OSCILLATIONSEXERCISE - QUESTION PAPER (SECTION - A)
6 Videos
- OSCILLATIONSBOOK - KUMAR PRAKASHANCHAPTER - OSCILLATIONSEXERCISE - SECTION-D (NCERT EXEMPLAR SOLUTION LONG ANSWER QUESTIONS)
8 Videos
- OBJECTIVE QUESTIONS AS PER NEW PAPER STYLE BOOK - KUMAR PRAKASHANCHAPTER - OBJECTIVE QUESTIONS AS PER NEW PAPER STYLE EXERCISE - CHAPTER - 8 (Match Type questions)
5 Videos
- PHYSICAL WORLDBOOK - KUMAR PRAKASHANCHAPTER - PHYSICAL WORLDEXERCISE - SECTION-E (QUESTIONS FROM MODULE)
9 Videos
Similar Questions
A particle executes simple harmonic motion with an amplitude A. The period of oscillation is T. The minimum time taken by the particle to travel half of the amplitude form the equilibrium position is………..
View SolutionWhat is time period of a simple pendulum in a freely falling lift ?
View SolutionA person normally weighing 50kg stands on a massless platform which oscillates up and down harmonically at a frequency of 2.0s−1 and an amplitude 5.0cm. A weighing machine on the platform gives the persons weight against time.
Will there be any change in weight of the body, during the oscillation?
View SolutionType of satellites are given in Column-I and their uses are given in Column-II. Match them properly :
Column-IColumn-II(1) Polar satellite(a) Tele communication(2) Geo-stationary satellite(b) Investigation(c) For information about atmosphere
View Solution.…. state of substance at very high temperature has generated hope of energy source for mankind.
View SolutionThe oscillation of a body on a smooth horizental surface is respresented by the equation X = A cos (omegat) where one of the following graph shown correctly the variation a with t ?
View SolutionThe oscillationof a body on a smooth horizontal surface is represented by the equation
x=Acosωt
where x= displacement at time t, ω= frequency of oscillation. Which one of the following graphs shows correctly the variation of acceleration a with time t ?
View SolutionThe oscillation of a body on a smooth horizontal surface is represented by the equation,
X=Acos(ωt)
where, X = displacement at time t
ω= frequency of oscillation
Which one of the following graphs shows correctly the variation a with t?
Here, a = acceleration at time t
T = time period
View SolutionThe oscillation of a body on a smooth horizontal surface is represented by the equation, X=Acos(ωt)
where X = displacement at time t
ω = frequency of oscillation
Which one of the following graphs shows correctly the variation a with t ?
View SolutionThe equation of displacement of a harmonic oscillator is x = 3sin omega t +4 cos omega t amplitude is
View SolutionThe displacement of an oscillator is given by x=a sin omega t+b cos omega t where a, b and omega , are constant. Then -
View Solutionएक चिकने क्षैतिज तल पर किसी पिण्ड के दोलन निम्न सूत्र द्वारा प्रदर्शित हैं : x=Acosωt, जहाँ x किसी क्षण t पर विस्थापन तथा ω दोलनों की आवृत्ति है | त्वरण a तथा समय t के बीच ग्राफ होगा :
View SolutionThe oscillation of a body on a smooth horizontal surface is represented by the equation,
X=Acos(ωt)
where X= displacement at time t
ω = frequency of oscillation.
Which one of the following graph shows correctly the variation a with ?
View SolutionA simple harmonic motion is represented by x(t) = sin^(2)omega t - 2 cos^(2) omega t . The angular frequency of oscillation is given by
View SolutionThe oscillation of a body on a smooth horizontal surface is represented by the equation, x=Acosomegat , where x = displacement at time t, omega = frequency of oscillation. Which one of the following graphs shows correctly the variation a with t ? Here, a = acceleration at time t and T = time period.
View Solution
