V-1 graph for a conductor is as shown in figure.

(i) What do you infer from this graph ?
(ii) State the law exprased here.
Name the physical quantity repraented by the slope of this graph and state its SI unitSolution in Kannada
(i) Inference drawn is that V α I
(ii) The states that the current passing through a Law conductor is directly proportional to the potential difference across Its ends, provided the physical conditions like temperature, density, etc, remain unchanged. This is ohm.s law.
(iii) Slope of the graph represent : Resistance, unit is ohm.
Topper's Solved these Questions
- ELECTRICITYBOOK - OSWAAL PUBLICATIONCHAPTER - ELECTRICITYEXERCISE - TOPIC-2 ( Long Answer Type Questions )
29 Videos
- ELECTRICITYBOOK - OSWAAL PUBLICATIONCHAPTER - ELECTRICITYEXERCISE - NCERT CORNER ( Intext Questions )
23 Videos
- ELECTRICITYBOOK - OSWAAL PUBLICATIONCHAPTER - ELECTRICITYEXERCISE - TOPIC-2 ( Short Answer Type Questions -I )
15 Videos
- LIGHT-REFLECTION AND REFRACTIONBOOK - OSWAAL PUBLICATIONCHAPTER - LIGHT-REFLECTION AND REFRACTIONEXERCISE - NCERT CORNER (TEXTBOOK EXERCISES)
15 Videos
Similar Questions
What is meant by electric current ? Name and define S.I. unil In a conductor electrons are flowing from B to A. What is the direction of conventional current ? Give justification for your answer. A steady current of 1 Ampere flows through a conductor. Calculate the number of electrons that flow through any section of conductor In 1 second. (Charge on electron 1.6×10⁻¹⁹C)
View SolutionWhat does an electric circuit mean ?
View SolutionA potential difference of 220 V is applied across a resistance of 440 Ω in an electrical appliance. Calculate the current drawn and heat energy produced in 20 seconds.
View SolutionWhich one of the following materials cannot be used ot make a lens?
View SolutionThe velocity time graphs of two bodies A and B are shown in Figure. Observe these graphs carefully and answer the following questions :
(i) From the shape of graphs, what is nature of motion of A and B
(ii) What do you infer from the slopes of the graphs ?
(iii) What are the initial velocities of A and B ?
(iv) What is acceleration of A ?
(v) What is acceleration of B ?
(vi) What distance is travelled by B before coming to rest ?
(vii) At what time will the two bodies have equal velocity ?

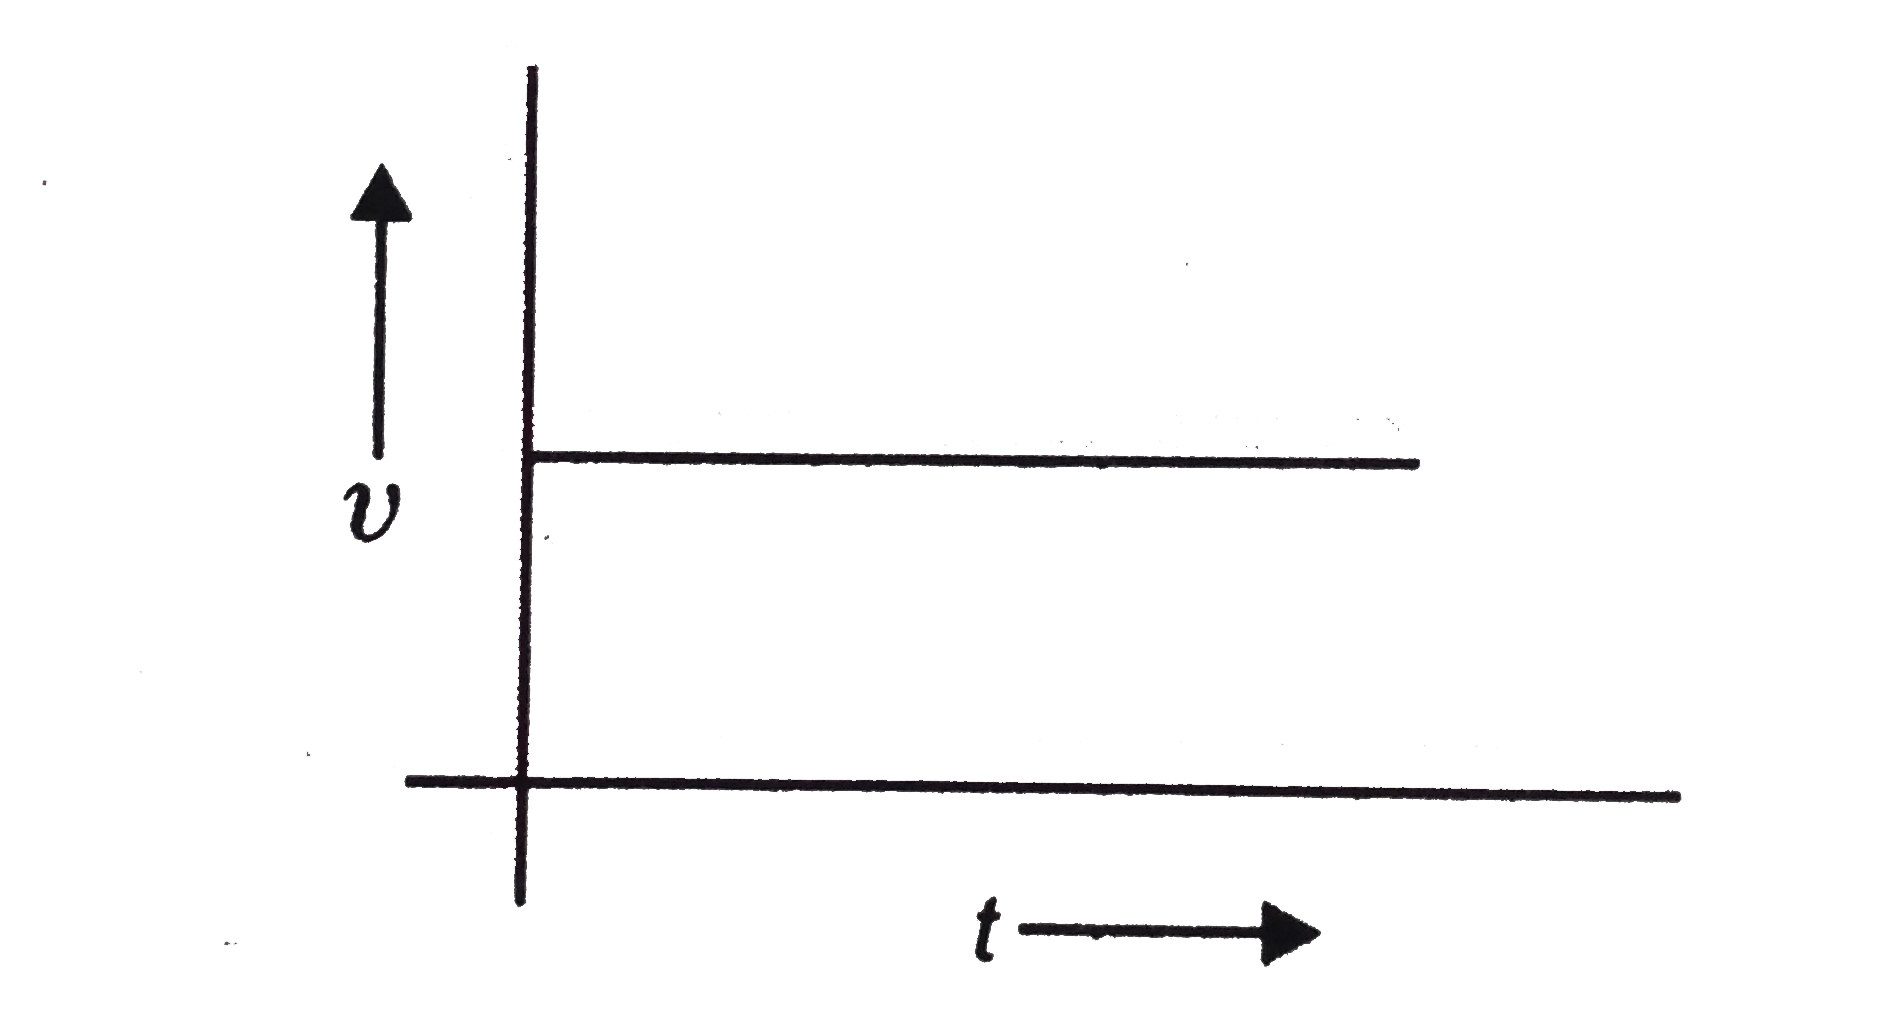
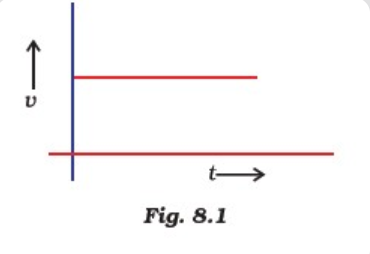
View SolutionFrom the given v−t graph (Figure), it can be inferred that the object is

View SolutionThe V - i graph for a conductor at temperature T_(1) and T_(2) are as shown in the figure. ( T_(2) - T_(1)) is proportional to
View SolutionFrom the given v-t graph (see figure), it can be inferred that the object is

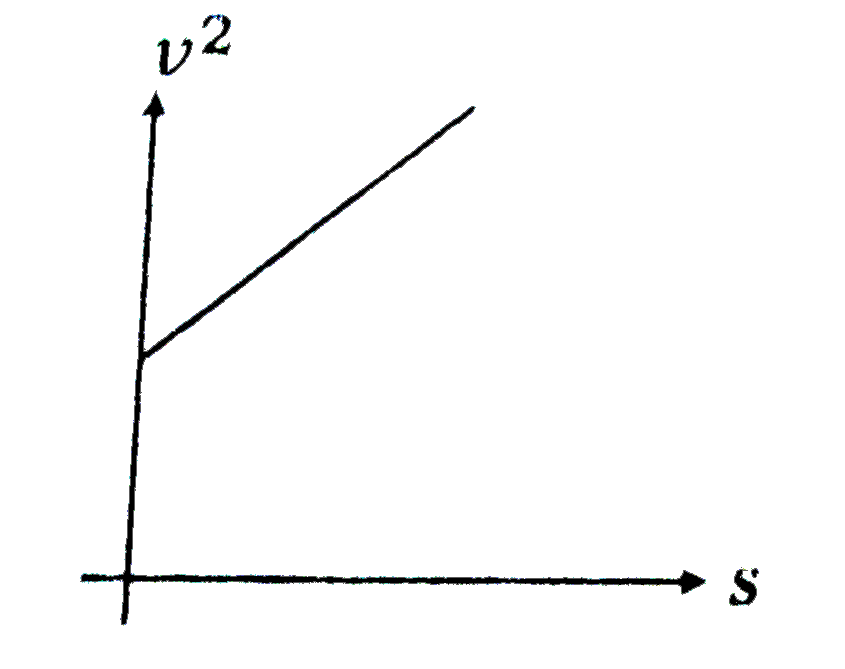
View Solutionv^(2) versus s-graph of a particle moving in a straight line is shown in the figure. From the graph some conculsions are drawn. State which statement is wrong ?
View SolutionDraw I-V graph for a conductor. What does the slope represent ?
View Solutionधात्वीय चालक के लिए विभवांतर V और धारा I के बीच खींचा गया ग्राफ किस भौतिक राशि की भविष्यवाणी करता है? इसका SI मात्रक लिखिए।
View SolutionThe V – I graph for a wire of copper of length L and cross -section area A is shown in the figure below . The slope of the graph will be
View Solutionगोलीय दर्पण के लिए (i) u−v ग्राफ तथा (ii) 1u व 1v ग्राफ की आकृति बताइए।
View SolutionFrom the given v-t graph (see figure), it can be inferred that the object is

View Solutionv2 versus s-graph of a particle moving in a straight line is shown in the figure. From the graph some conculsions are drawn. State which statement is wrong ?

View Solution
