(A): Plotting the acceleration-time graph from a given position time graph a particle moving along a straight line is possible.
(R): From position time graph sign of acceleration can not be determined.Solution in Telugu
Both (A) and (R) are true and (R) is the correct explanation of (A)
Both (A) and (R) are true and (R) is not the correct explanation of (A)
(A) is true but (R) is false
Both (A) and (R) are fals
The correct Answer is:C
Step by step video, text & image solution for (A): Plotting the acceleration-time graph from a given position time graph a particle moving along a straight line is possible. (R): From position time graph sign of acceleration can not be determined. by Physics experts to help you in doubts & scoring excellent marks in Class 12 exams.
Updated on:21/07/2023Topper's Solved these Questions
- MOTION IN A PLANEBOOK - AAKASH SERIESCHAPTER - MOTION IN A PLANEEXERCISE - EXERCISE-2 (Addition, Subtraction and Resolution)
29 Videos
- MOTION IN A PLANEBOOK - AAKASH SERIESCHAPTER - MOTION IN A PLANEEXERCISE - EXERCISE-2 (Lami.s theorem :)
8 Videos
- MOTION IN A PLANEBOOK - AAKASH SERIESCHAPTER - MOTION IN A PLANEEXERCISE - EXERCISE-IB (Projectile motion)
15 Videos
- MAGNETISMBOOK - AAKASH SERIESCHAPTER - MAGNETISMEXERCISE - PROBLEMS (LEVEL-II)
13 Videos
- MOTION IN A PLANEBOOK - AAKASH SERIESCHAPTER - MOTION IN A PLANEEXERCISE - QUESTION FOR DESCRIPTIVE ANSWER
7 Videos
Similar Questions
A person runs along a circular path of radius 5 m. If he completes half of the circle find the magnitude of the displacement vector, How far the person ran ?
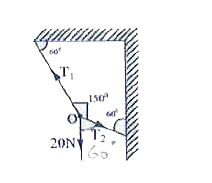
View SolutionIf 'O' is at equilibrium then the values of the tension T1andT2 are x, y, if 20 N is vertically down. Then x, y are
View Solution(A): The horizontal displacement of a projectile varies linearly with time.
(R) : Projectile motion is uniform motion along horizontal direction.
View SolutionThe force between the two poles is reduced to 'x' newtons when their separation is increased n times. It is increased by 'y' newtons when their separation is made 1/nth of their original value. What is the relation between x and y?
View SolutionA particle is projected over a triangle from one end of a horizontal base and garzing the vertex falls on the other end of the base . If α and β the base angles and θ the angle of projection then show that tanθ=tanα+tanβ.
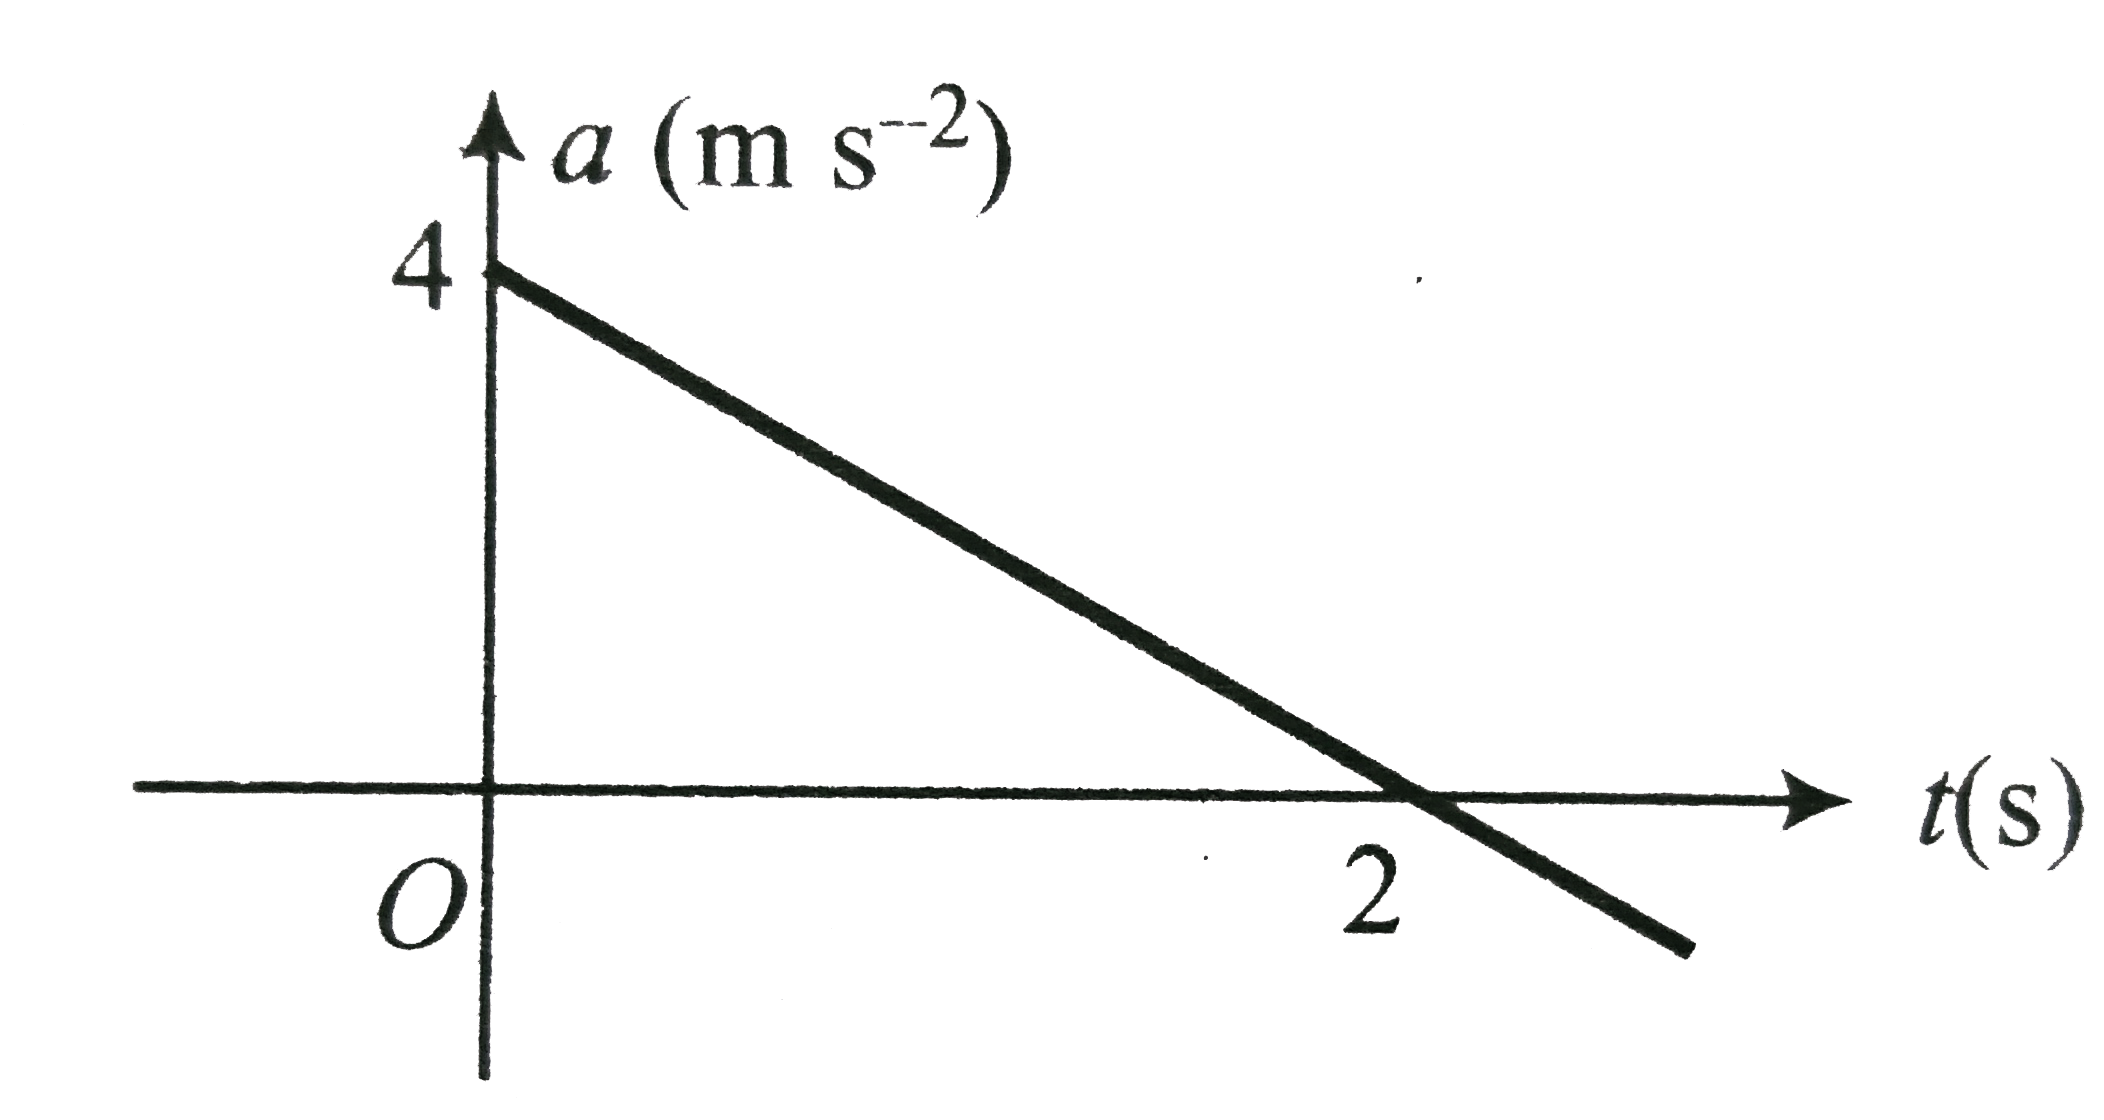
View SolutionThe acceleration versus time graph of a particle moving in a straight line is show in figure. The velocity-time graph of the particle would be
 .
.
View SolutionThe acceleration-time graph of a particle moving along a straight line is as shown in. At what time the particle acquires its initial velocity? .
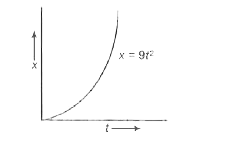
View SolutionA particle is moving along the x-axis and its position-time graph is shown. Determine the sign of acceleration.
View SolutionA particle is moving in a straight line according to graph given below : (a is acceleration, v is velocity, x is position, t is time) :
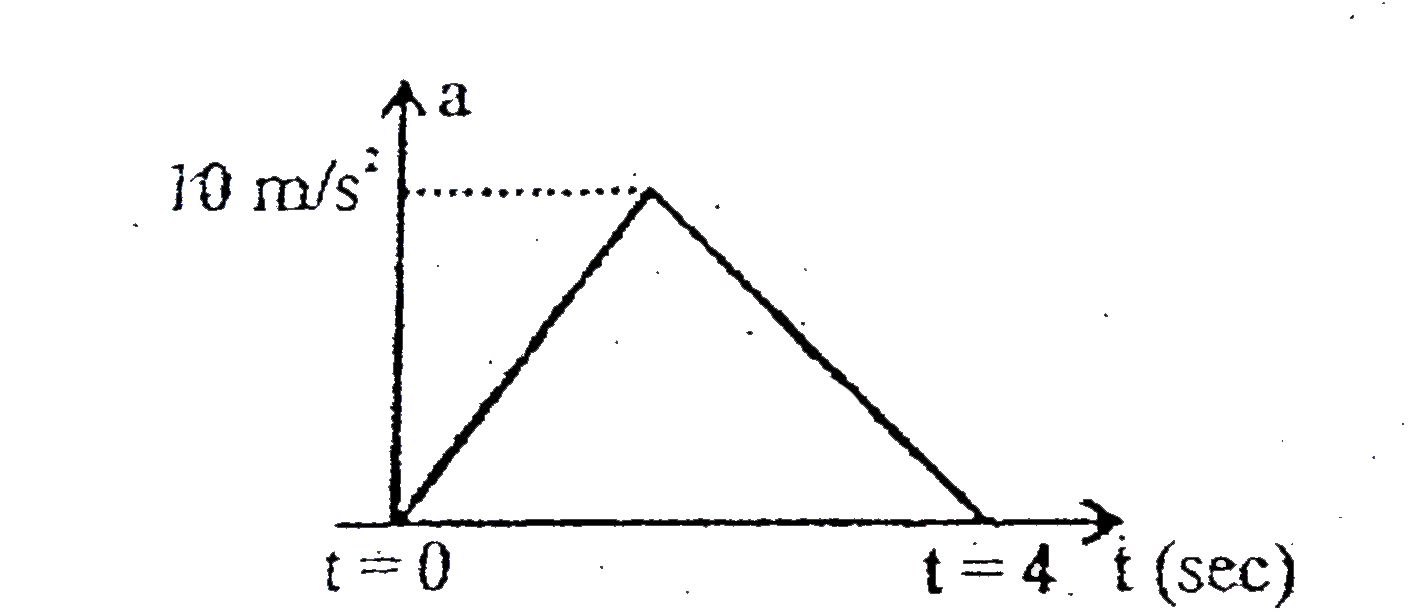
View SolutionAcceleration time graph of a particle moving along a straight line is given. Then average acceleration between t=0 & t=4 is :−
View SolutionA : The area under acceleration - time graph is equal to velocity of object. R : For an object moving with constant acceleration, position - time graph is a straight line.
View Solutionएक सरल रेखा में गति करते हुए कण का विस्थापन-समय ग्राफ चित्र में दर्शाया गया है।
इस कण का त्वरण-समय ग्राफ है
View Solutionएक कण के लिये वेग-समय और त्वरण-समय ग्राफ दिये गये हैं
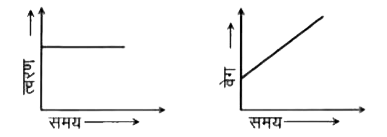
तब, कण का स्थिति-समय ग्राफ निम्न में से है
View SolutionThe acceleration - time graph of a particle moving along a straight line ( starting from rest) is shown. After what time the particle attins its initial position ?
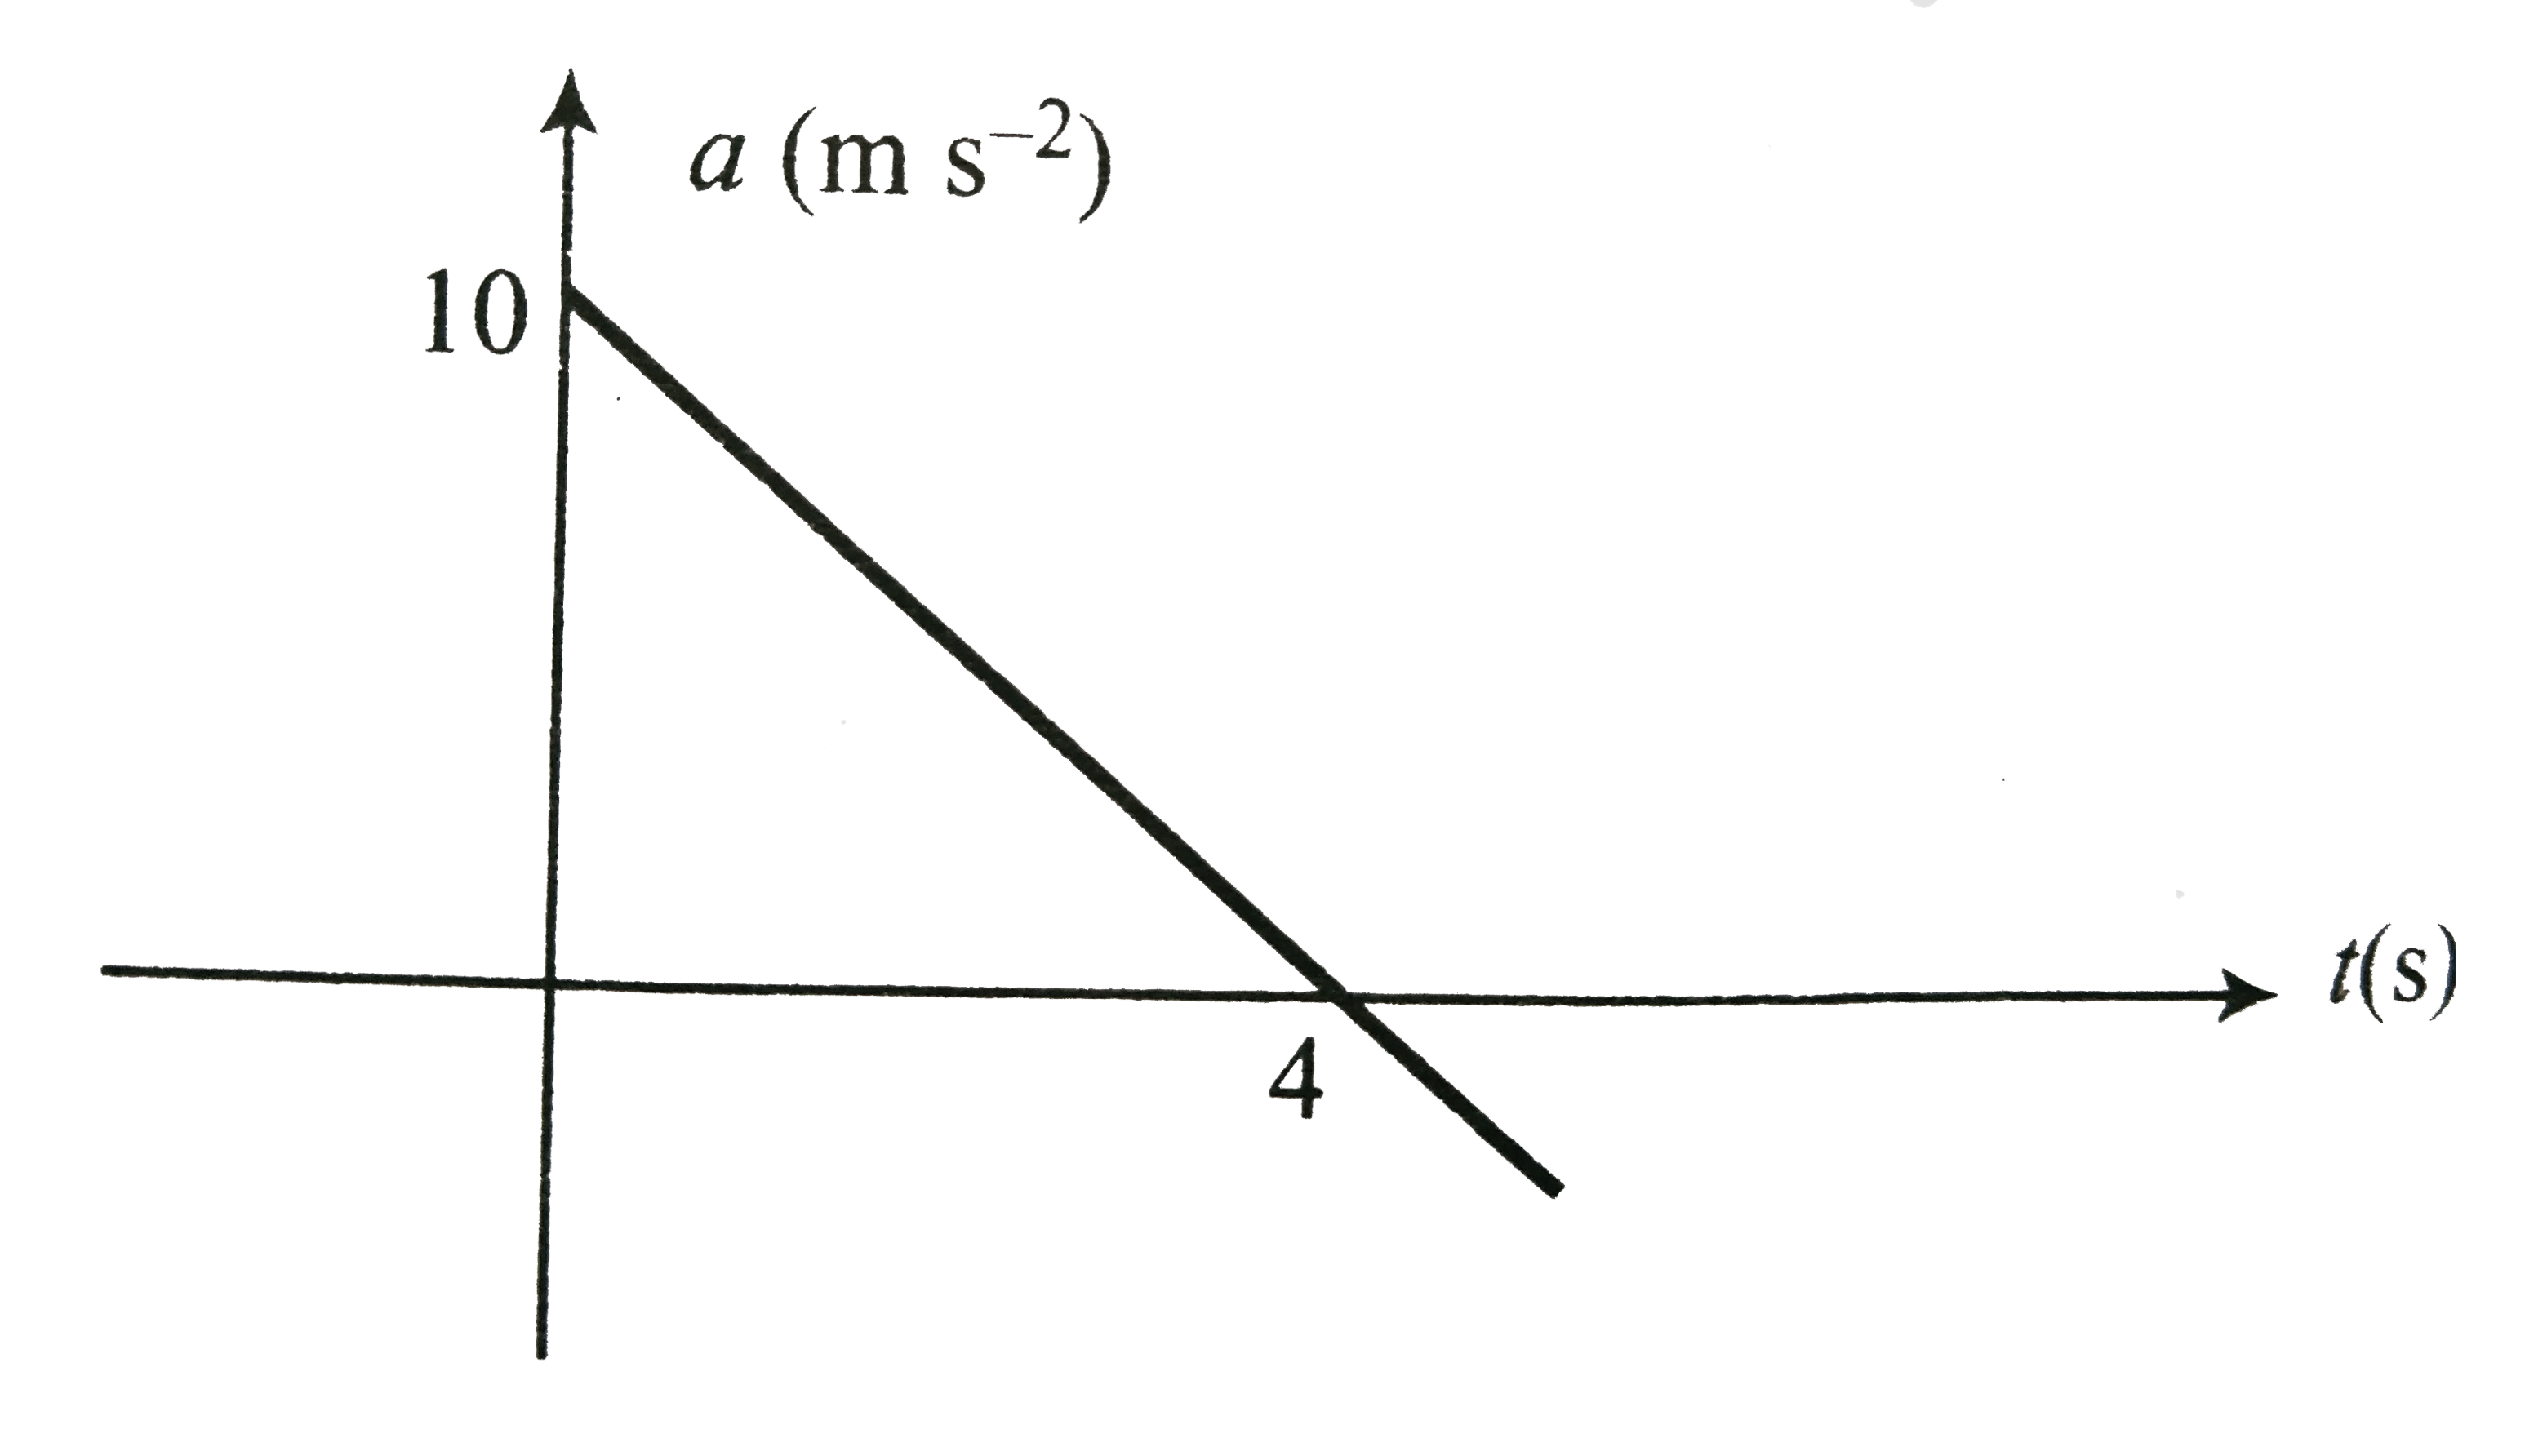
View SolutionThe acceleration-time graph of a particle moving along a straight line is as shown in. At what time the particle acquires its initial velocity?
 .
.
View Solution
