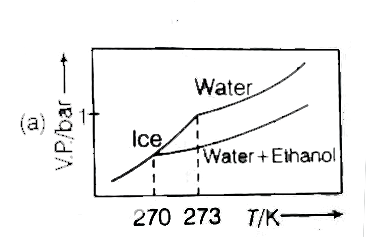
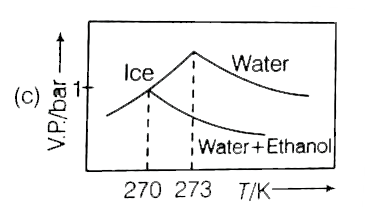
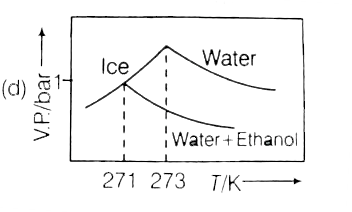
Pure water freezes at 273 K and 1 bar. The addition of 34.5 g of ethanol to 500 g of water changes the freezing point of the solution. Use the freezing point depression constant of water as 2 K kgmol−1. The figures shown below represent plots of vapour pressure (V.P.) versus temperature (T). [molecular weight of ethanol is46gmol−1 Among the following, the option representing change in the freezing point is


The correct Answer is:B
As T increase , the vapour pressure increases.
Therefore , options (a) and (d) are not correct.
ΔTf=kf×wB×1000MB×wB
=2×34.5×100046×500=3K
ΔTf=273(K)−Tf=3K
ΔTf=273(K)−Tf=3K
or Tf=273−3=270K
Therefore , option (b) is correct .
Topper's Solved these Questions
- SOLUTIONSBOOK - MODERN PUBLICATIONCHAPTER - SOLUTIONSEXERCISE - COMPETITION FILE (C. MULTIPLE CHOICE QUESTIONS(MCQ))
10 Videos
- SOLUTIONSBOOK - MODERN PUBLICATIONCHAPTER - SOLUTIONSEXERCISE - COMPETITION FILE (D. MULTIPLE CHOICE QUESTIONS(MCQ))
13 Videos
- SOLUTIONSBOOK - MODERN PUBLICATIONCHAPTER - SOLUTIONSEXERCISE - COMPETITION FILE (A. MULTIPLE CHOICE QUESTIONS(MCQ))
26 Videos
- SOLID STATEBOOK - MODERN PUBLICATIONCHAPTER - SOLID STATEEXERCISE - UNIT PRACTICE TEST
13 Videos
- SURFACE CHEMISTRYBOOK - MODERN PUBLICATIONCHAPTER - SURFACE CHEMISTRYEXERCISE - COMPETITION FILE (OBJECTIVE TYPE QUESTIONS) (MATCHING LIST TYPE QUESTIONS)
2 Videos
Similar Questions
1.0gof a non-electrolyte solute (molar mass250gmol−1 was dissolved in 51.2 g of benzene. If the freezing point depression constant of benzene is 5.12Kkgmol−1 the lowering in freezing point will be
View SolutionThe freezing point of an aqueous solutions is 272 .93 K .
Calculate the molality of the solution if molal depression constant for water is 1.86 Kg mol−1
View Solution
Knowledge Check
Pure water freezes at 273K and 1 bar. The addition of 34.5g of ethanol to 500g of water changes the freezing point of the solution. Use the freezing point depression contant of water as 2Kkgmol−1. The figures shown below represent polts of vapour (V.P.) versus temperature (T). [Molecular weight of ethanol is 46gmol−1]
Among the following, the option representing change in the freezing point isA B
B C
C D
D
Pure water freezes at 273 K and 1 bar. The addition of 34.5 g of ethanol to 500 g of water changes the freezing point of the solution. Use the freezing point depression constant of water as 2 K kgmol−1. The figures shown below represent plots of vapour pressure (V.P.) versus temperature (T). [molecular weight of ethanol is46gmol−1 Among the following, the option representing change in the freezing point is
A B
B C
C D
D
Pure water freezes at 273 K and 1 bar. The addition of 34.5g of ethanol to 500g of water changes the freeing point of the solution. Use of f.p. depression constant of water as 2Kg mol−1. The figures shown below represents plot of vapour pressure (V.P.) versus temperature (T) (mol wt. of ethanol =46 g mol−1). Among the following the option representing change in the f.p. is
A B
B C
C D
D
How much amount of NaCl should be added to 600 g fo water (φ=1.00g/mL) to decrease freezing point of water to −0.2∘C? ___________________. (The freezing point depression constant for water =2Kkgmol−1)
View SolutionThe observed depression in the freezing point of water for a perticular solution is 0.087 K . Calculate the molality of the solution if molal depression constant for water is 1.86 K kg mol−1
View SolutionHow much amount of NaCl should be added to 600 g fo water (φ=1.00g/mL) to decrease freezing point of water to −0.2∘C? ___________________. (The freezing point depression constant for water =2Kkgmol−1)
View Solution45 g of ethylene glycol (C2H6O2) is mixed with 600 g of water. The freezing point of the solution is (Kf for water is 1.86 K kg mol−1 )
View SolutionA solution containing 8.0g of nicotine in 92g of water-frezes 0.925 degrees below the normal freezing point of water. If the freezing point depression constant Kf=−1.85∘Cmol−1 then the molar mass of nicotine is -
View Solution
