Two stones are thrown up simultaneously from the edge of a cliff high with initial speed of respectively . Which of the following graph best represents the time variation of relative position of the speed stone with respect to the first ?
( Assume stones do not rebound after hitting the groumd and neglect air resistance , take
( The figure are schematic and not drawn to scale )


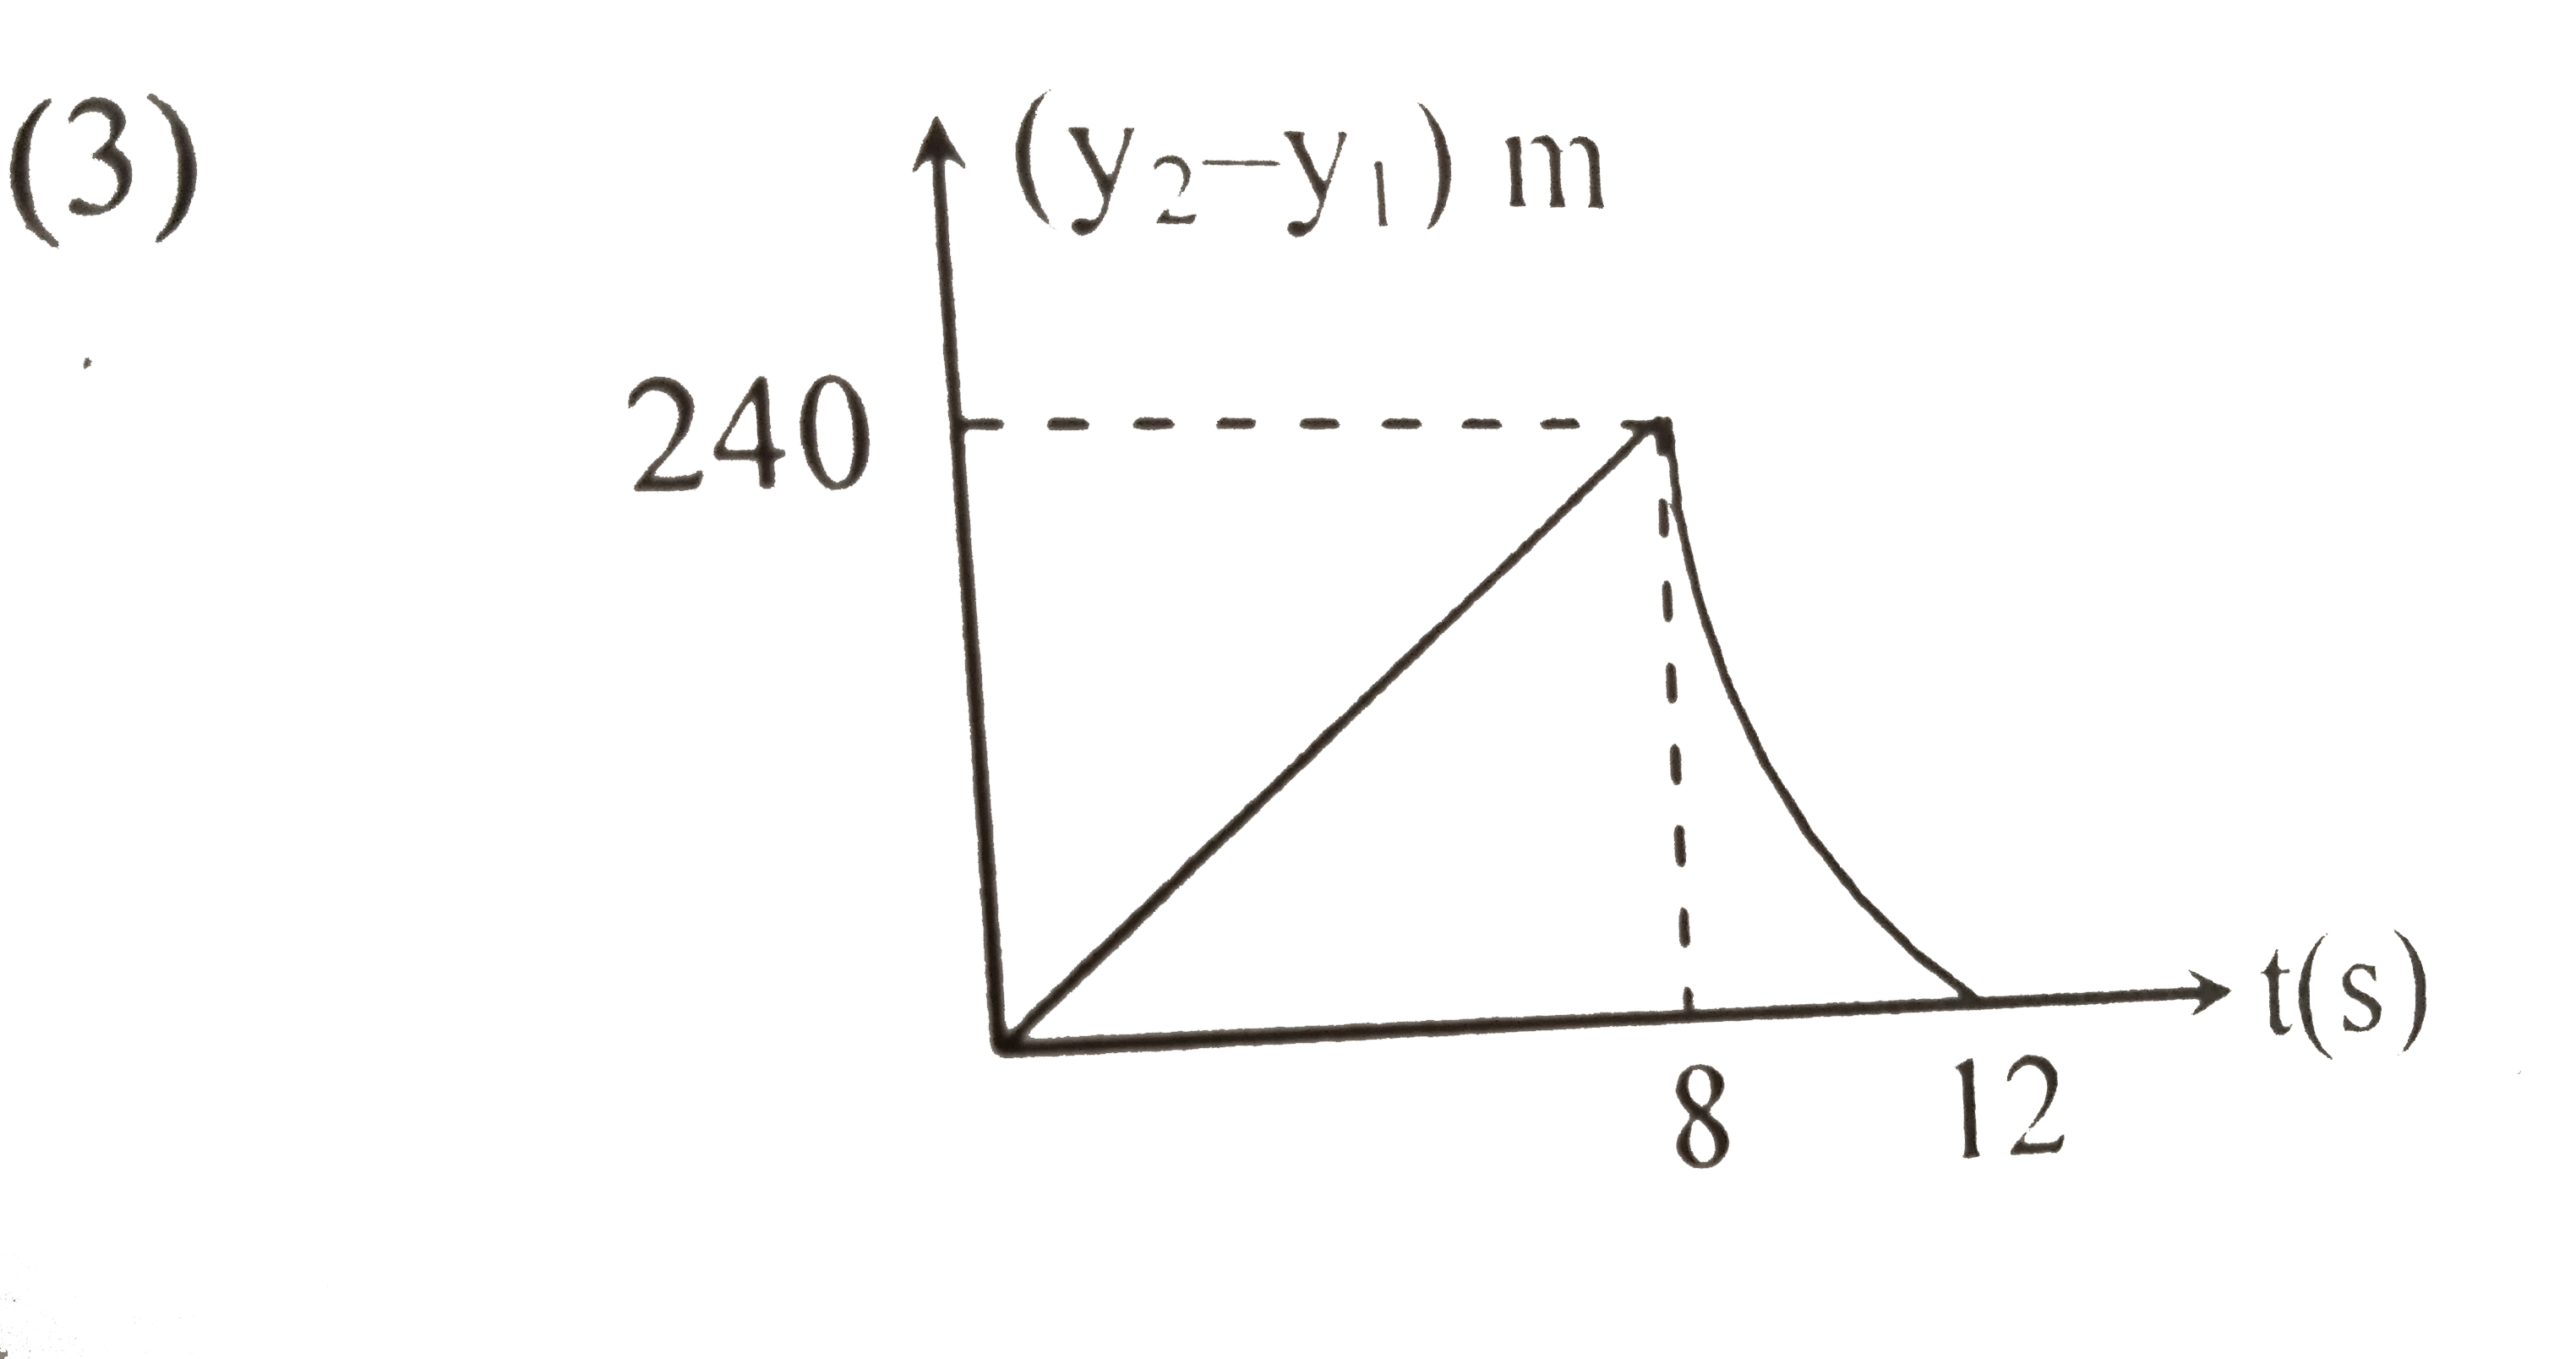

The correct Answer is:B
Step by step video, text & image solution for Two stones are thrown up simultaneously from the edge of a cliff 240 m high with initial speed of 10 m//s and 40 m//s respectively . Which of the following graph best represents the time variation of relative position of the speed stone with respect to the first ? ( Assume stones do not rebound after hitting the groumd and neglect air resistance , take g = 10 m//s^(2)) ( The figure are schematic and not drawn to scale ) by Physics experts to help you in doubts & scoring excellent marks in Class 12 exams.
Updated on:21/07/2023Topper's Solved these Questions
Similar Questions
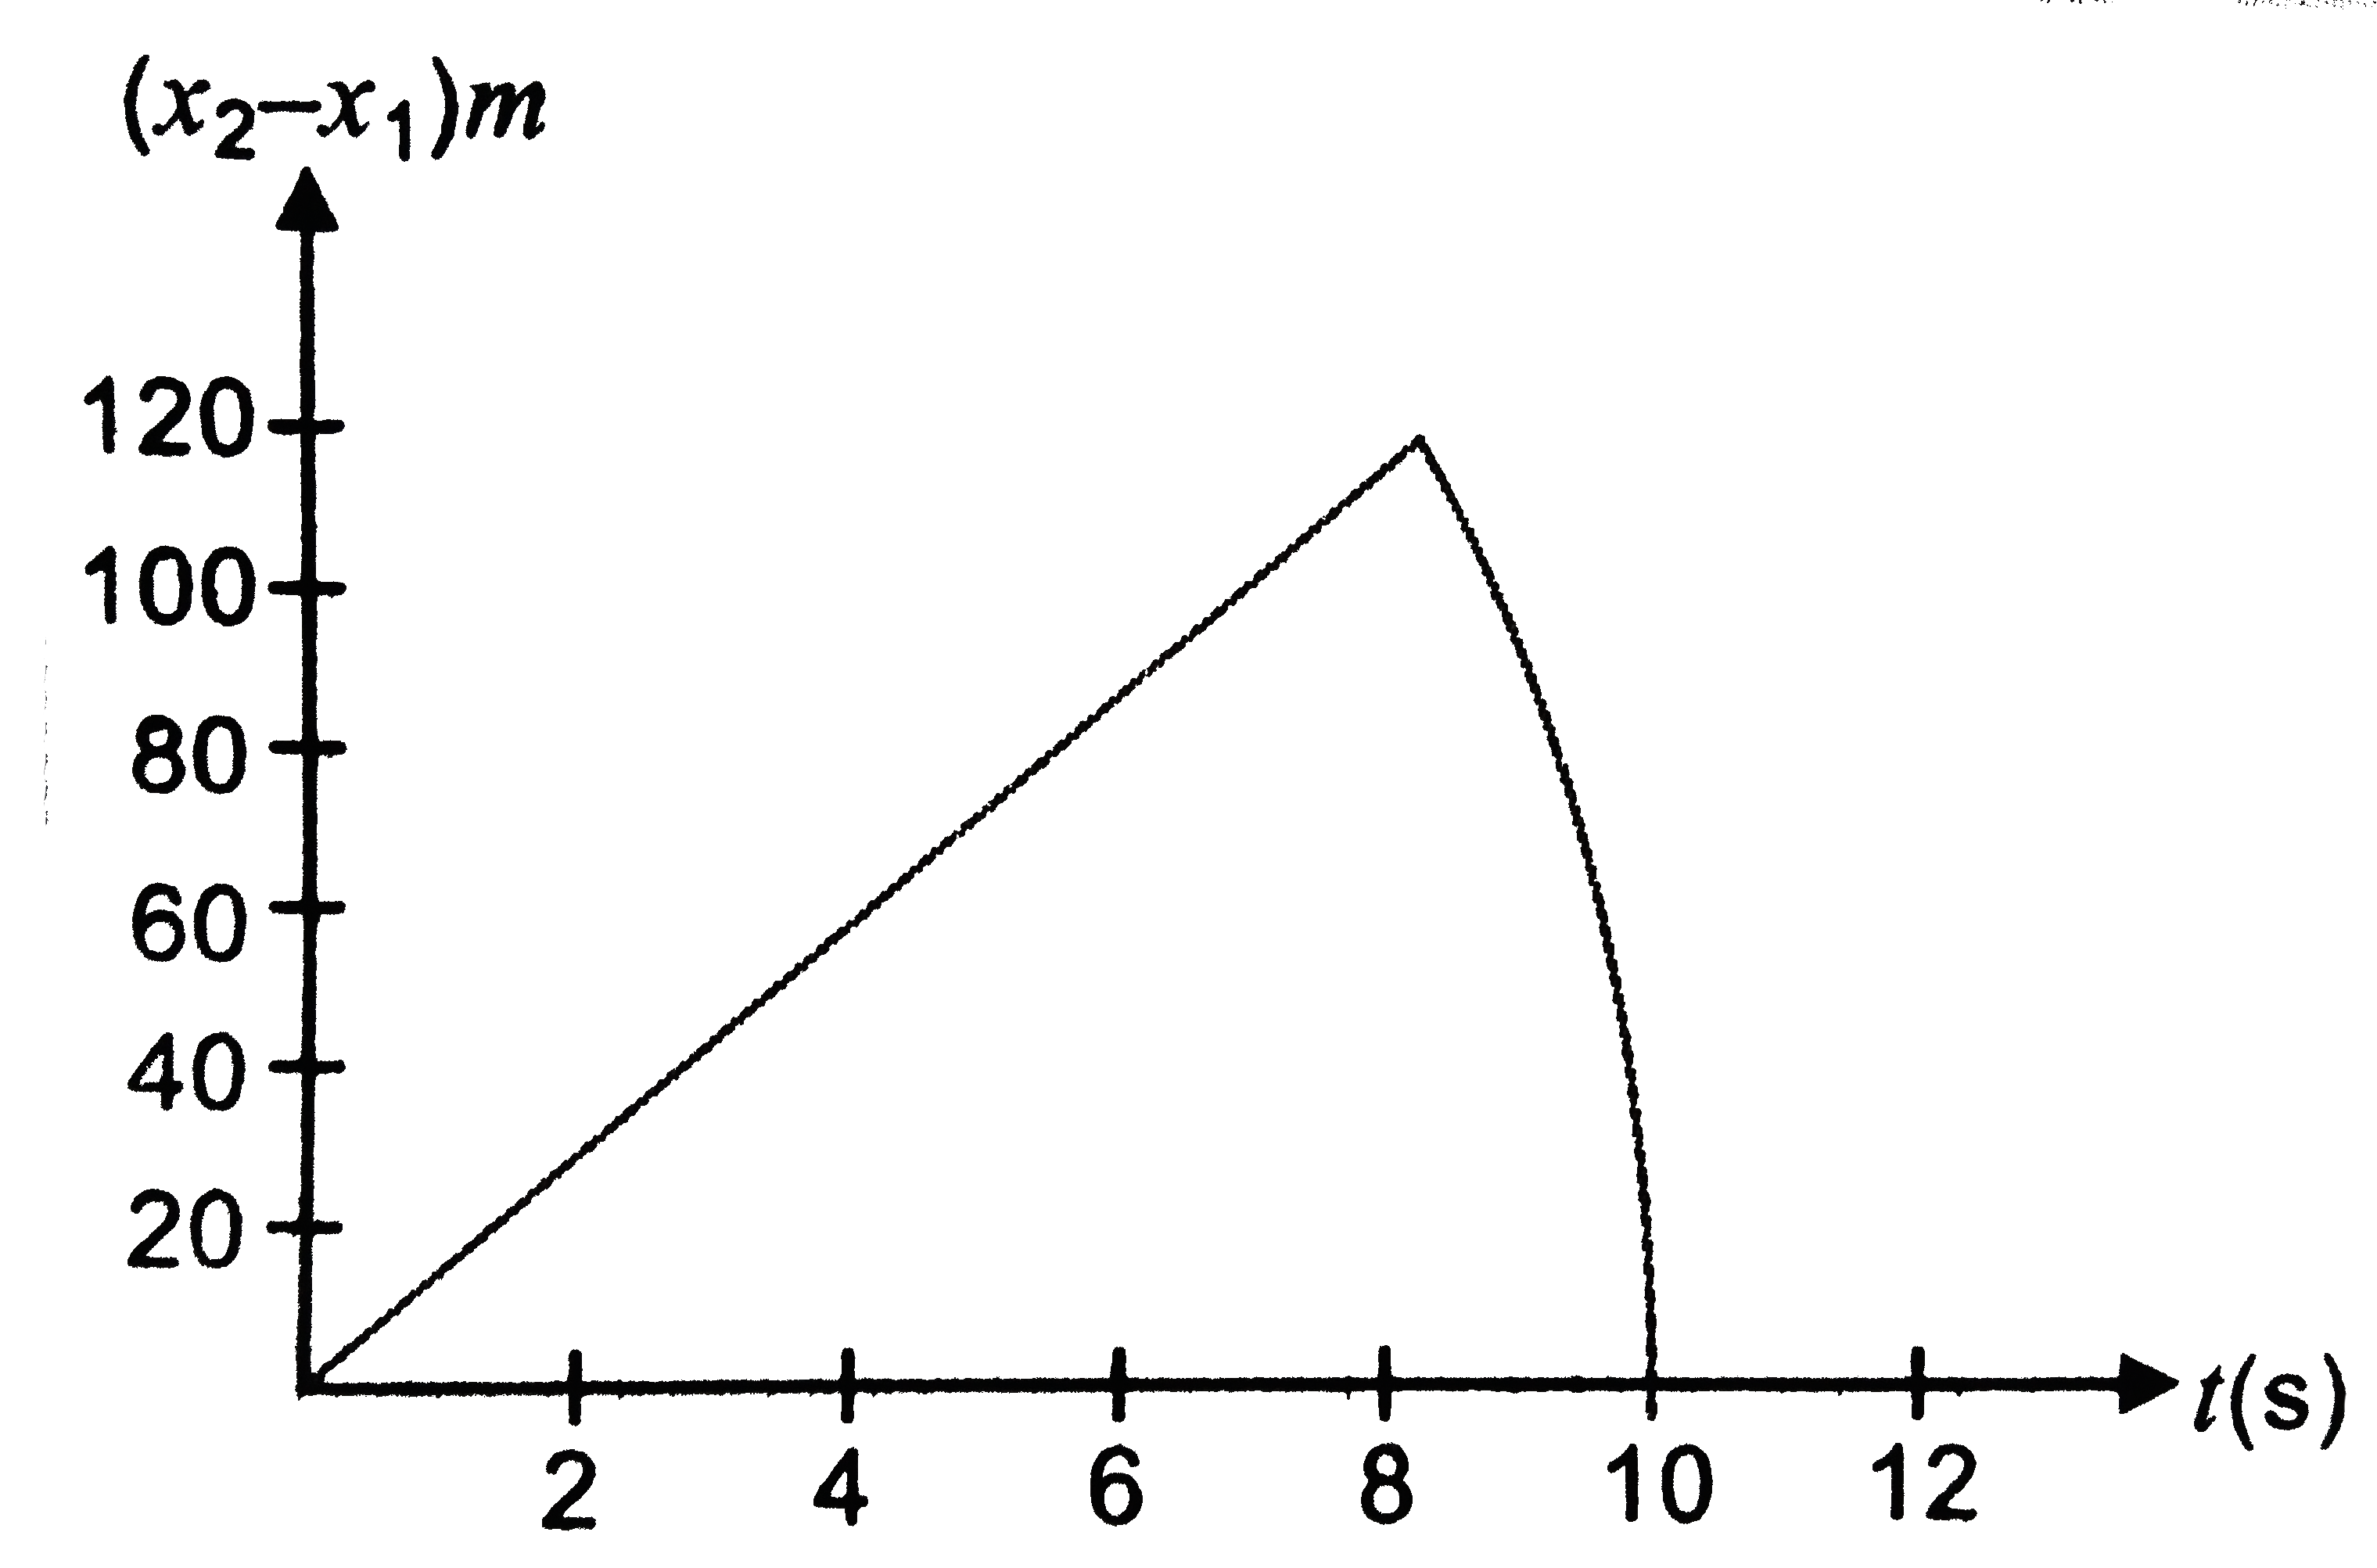
Two stones are thrown up simultaneously from the edge of a cliff 200m high with initial speeds of 15ms?−1 and 30−1. Verify that the graph shown in Fig. 2 ( NCT). 13 , correctly represents the time variation of the relativ e position of the second stone with respect to the first. Neglect the air resistance and assume that the stones do not rebound after hitting the ground. Taje g=10ms−2.Give equations for the linear and curved parts of the plot.
 .
.
View SolutionTwo balls are thrown up simultaneously from the top of a 400m high tower with speed 10m/s and 55m/s. Sketch a graph showing the separation between the balls versus time.
View Solution
Knowledge Check
Two stones are through up simultaneously from the edge of a cliff 240 m high with initial speed of 10 m/s and 40 m/s respectively. Which of the following graphs best represents the time variation of relative position of the second stone with respect to the first? Assume stones do not rebound after hitting the ground and neglect air resistance, take . g=10m/s2 (The figures are schematic and not drawn to scale)
A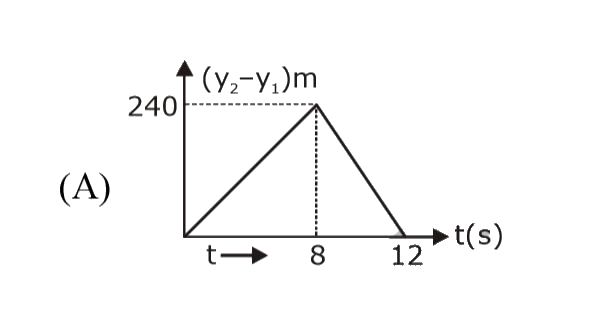 B
B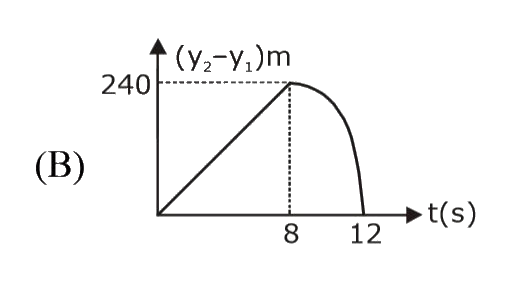 C
C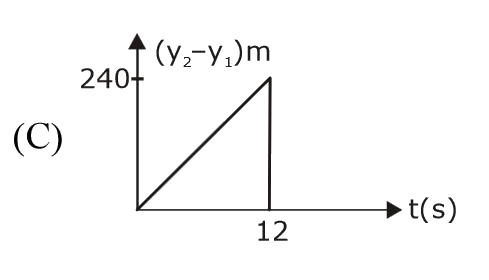 D
D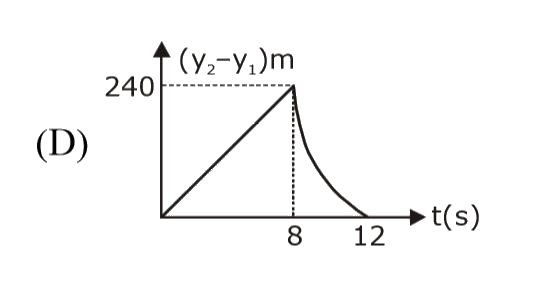
Two stones are through up simultaneously from the edge of a cliff 240 m high with initial speed of 10 m/s and 40 m/s respectively. Which of the following graphs best represents the time variation of relative position of the second stone with respect to the first? Assume stones do not rebound after hitting the ground and neglect air resistance, take . g=10m/s2 (The figures are schematic and not drawn to scale)
A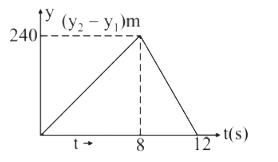 B
B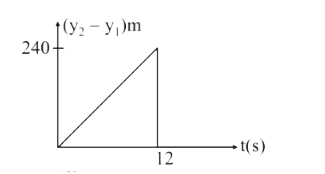 C
C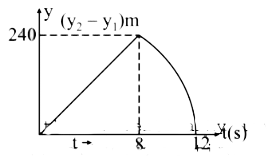 D
D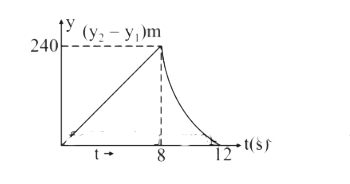
Two stones are thrown up simultaneously from the edge of a cliff 200 m high with initial speeds of 15ms−1 and 30ms−1 respectively. The time variation of the relative position of the second stone will request to the first as shown in the figure. The equation of the linear part is
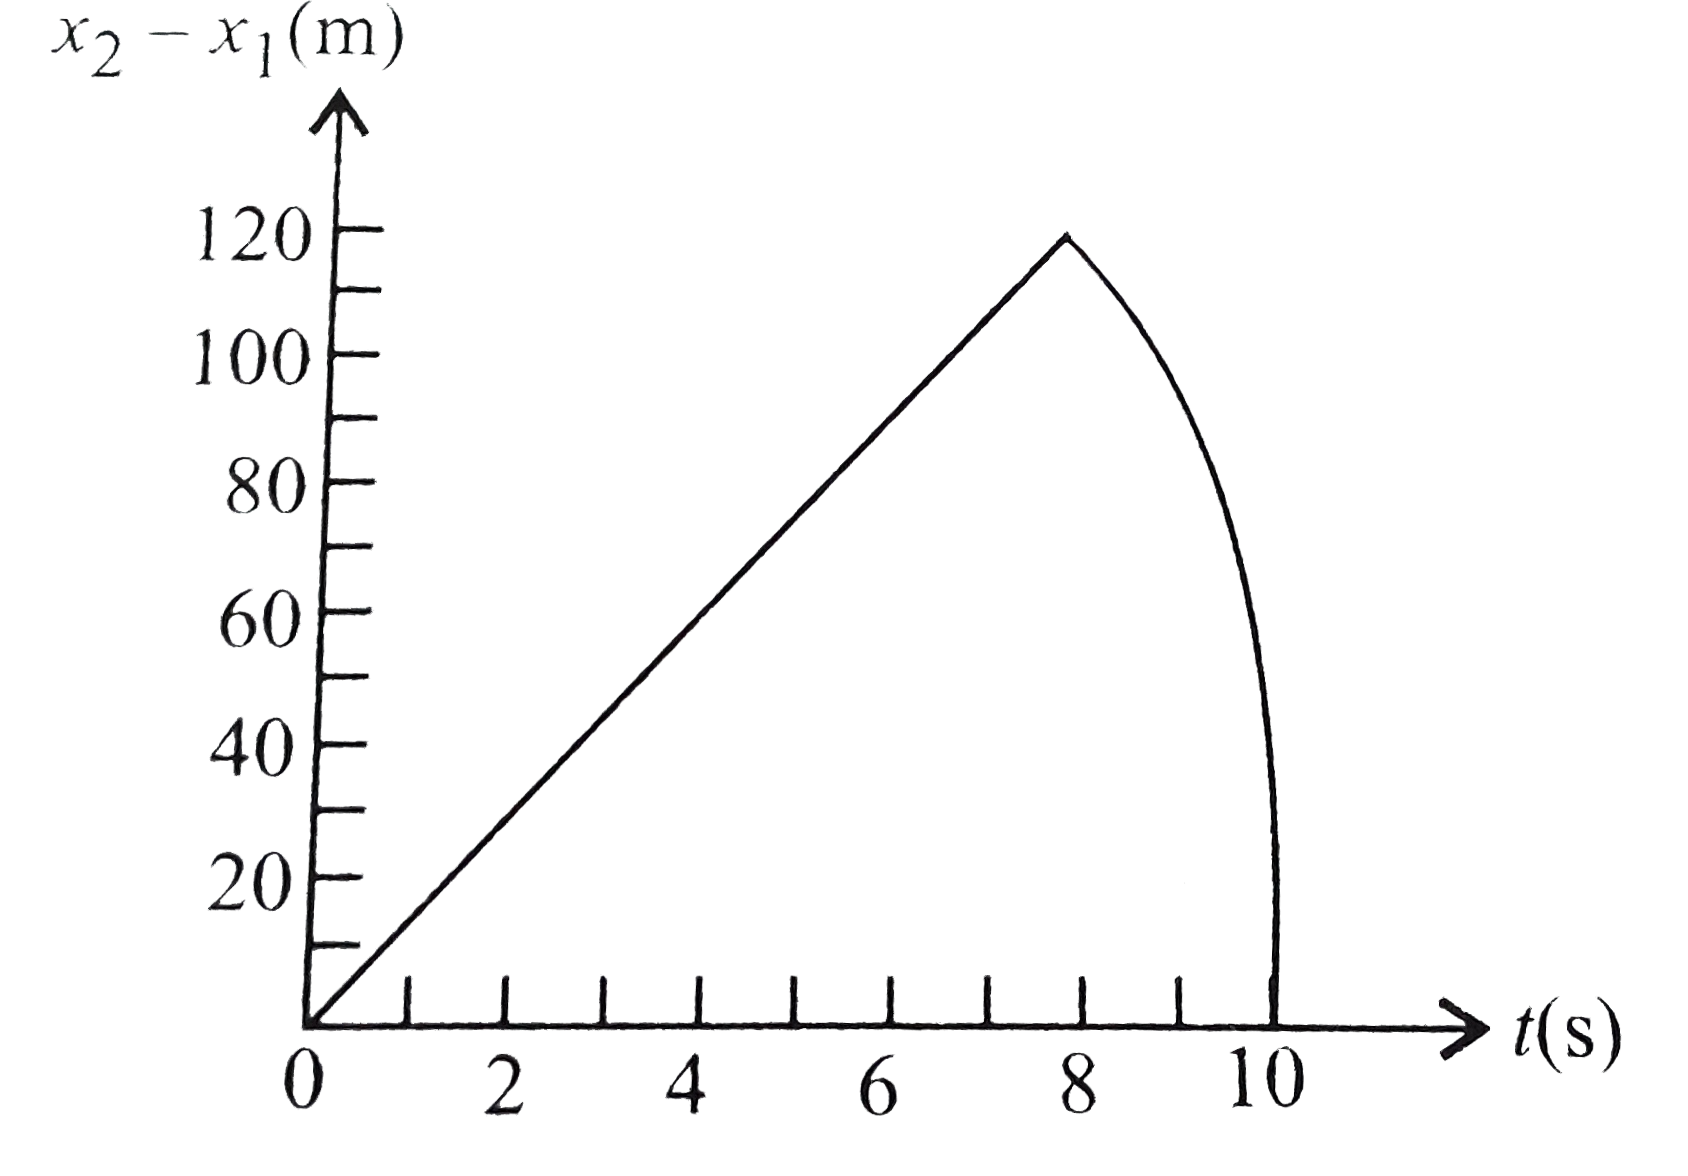 Ax2−x1 = 50tBx2−x1 = 10tCx2−x1 = 15tDx2−x1 = 20t
A stone is thrown upwards and it rises to a height 0f 200m. The relative velocity of the stone with respect to the earth will be maximum at :-
View SolutionTwo stones are thrown up simultaneously with initial speeds of u1 and u2(u2>1u1). They hit the ground after 6 s and 10 s respectively. Which graph in fig. correctly represents the time variation of Δx=(x2−x1) the relative position of the second stone with respect to the first upto t=10 s? Assume that the stones do not rebound after hitting the ground.
View SolutionTwo stones are thrown up simultaneously from the edge of a cliff with initial speed vand2v. The relative position of the second stone with respect to first varies with time till both the stones strike the ground as.
View SolutionOne stone is projected horizontally from a 20m high cliff with an initial speed of 10ms−1. A second stone is simultaneously dropped from that cliff. Which of the following is true?
View SolutionOne stone is projected horizontally from a 20m high cliff with an initial speed of 10ms−1. A second stone is simultaneously dropped from that cliff. Which of the following is true?
View Solution
