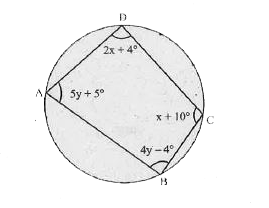
आकृति में ABCD एक चक्रीय चतुर्भुज है। x और y के मान ज्ञात कीजिए।

The correct Answer is:40∘
Step by step video, text & image solution for आकृति में ABCD एक चक्रीय चतुर्भुज है। x और y के मान ज्ञात कीजिए। by Maths experts to help you in doubts & scoring excellent marks in Class 10 exams.
Updated on:21/07/2023Topper's Solved these Questions
- माध्यमिक पूरक परीक्षा 2019BOOK - SCIENCE PUBLICATIONCHAPTER - माध्यमिक पूरक परीक्षा 2019EXERCISE - भाग-द
10 Videos
- माध्यमिक पूरक परीक्षा 2019BOOK - SCIENCE PUBLICATIONCHAPTER - माध्यमिक पूरक परीक्षा 2019EXERCISE - भाग-ब
5 Videos
- माध्यमिक परीक्षा (2019 )BOOK - SCIENCE PUBLICATIONCHAPTER - माध्यमिक परीक्षा (2019 )EXERCISE - माध्यमिक परीक्षा 2050
1 Videos
- रचनाएँBOOK - SCIENCE PUBLICATIONCHAPTER - रचनाएँEXERCISE - अन्य महत्त्वपूर्ण प्रश्न
1 Videos
Similar Questions
निम्न रैखिक समीकरणों के युग्म को आलेखीय विधि से हल कीजिए तथा उन बिन्दुओं के निर्देशांक ज्ञात कीजिए जहाँ इनके द्वारा निरूपित रेखाएँ
x+y=3
2x+5y=12
View Solutionसूत्रनिलिखलम् (आधार-उपाधार) द्वारा 105 का घनफल ज्ञात कीजिए।
View Solutionनिम्न बारंबारता बटन के मध्यक व बहुलक ज्ञात कीजिये

View Solution6 सेमी त्रिज्या का एक वृत्त खीचिए। केन्द्र से 10 सेमी दूर स्थित एक बिंदु से वृत्त पर स्पर्श रेखा - युग्म की रचना कीजिए और उनकी लंबाइया मापिए।
View SolutionIdentify the cell organelle 'A' :-
ltimg src="https://d10lpgp6xz60nq.cloudfront.net/physics_images/ALN_BIO_C10_E08_018_Q01.png" width="80%"gt
View SolutionHow many lines of symmetry does the above figure have ?
View SolutionWhich of the following are correct chain isomers of butane ? (i)
View SolutionDetermine the point of symmetry of a regular hexagon.
View SolutionDtermine the images of the following figure about the given line :
View SolutionMatch the following Column A to Column B

View SolutionMatch the following Column A to Column B

View SolutionMatch the following Column A to Column B

View SolutionThe inequation represented by the graph given below is :
View SolutionThe inequation that best describes the graph given below is _________
View SolutionThe inequation that best describes the following graph is _________
View SolutionWhich inequations represent the shaded region in the given figure
View Solution
