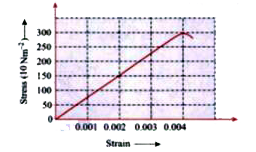
Fig., shows the stress-strain curve for a given materal. What are (a) Young's modulus and (b) approximate yield strength for this material?
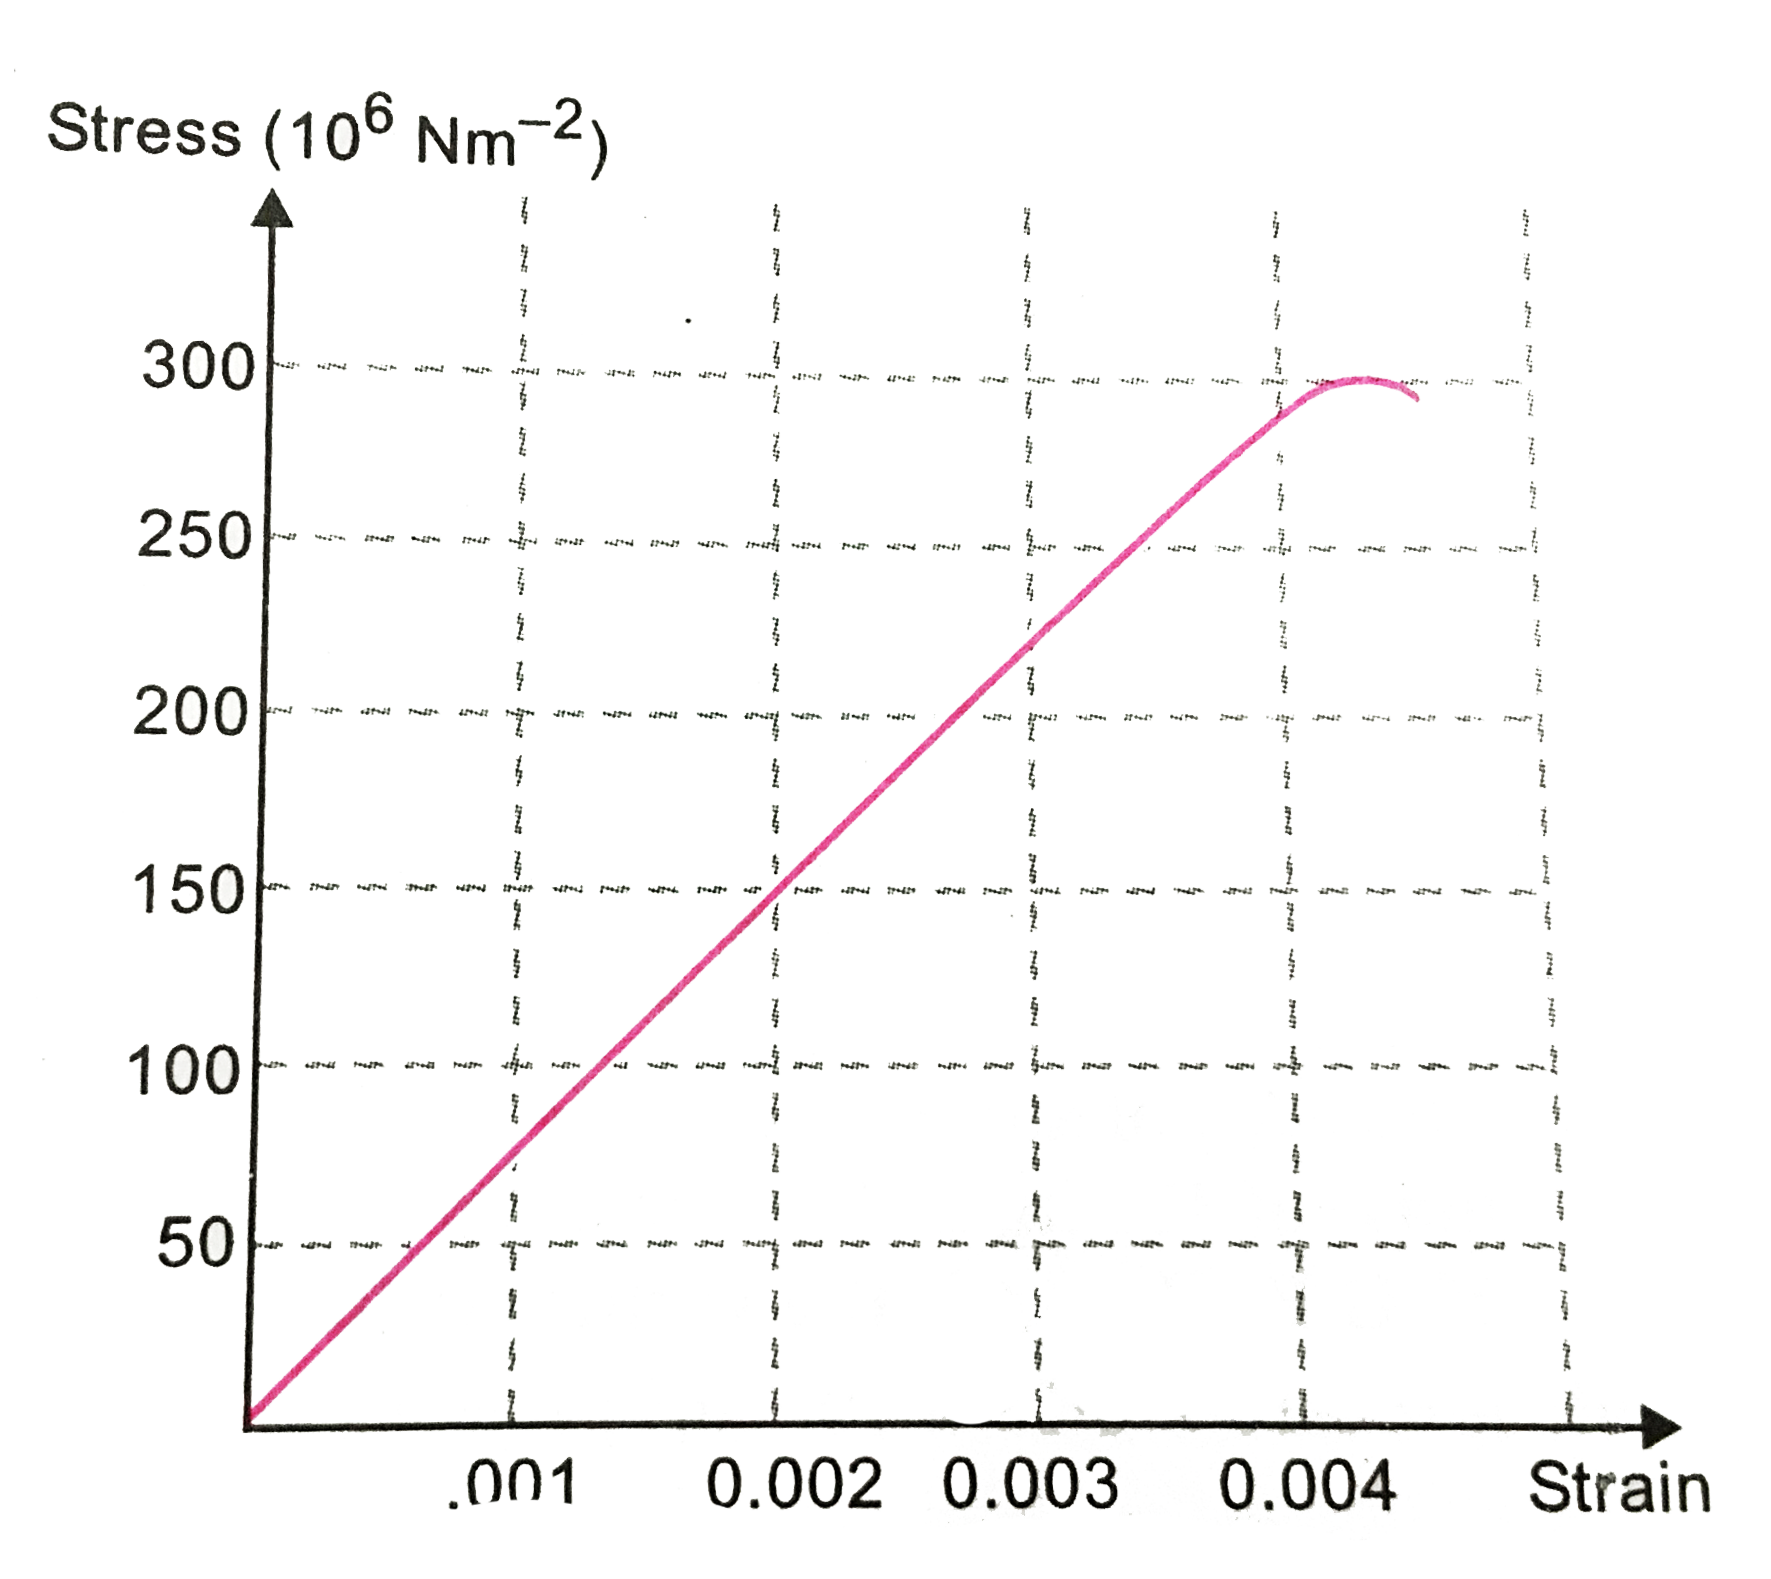
(a) 7.5×10¹⁰N/m2 , (b) 3×10⁸N/m2
Topper's Solved these Questions
- ELASTICITYBOOK - RESNICK AND HALLIDAYCHAPTER - ELASTICITYEXERCISE - CHECKPOINT
1 Videos
- ELASTICITYBOOK - RESNICK AND HALLIDAYCHAPTER - ELASTICITYEXERCISE - PRACTICE QUESTIONS
21 Videos
- ELASTICITYBOOK - RESNICK AND HALLIDAYCHAPTER - ELASTICITYEXERCISE - PRACTICE QUESTIONS (Integer Type)
3 Videos
- CURRENT AND RESISTANCEBOOK - RESNICK AND HALLIDAYCHAPTER - CURRENT AND RESISTANCEEXERCISE - Practice Questions (Integer Type)
3 Videos
- ELECTRIC CHARGES AND FIELDSBOOK - RESNICK AND HALLIDAYCHAPTER - ELECTRIC CHARGES AND FIELDSEXERCISE - Practice Questions (Integer Type )
3 Videos
Similar Questions
Knowledge Check
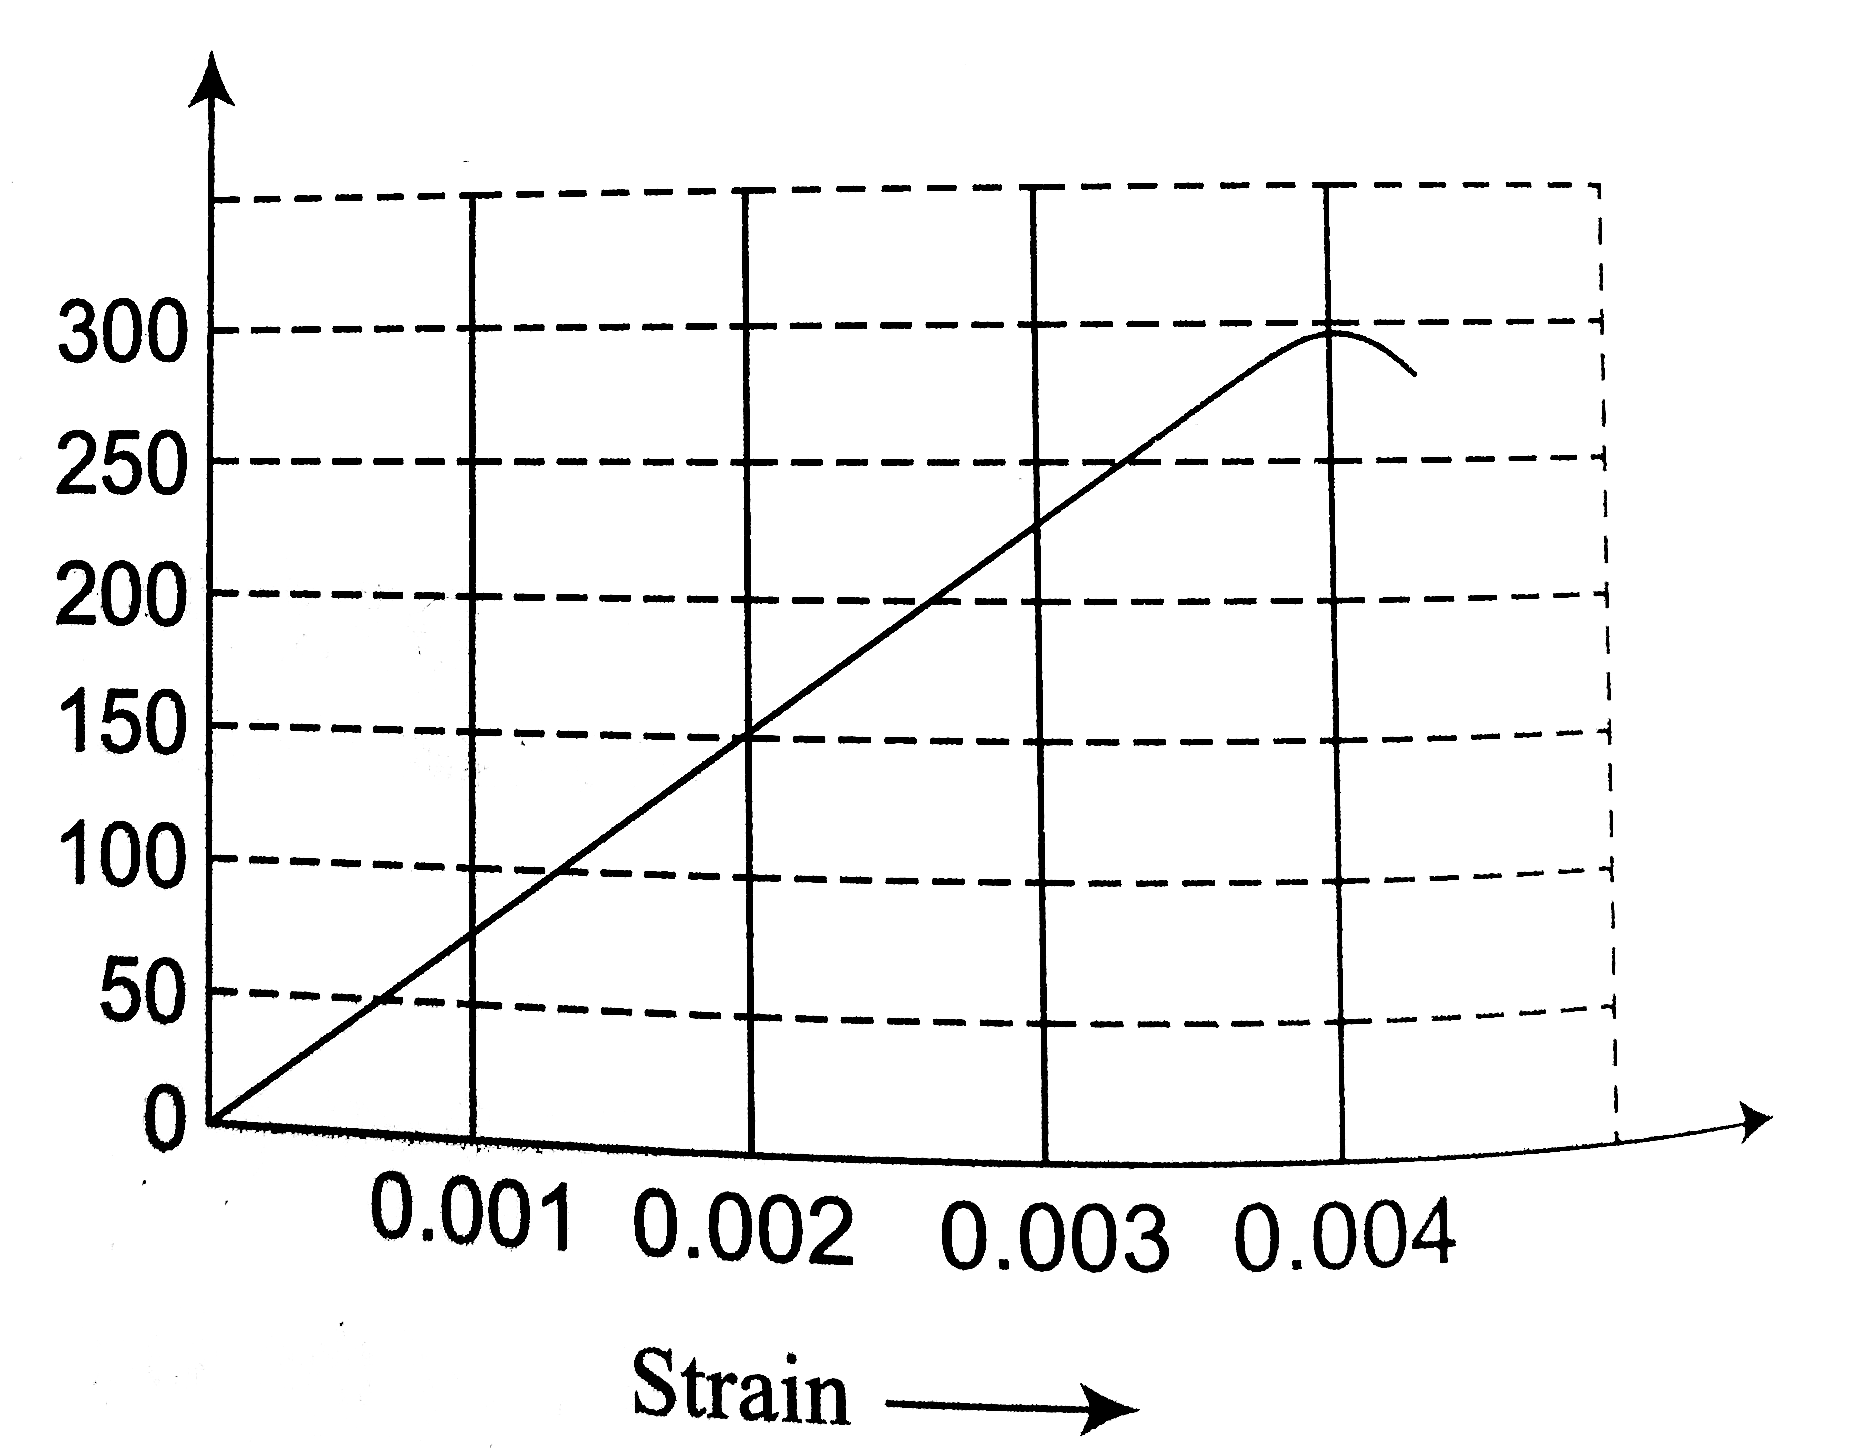
Figure shows the strain stress curve for a given material. The Young's modulus of the material isA5×109Nm−2B5×1010Nm−2C7.5×109Nm−2D7.5×1010Nm−2Figure shows the stress-strain graphs for materials .A and B. From the graph it follows that
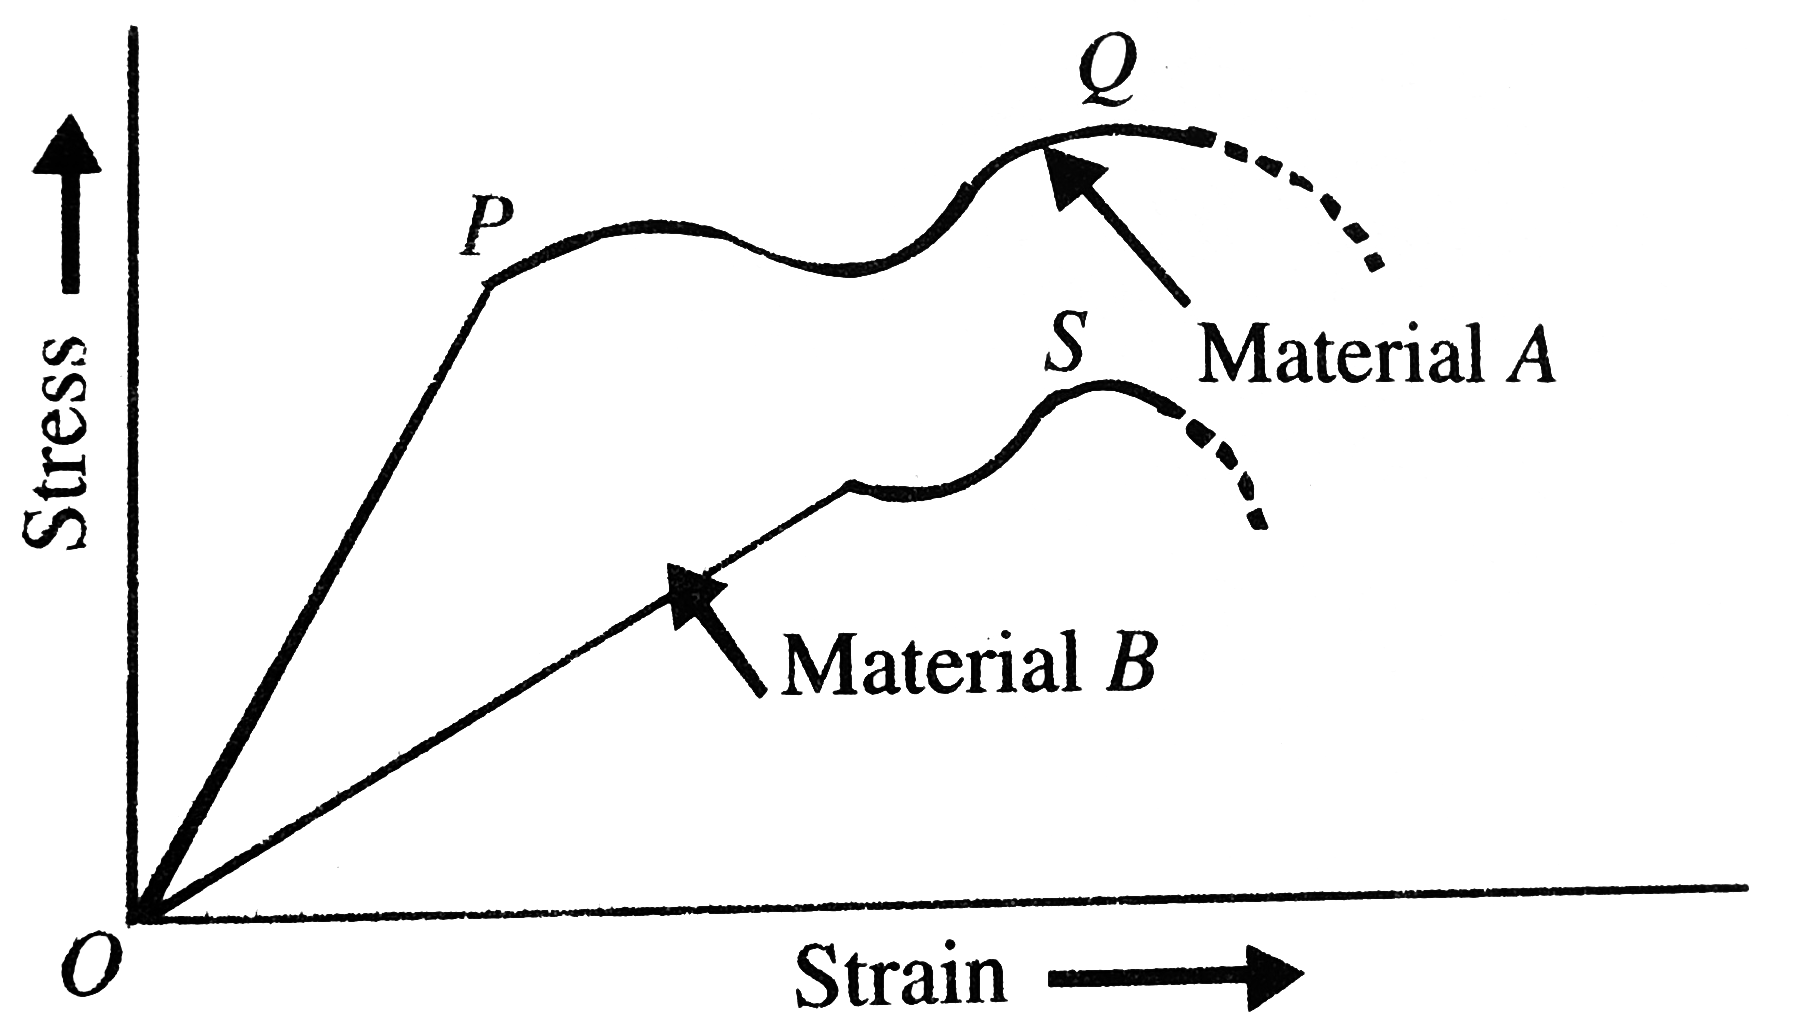 Ato material A has a higher Young's modulusBmaterial B is more ductileCmaterial A can withstand greater stressDmaterial B can withstand greater stress
Stress-strain curve for four metals are shown in figure. The maximum Young's modulus of elasticity is for metal
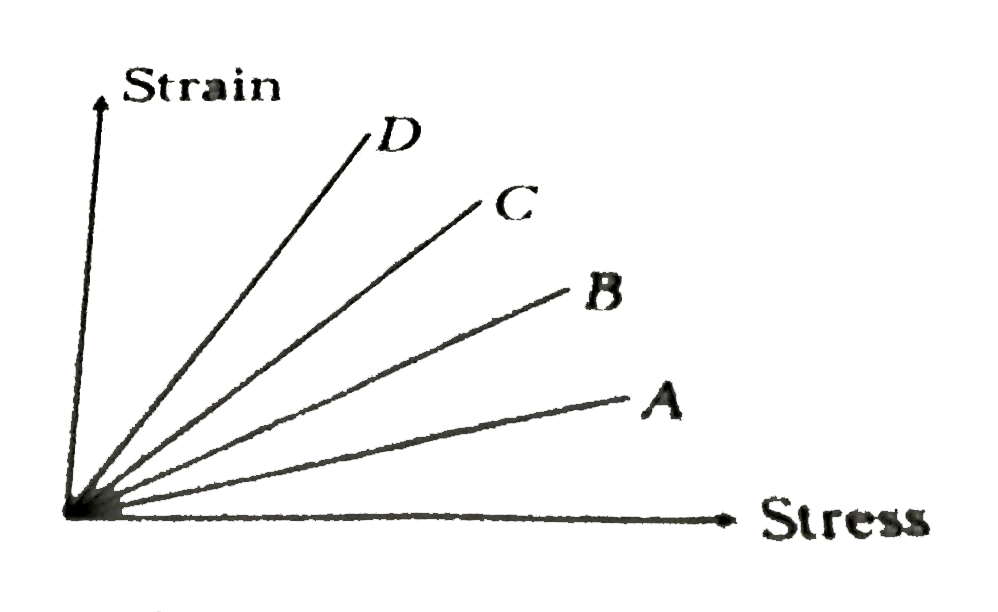 AABBCCDD
The stress-strain graphs for two materials A and B are shown in the figure. The graphs are drawn to the same scale.
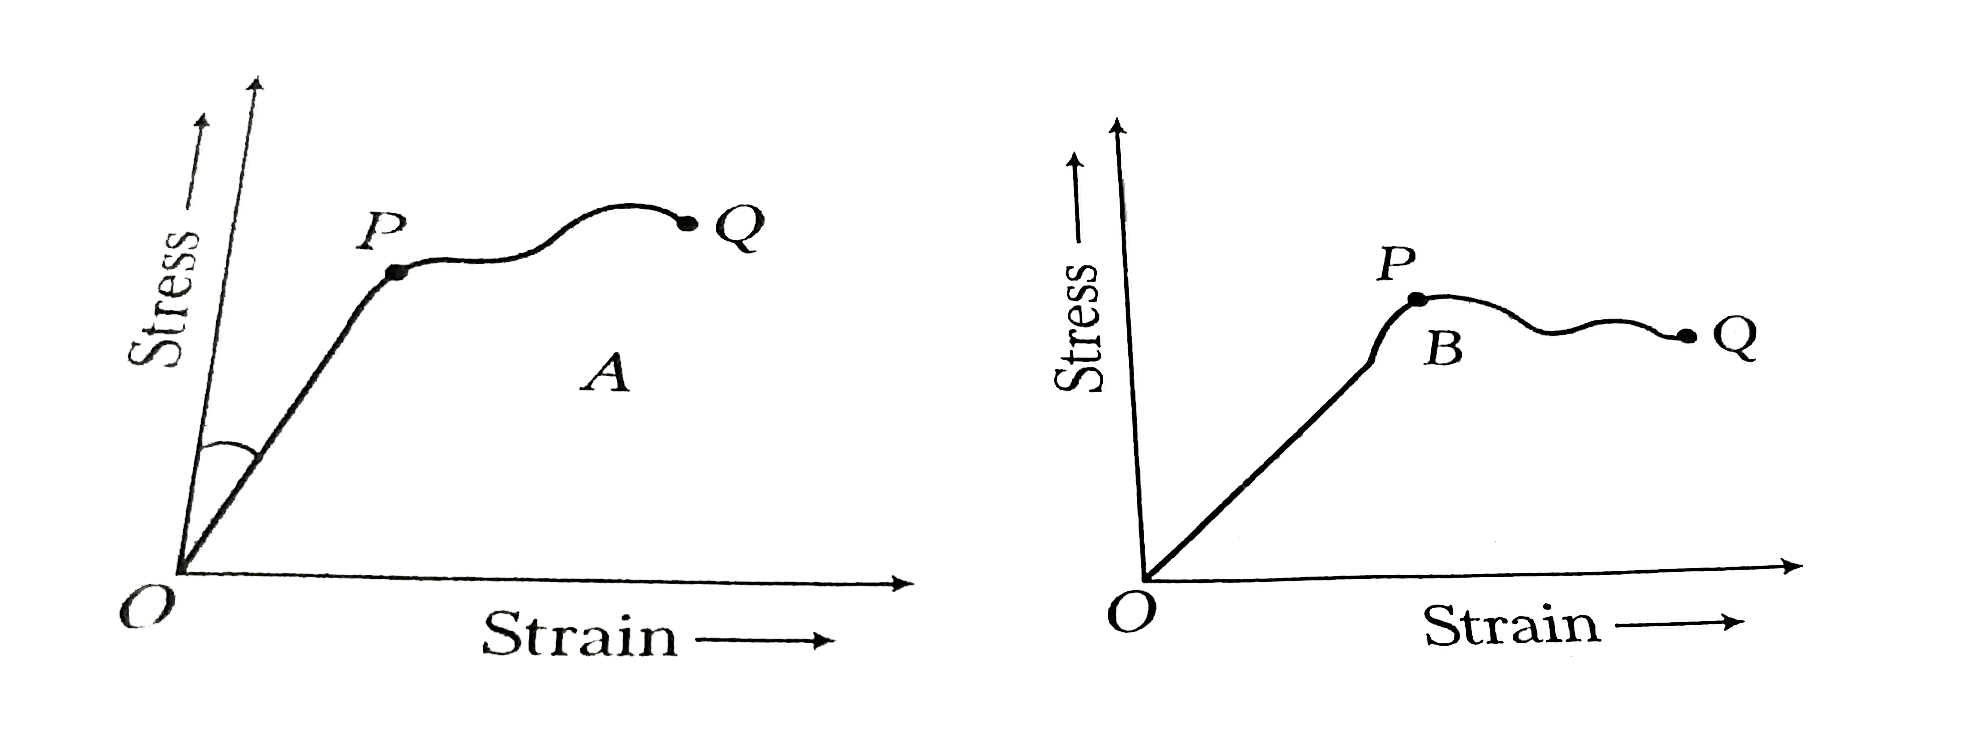
(a) Which material has a greater Young's modulus ?
(b) Which material is more ductile ?
(c) Which material is more brittle?
(d) Which of the two is the stronger material ?
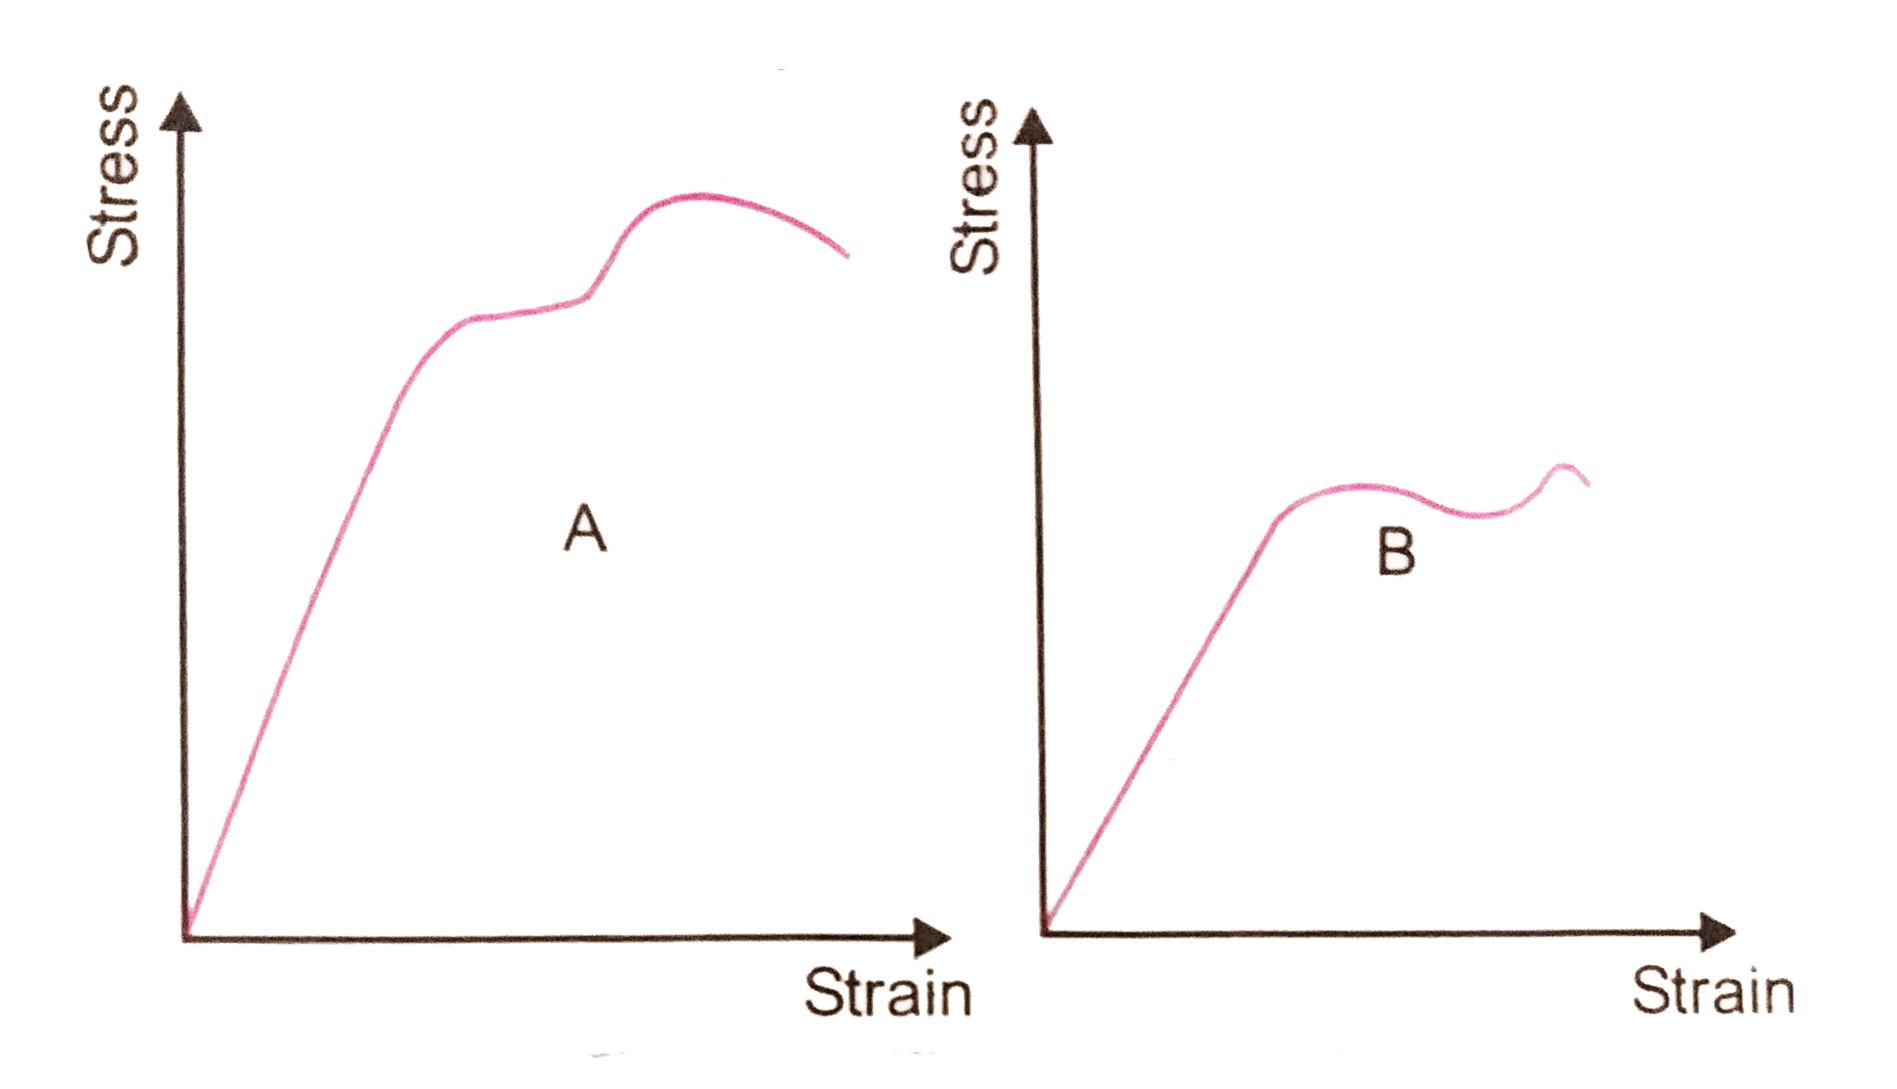
View SolutionThe stress versus strain graph for two materials A and B are shown in fig. the graph are on the same scale. ltbr> (a) Which materail has greater Young's modulus?
(b) which of the two is stronger materail?
View SolutionIf for a material , Y and B are young's modulus and Bulk 's modulus , them .
View SolutionFor a given material the Young's modulus is 2.4 times that of its rigidity modulus. Its Possion's ratio is
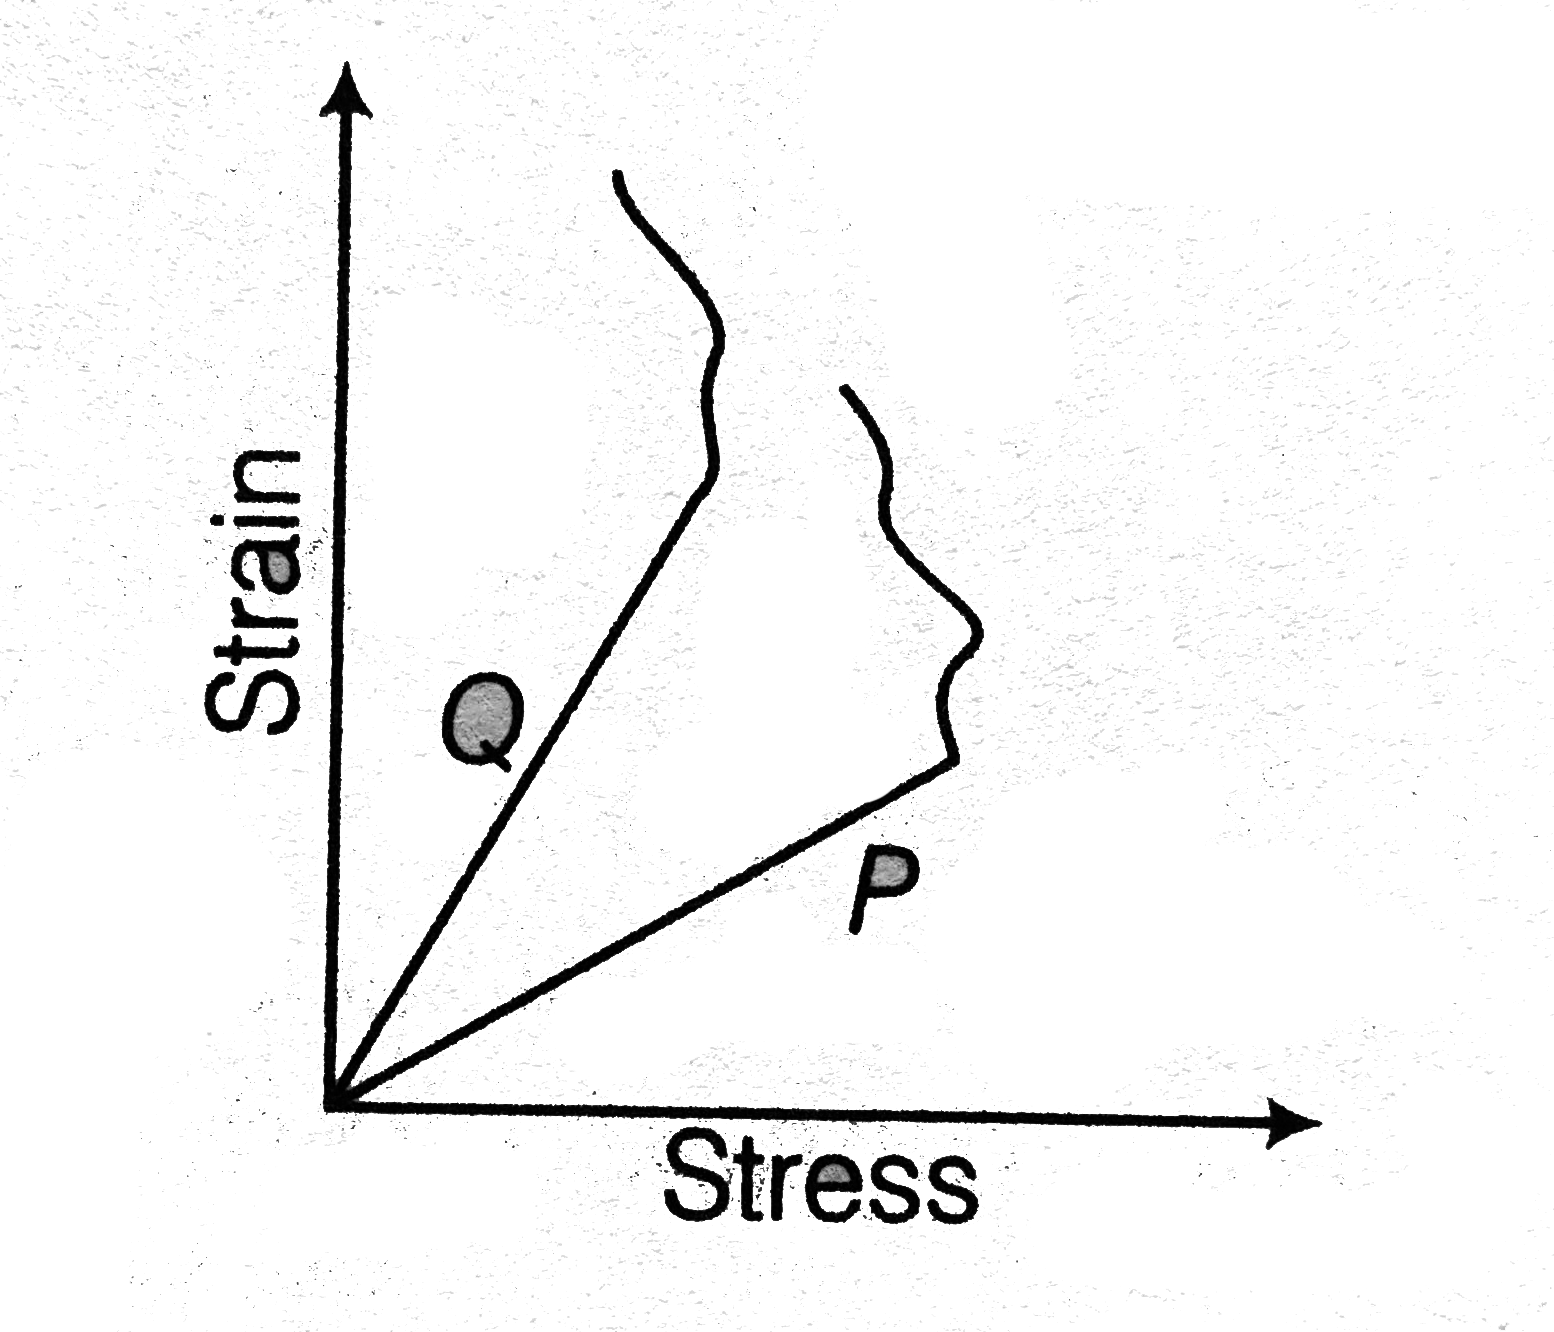
View SolutionFigure shows the stress-strain curve of two metals P and Q. From the graph, it can be concluded that
View Solution

