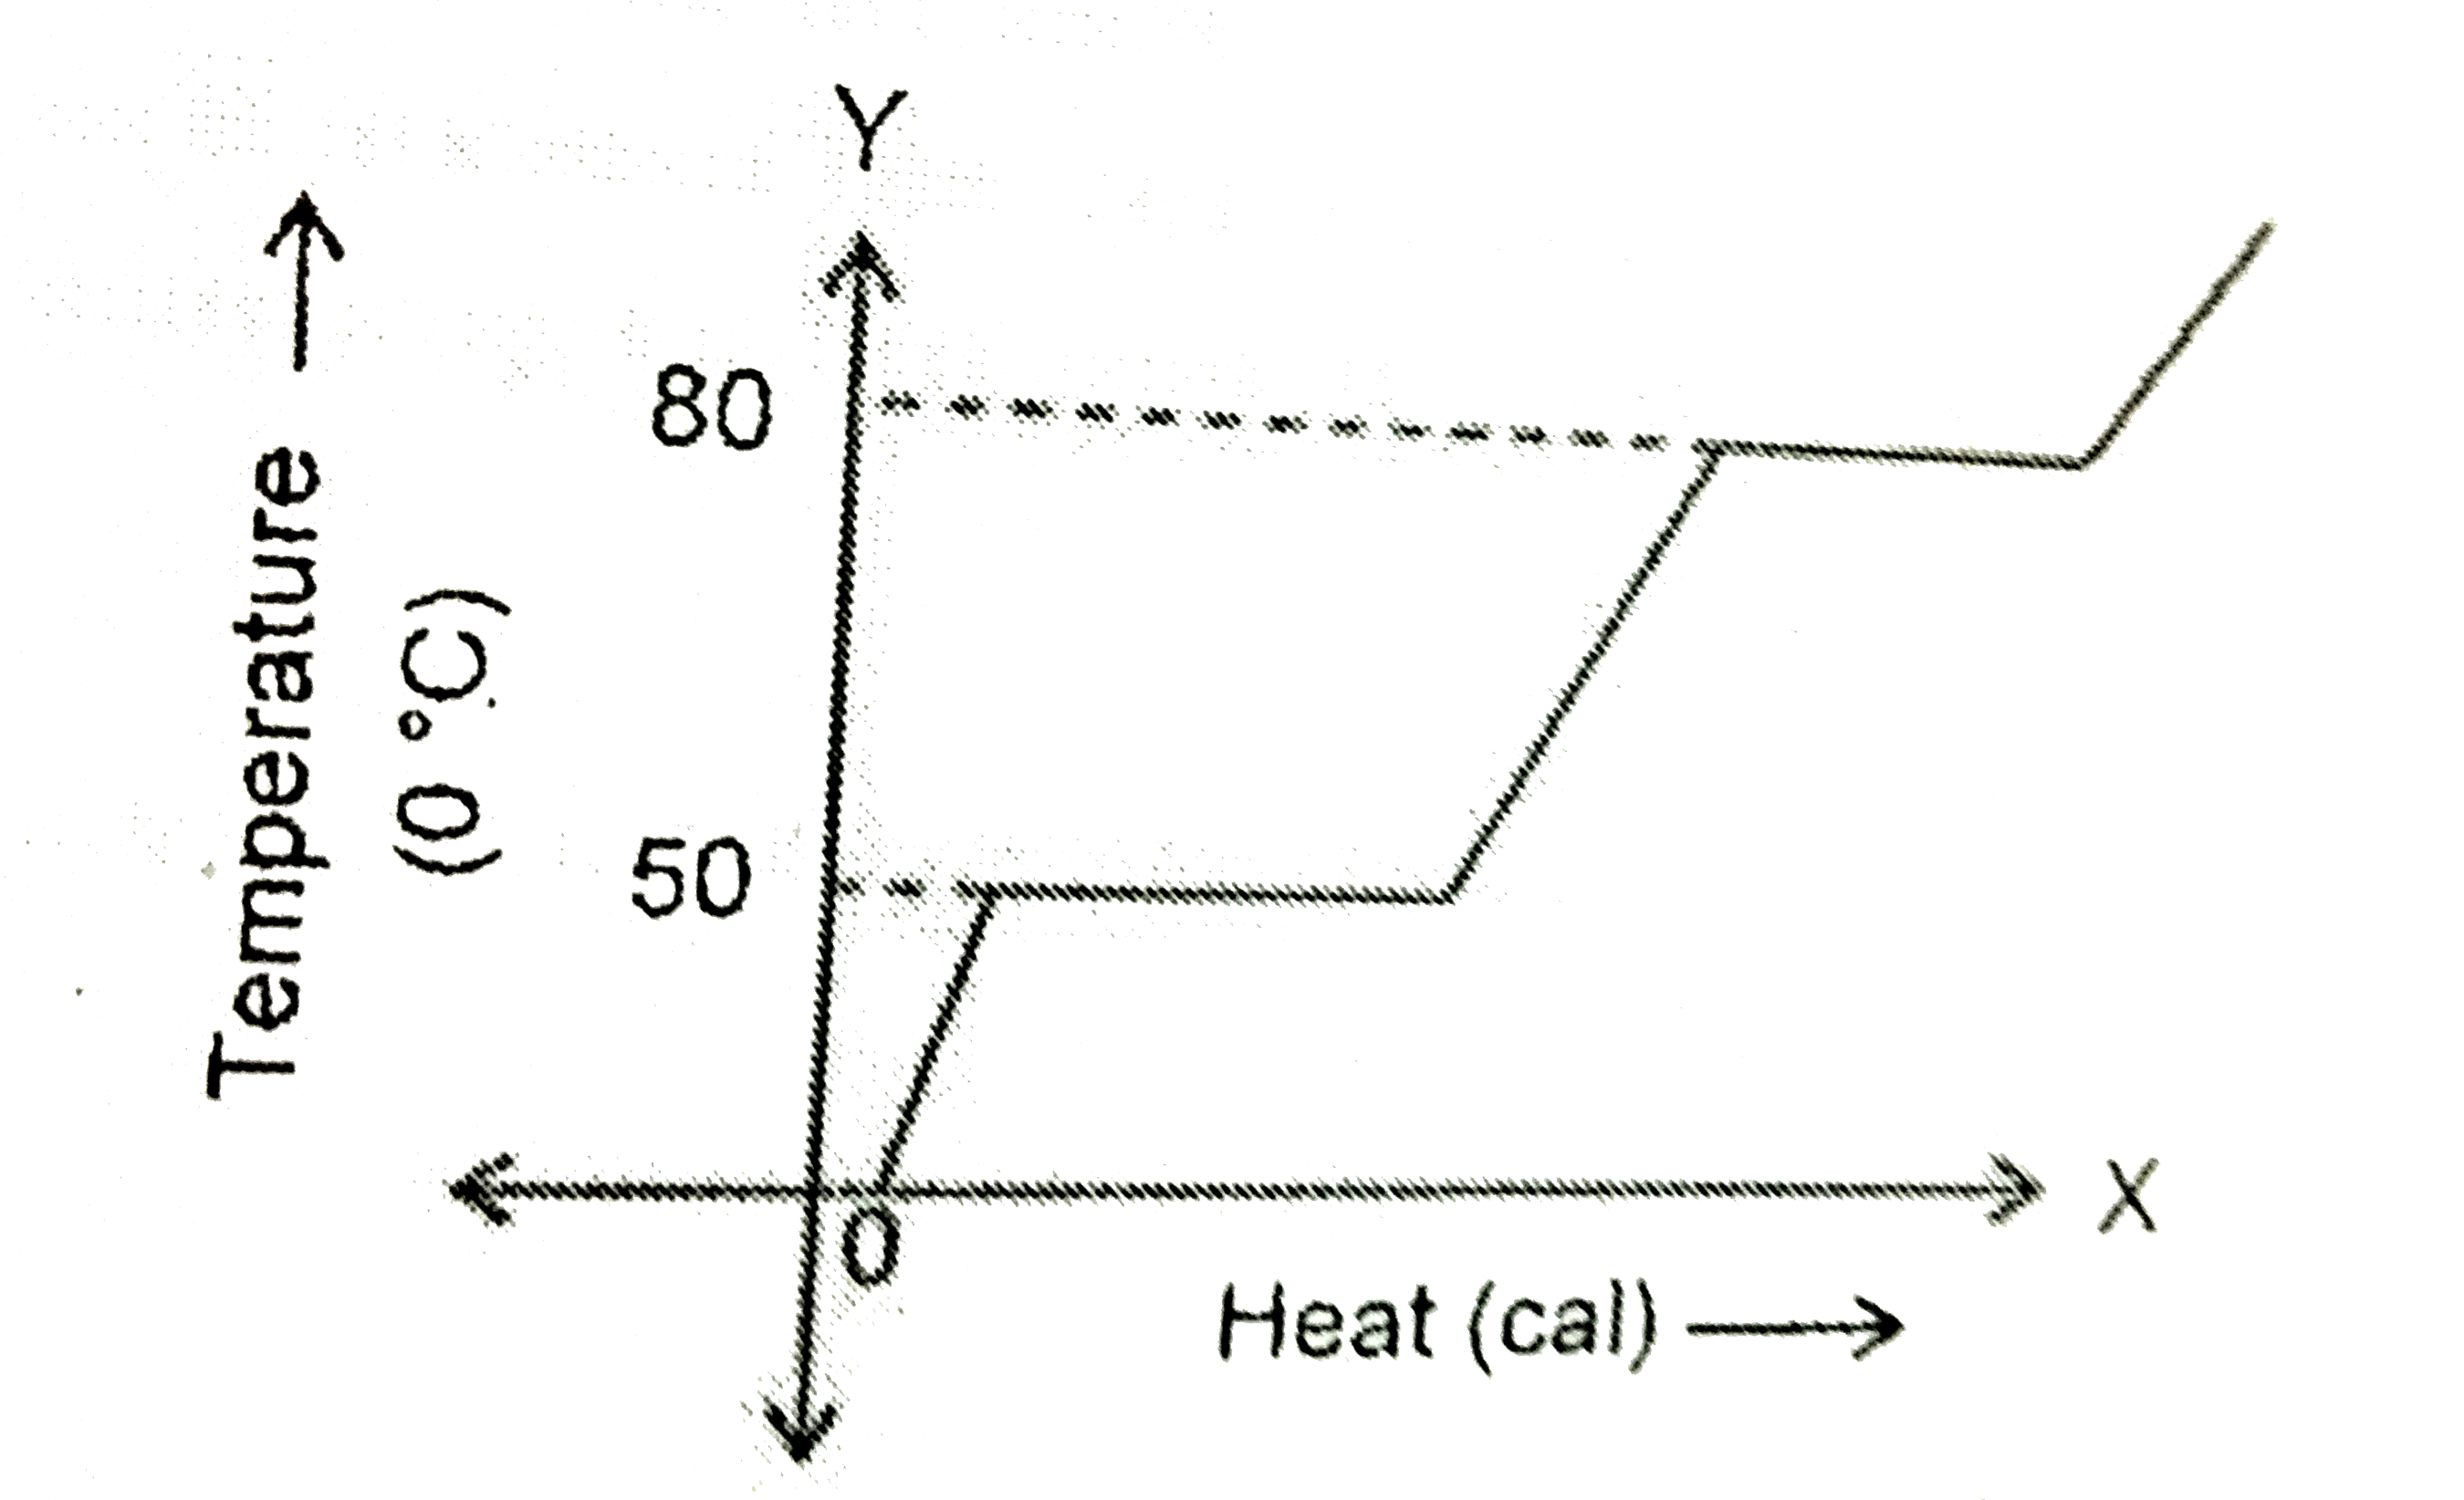
A graph is drawn by taking the rise in temperature on Y axis and heat supplied on x axis .Find out the melting point and boiling point of heat substance

Melting point =5∘C
Boling point =80∘C
Topper's Solved these Questions
- HEAT BOOK - PEARSON IIT JEE FOUNDATIONCHAPTER - HEAT EXERCISE - Level 3
7 Videos
- HEAT BOOK - PEARSON IIT JEE FOUNDATIONCHAPTER - HEAT EXERCISE - Test 1
15 Videos
- HEAT BOOK - PEARSON IIT JEE FOUNDATIONCHAPTER - HEAT EXERCISE - Level 1
47 Videos
- ElectricityBOOK - PEARSON IIT JEE FOUNDATIONCHAPTER - ElectricityEXERCISE - ASSESSMENT TEST (TEST-2)
15 Videos
- KINEMATICSBOOK - PEARSON IIT JEE FOUNDATIONCHAPTER - KINEMATICSEXERCISE - ASSESSMENT TEST (TEST 2 (SELECT THE CORRECT ALTERNATIVE)
15 Videos
Similar Questions
Knowledge Check
……… is the hardest substance and has the highest melting and boiling points.
AIodineBSulphurCDiamondDPhosphorus…………..is the hardest substance and has the highest melting and boiling points.
AIodineBSulphurCDiamondDPhosphorusA given substance of mass 'm' is in solid state at certain temperature. Arrange the following steps in proper sequence to calculate the total heat energy required to just convert the substance completely into gaseous state.
(A) Note down the specific latent heat of vapor ization of the substance and calculate the heat supplied to convert from liquid to gaseous state using the formula.
(B) Note down the melting point of the substance and calculate the heat supplied to increase the temperature of the solid to its melting point.
(C ) Note down the boiling point of the substance and calculate the heat supplied to increase the temperature of the substance from melting point to its boiling point.
(D) Add all the heat energies, it gives the resultant heat supplied to the solid to just convert it into gaseous state.
(E) Note down the specific latent heat of fusion of the substance and calculate the heat supplied to convert the substance from solid state to liquid state.AB D E C ABA C E D BCA B C D EDB E C A D
Why does the temperature of a substance remain constant during its melting point or boiling point ?
View SolutionGive the coordinates of a point on the x-axis and a point on the y-axis.
View SolutionA ginven substance of mass 'm' is in solid state at certain temperature. Arrange the following steps in proper sequence to calcualte the total heat energy required to just convert the substance completely into gaseous state.
(a). Note down the specific latent heat of vaporization of the substance and calculate the heat supplied to convert from liquid to gaseous state using the formula.
(b) Note down the melting point of the substance and calculate the heat supplied to increase the temperature of the solid to its melting point.
(c) Note down the boiling point of the substance and calculate the heat supplied to increase the temperature of the substance from melting point to its boiling point.
(d). Add all the heat energies, it gives the resultant hea supplied to the solid to just convert it into gaseous state.
(e) Note down the specific latent heat of fusion of the substance and calculate the heat supplied to convert the substance from solid state to liquid state.
View SolutionThe specific heat of water at boiling point is
View SolutionSpecific heat of a substane at the melting point becomes
View Solution
