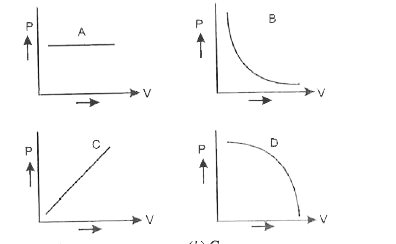
Which of the following PV diagrams best represents an isothermal process:
 Solution in Kannada
A
C
B
D
The correct Answer is:B
PV=RT
For isothermal process, T=const PV =const.
Correct choice is (b).
Topper's Solved these Questions
- HEAT AND THERMODYNAMICSBOOK - MODERN PUBLICATIONCHAPTER - HEAT AND THERMODYNAMICSEXERCISE - Multiple Choice Questions (LEVEL-II)
55 Videos
- HEAT AND THERMODYNAMICSBOOK - MODERN PUBLICATIONCHAPTER - HEAT AND THERMODYNAMICSEXERCISE - Multiple Choice Questions (Level - III) (Questions From AIEEE/JEE Examination)
17 Videos
- GRAVITATIONBOOK - MODERN PUBLICATIONCHAPTER - GRAVITATIONEXERCISE - Recent Competitive Questions
8 Videos
- LAWS OF MOTIONBOOK - MODERN PUBLICATIONCHAPTER - LAWS OF MOTIONEXERCISE - Revision test
43 Videos
Similar Questions
The P-V diagram for a cyclic process is a triangle ABC drawn in order. The co-ordinates of A, B, C are (4,1), (2,4) & (2,1). The co-ordinates are in order of P- V in which P is in N/m2 & volume in litres. The work done during the process from A to B is:
View SolutionA thermally insulated vessel contains an ideal gas of molecular mass M and ratio of specific heats γ. It is moving with speed v and it is suddenly brought to rest. Assuming no heat is lost to the surroundings, its temperature increases by:
View SolutionAn astronaut on a strange planet finds that acceleration due to gravity is twice as that on the surface of earth. Which of the following could explain thin ?
View SolutionWhen a carpet is beaten with a stick, dust comes out of it. Explain.
View SolutionWhich of the following P−V diagrams best represents an isothermal process?
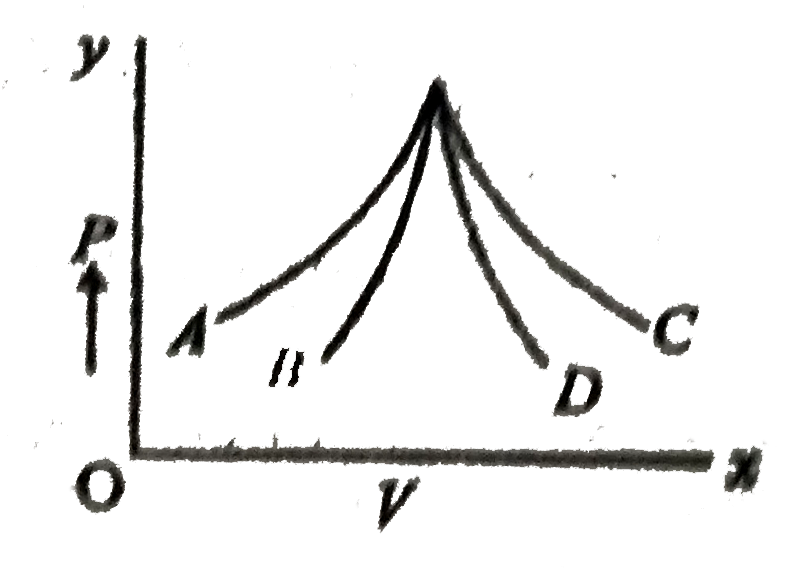
View SolutionFigure shows four PV diagrams. Which of these curves represent isothermal and adiabatic processes?

View SolutionWhich of the following P-V curve best represents. As isothermal process?
View SolutionDuring which of the following thermodynamic process represented by PV diagram the heat energy absorbed by system may be equal to area under PV graph?
View SolutionWhat is the slope for an isothermal process in PV indicator diagram -
View SolutionWhat is a PV indicator diagram (Isotherm ) ?
View SolutionRepresent PV indicator diagram for a cyclic process.
View SolutionWhich of the following P-V curve best represents. As isothermal process?
View Solutionनिम्नलिखित में से कौन-सा pV आरेख, समतापीय प्रक्रम को सबसे अच्छा दिखाता है?
View SolutionHow is a process represented on a pV -diagram?
View SolutionDefine the following terms: (a) Isothermal process (b) adiabatic process (c) isobaric proces (d) isochoric process.
View SolutionWhat do you mean by a cyclic process ? How it is represented in a pV diagram ?
View Solution
