The graph given below represents three categories of organismic responses - L, M and N to cope with stressful conditions. Identify the categories L and M.
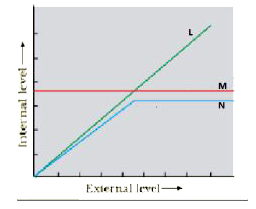
Given below are examples of some of the activities performed by animals. Categorise these activities into the appropriate kind of the organismic response (L, M or N) as shown in the graph with reasons.
i. In summers we sweat profusely.
ii. Sometimes desert lizards bask in the sun and sometimes they move into shade.
L: Conformers, M: Regulators
i. To regulate the body temperature – M/Regulators
ii. To keep their body temperature constant by behavioural response for coping with variations in environment– L/Conformers
Topper's Solved these Questions
- SAMPLE QUESTION PAPER (BIOLOGY)Book:CBSE MODEL PAPERChapter:SAMPLE QUESTION PAPER (BIOLOGY)Exercise:SECTION-D
Explore 6 Videos
- SAMPLE QUESTION PAPER (BIOLOGY)Book:CBSE MODEL PAPERChapter:SAMPLE QUESTION PAPER (BIOLOGY)Exercise:SECTION-B
Explore 11 Videos
- SAMPLE PAPER 2023 TERM IBook:CBSE MODEL PAPERChapter:SAMPLE PAPER 2023 TERM IExercise:SECTION - E
Explore 13 Videos
Similar Questions
Knowledge Check
In the graph below. where N is population size and tis time. M represents
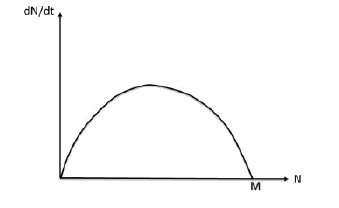 Aspecific growth rate.BMedian population sizeCcarrying capacityDminimum population size without going extinct.
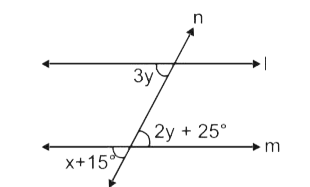
In the figure , l||m & l||n then x is -
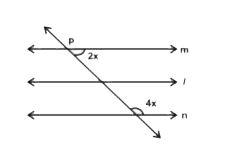 A90∘B45∘C30∘D60∘
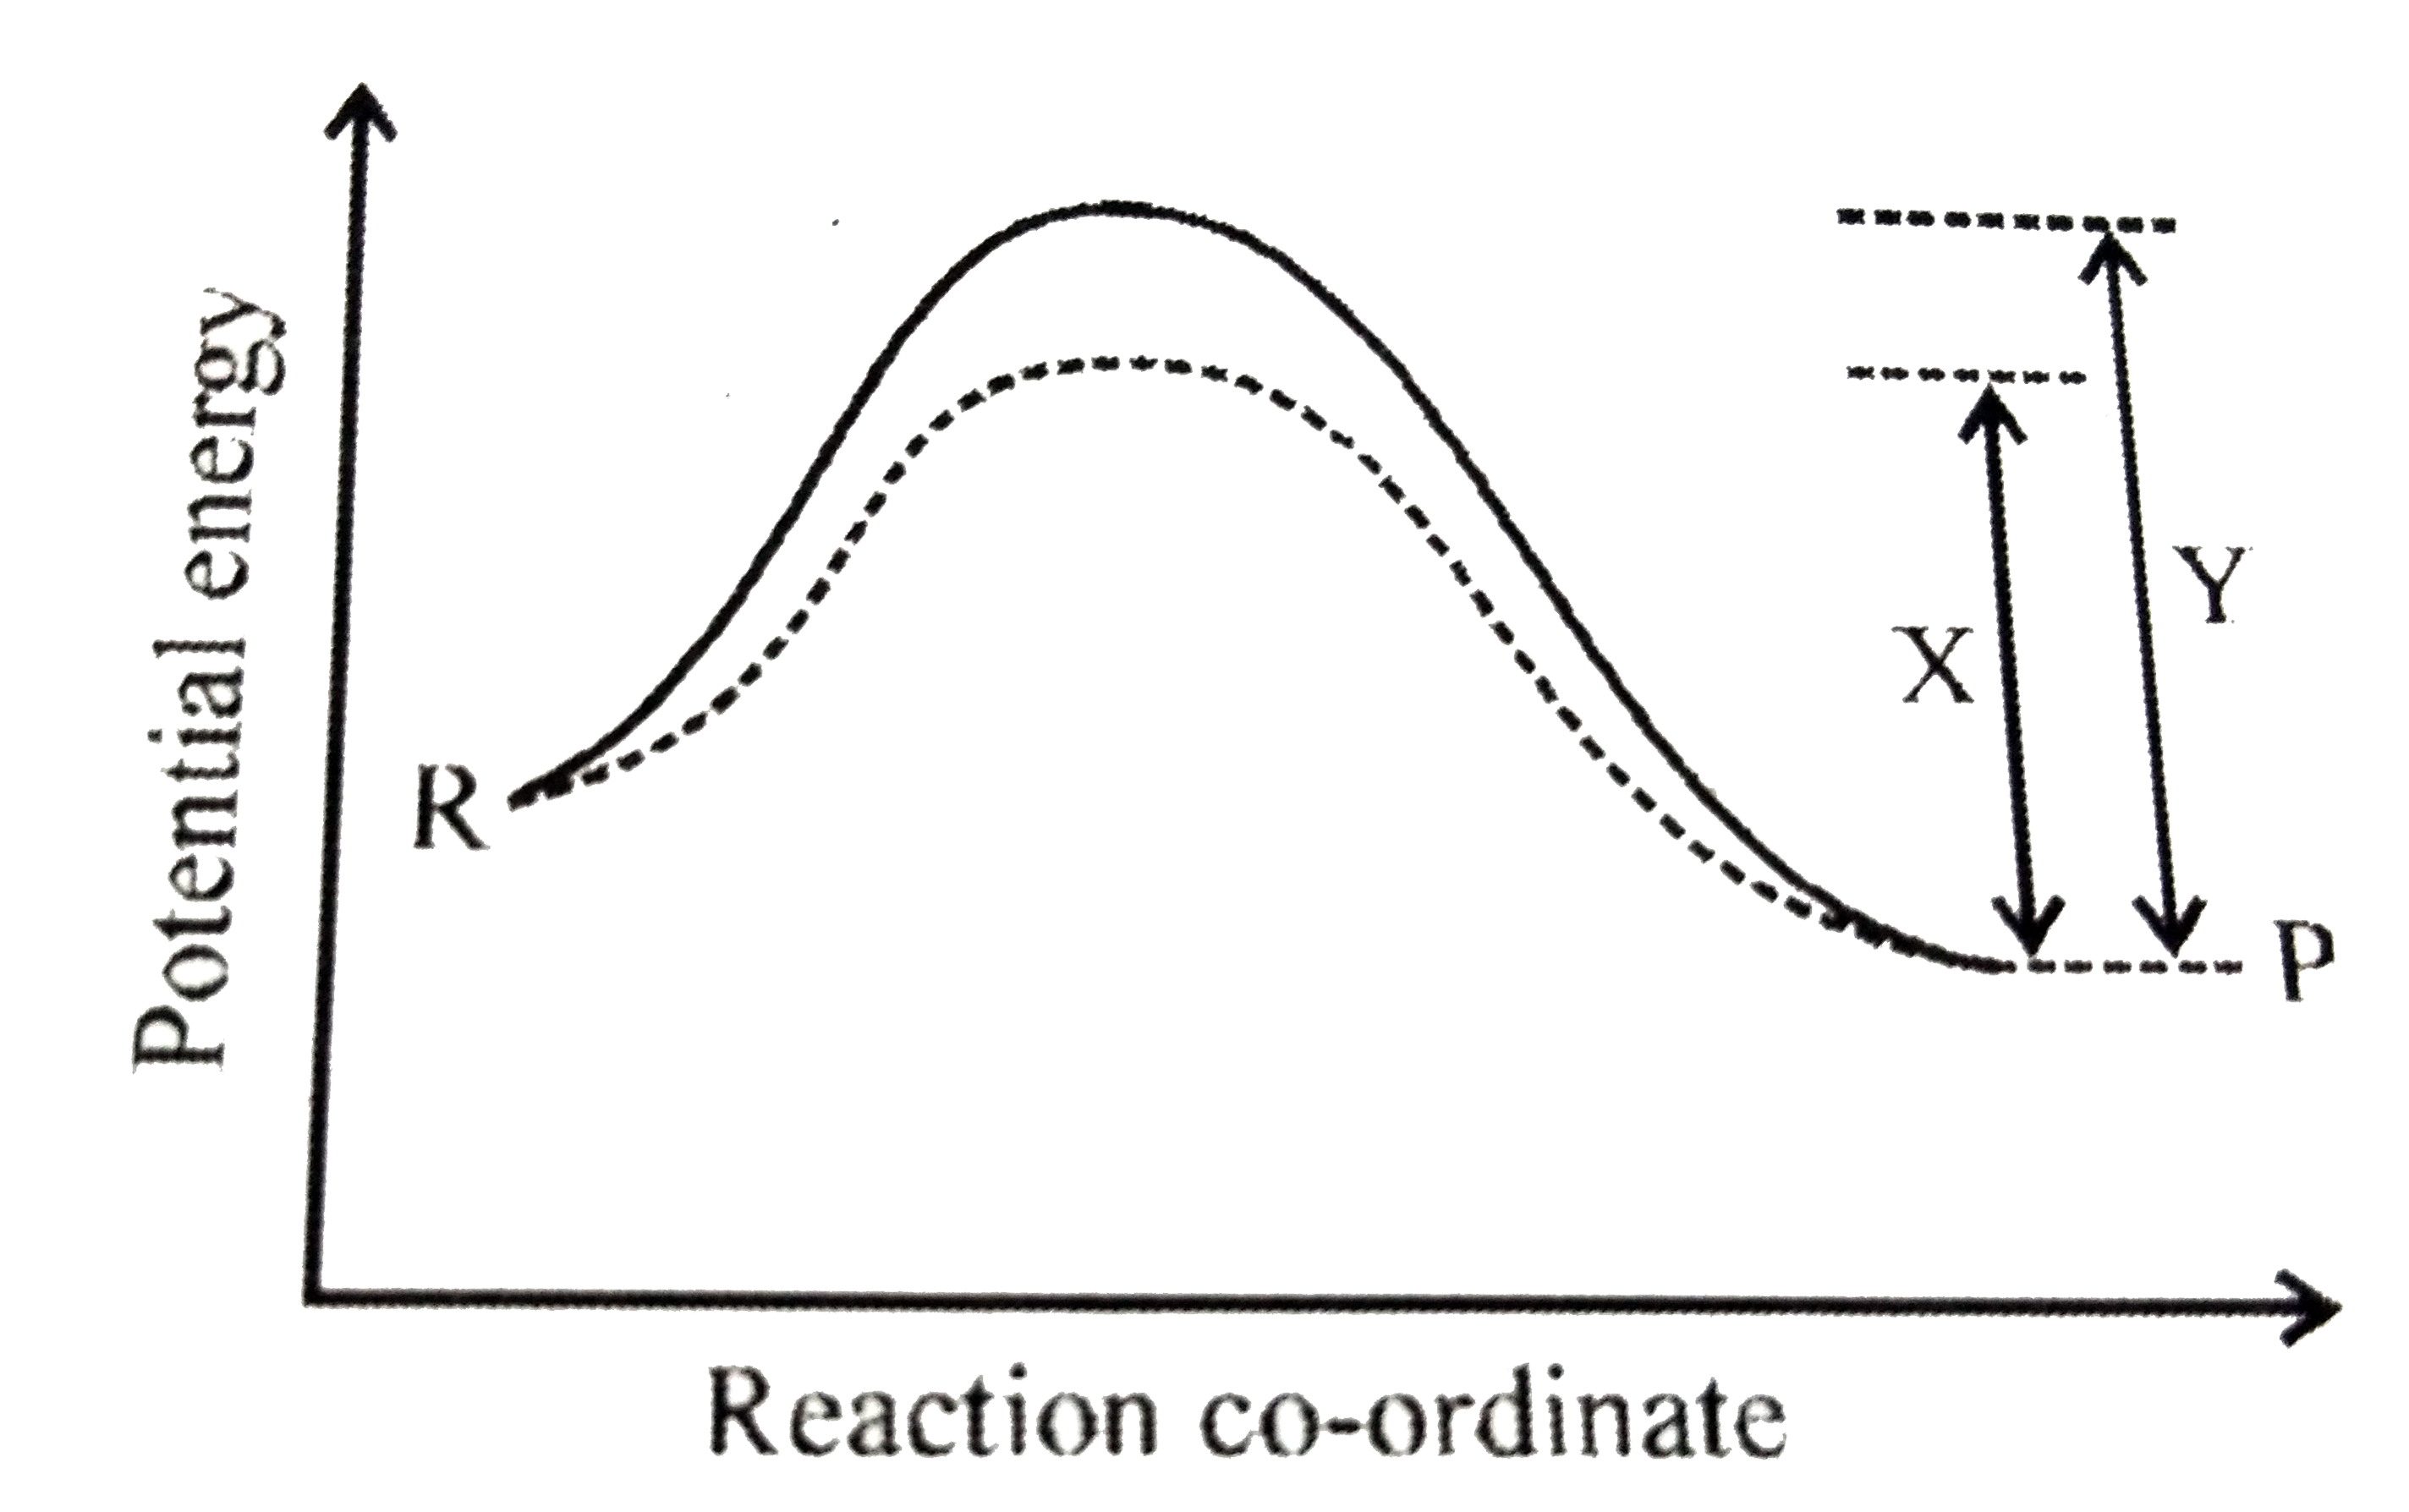
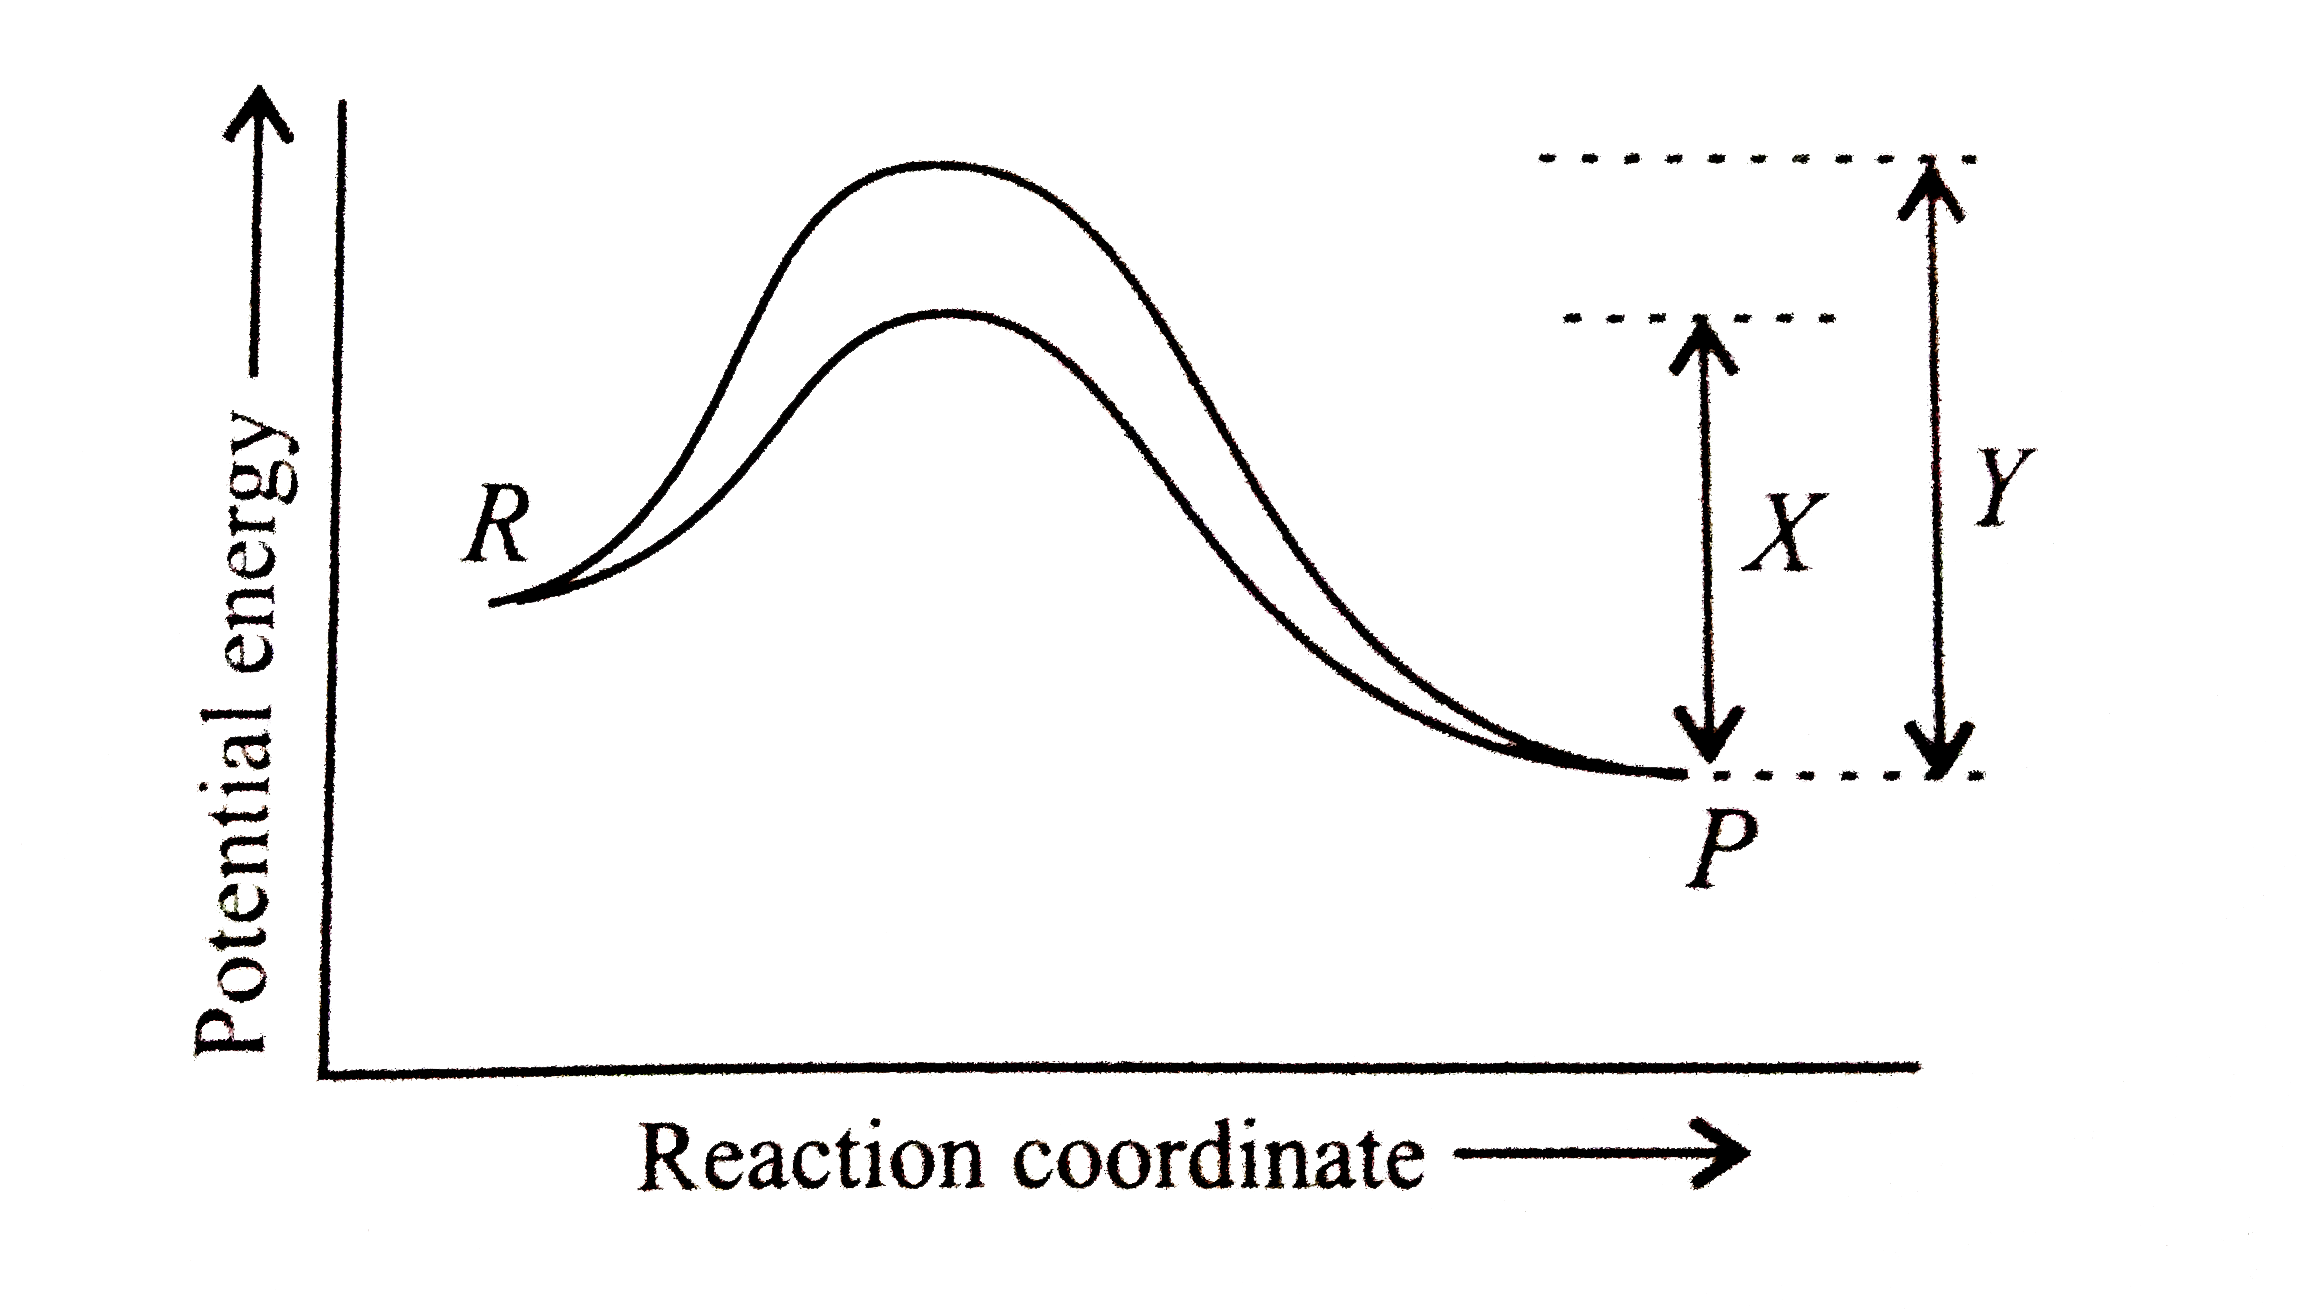
The graph of the effect of catalyst on activation energy is given below. Fill up the blanks X and Y with appropriate statements
View SolutionIn the graph below. where N is population size and tis time. M represents

View SolutionIn the circuit shown below, the internal resistance of the cell is negligible. The distance of the slider from the left-hand end of the slide wire is l. The graph shows the variation with l of the current I in the cell.

E.M.F. of the cell is:
View SolutionIn the given figure l||m and n is the transversal , find x.
View Solutionn,l,m are three lines in the same plane. If l intersects m and nllm, then find the relation betweenl and n.
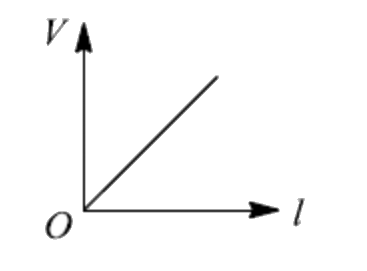
View SolutionThe V – I graph for a wire of copper of length L and cross -section area A is shown in the figure below . The slope of the graph will be
View Solution


