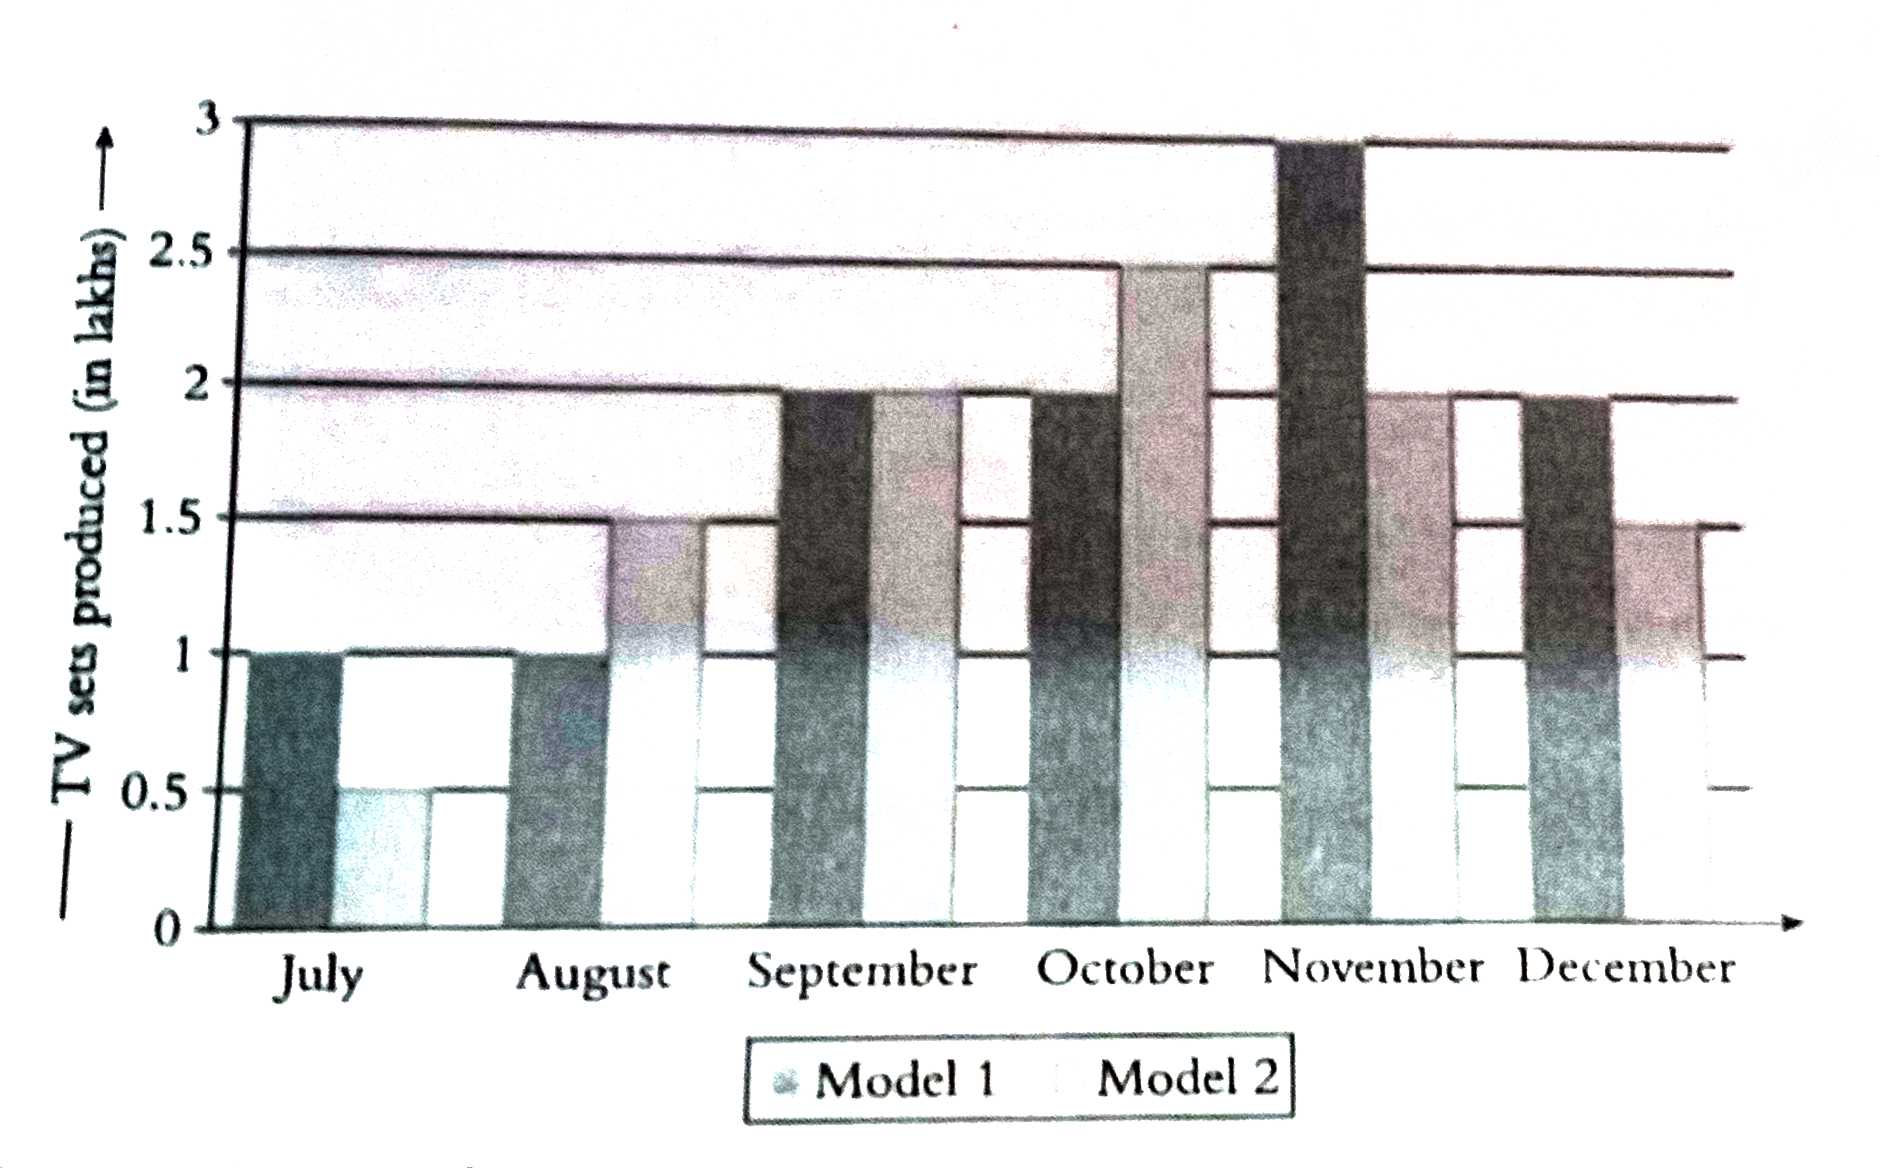
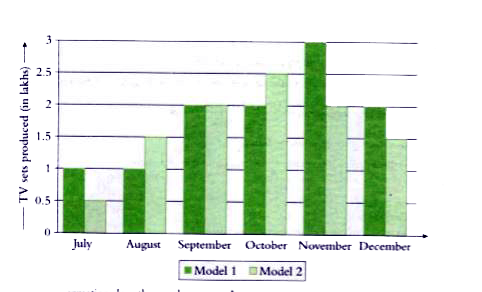
Two different models of TV sets are produced in a factory and are given below as a double bar graph. Read the data and answer the following questions :
(A) What information does the graph represent ?
(b) In which month, both the models of TV sets produced are equal ?
(c) In which month, both the model of TV sets produced are maximum ?
(d) In which month, both the models of TV sets produced are minimum and how many are they ?
(a) Two different types of TV sets are produced each month in a factory.
(b) September
(c) November
(d) July, a total of 1.00+0.5=1.5 lakhs TV sets.
Topper's Solved these Questions
- STATISTICSBOOK - PEARSON IIT JEE FOUNDATIONCHAPTER - STATISTICSEXERCISE - Very Short Answer Type
37 Videos
- STATISTICSBOOK - PEARSON IIT JEE FOUNDATIONCHAPTER - STATISTICSEXERCISE - Short Answer Type
21 Videos
- SIMPLE INTEREST AND COMPOUND INTEREST BOOK - PEARSON IIT JEE FOUNDATIONCHAPTER - SIMPLE INTEREST AND COMPOUND INTEREST EXERCISE - Level 3
9 Videos
Similar Questions
Two different models of TV sets are produced in a factory and are given below as a double bar graph. Read the data and answer the following questions:
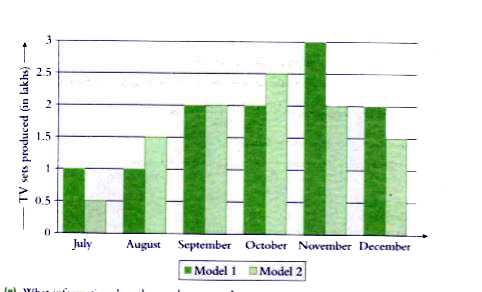
What information does the graph represent?
View SolutionTwo different models of TV sets are produced in a factory and are given below as a double bar graph. Read the data and answer the following questions:
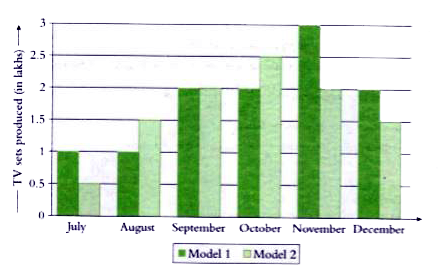
In which month, both the models of TV sets produced are equal?
View SolutionTwo different models of TV sets are produced in a factory and are given below as a double bar graph. Read the data and answer the following questions:
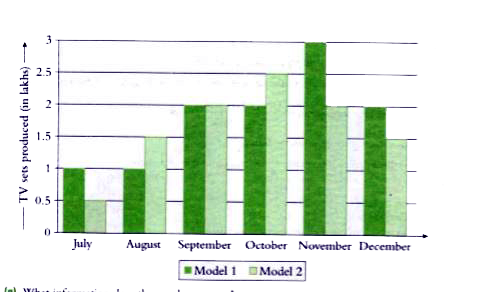
In which month, both the models of TV secs produced are maximum?
View SolutionRead the graph and answer the following questions
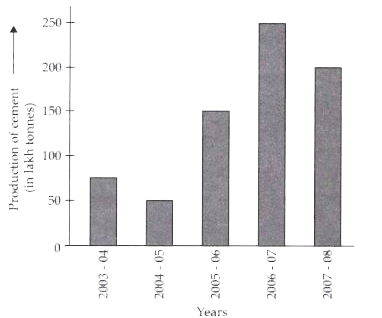
What information is conveyed by the bar graph
View SolutionTwo different models of TV sets are produced in a factory and are given below as a double bar graph. Read the data and answer the following questions:
In which month, both the models of TV sets produced are minimum and how many are they?
View SolutionRead the bar graph and answer the following questons.
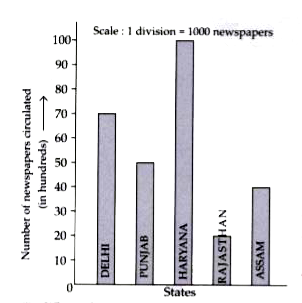
What information is given by graph ?
View SolutionRead the bar graph given below and answer the following questions:
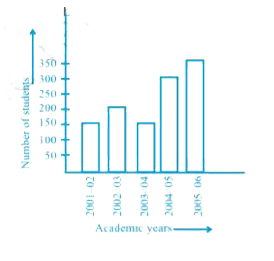
What information is given by the þar graph?
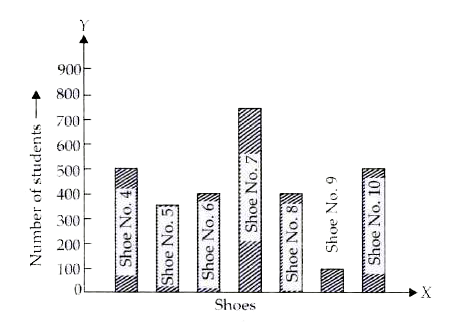
View SolutionRead the bar graph shown in figure and answer the following questions.
What is the information given by the bar graph?
View SolutionNumber of wrist watches manufactured by a factory in six days of a particular week is given below.
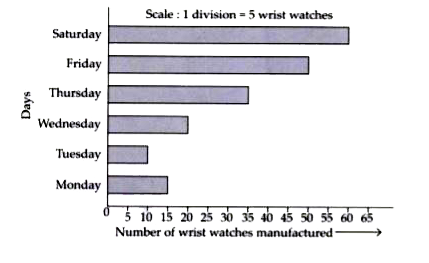
Read the bar graph and answer the following questions.
What information does the bar graph gives ?
View SolutionRead the following bar graph given in figure and answer the following questions.
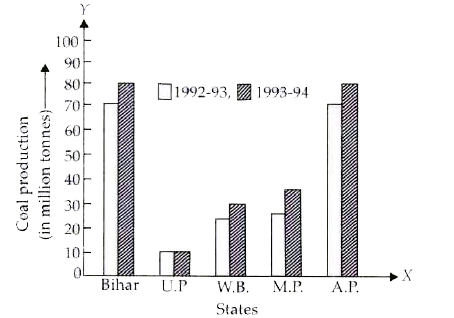
(i) What information is given by this bar graph?
View Solution
