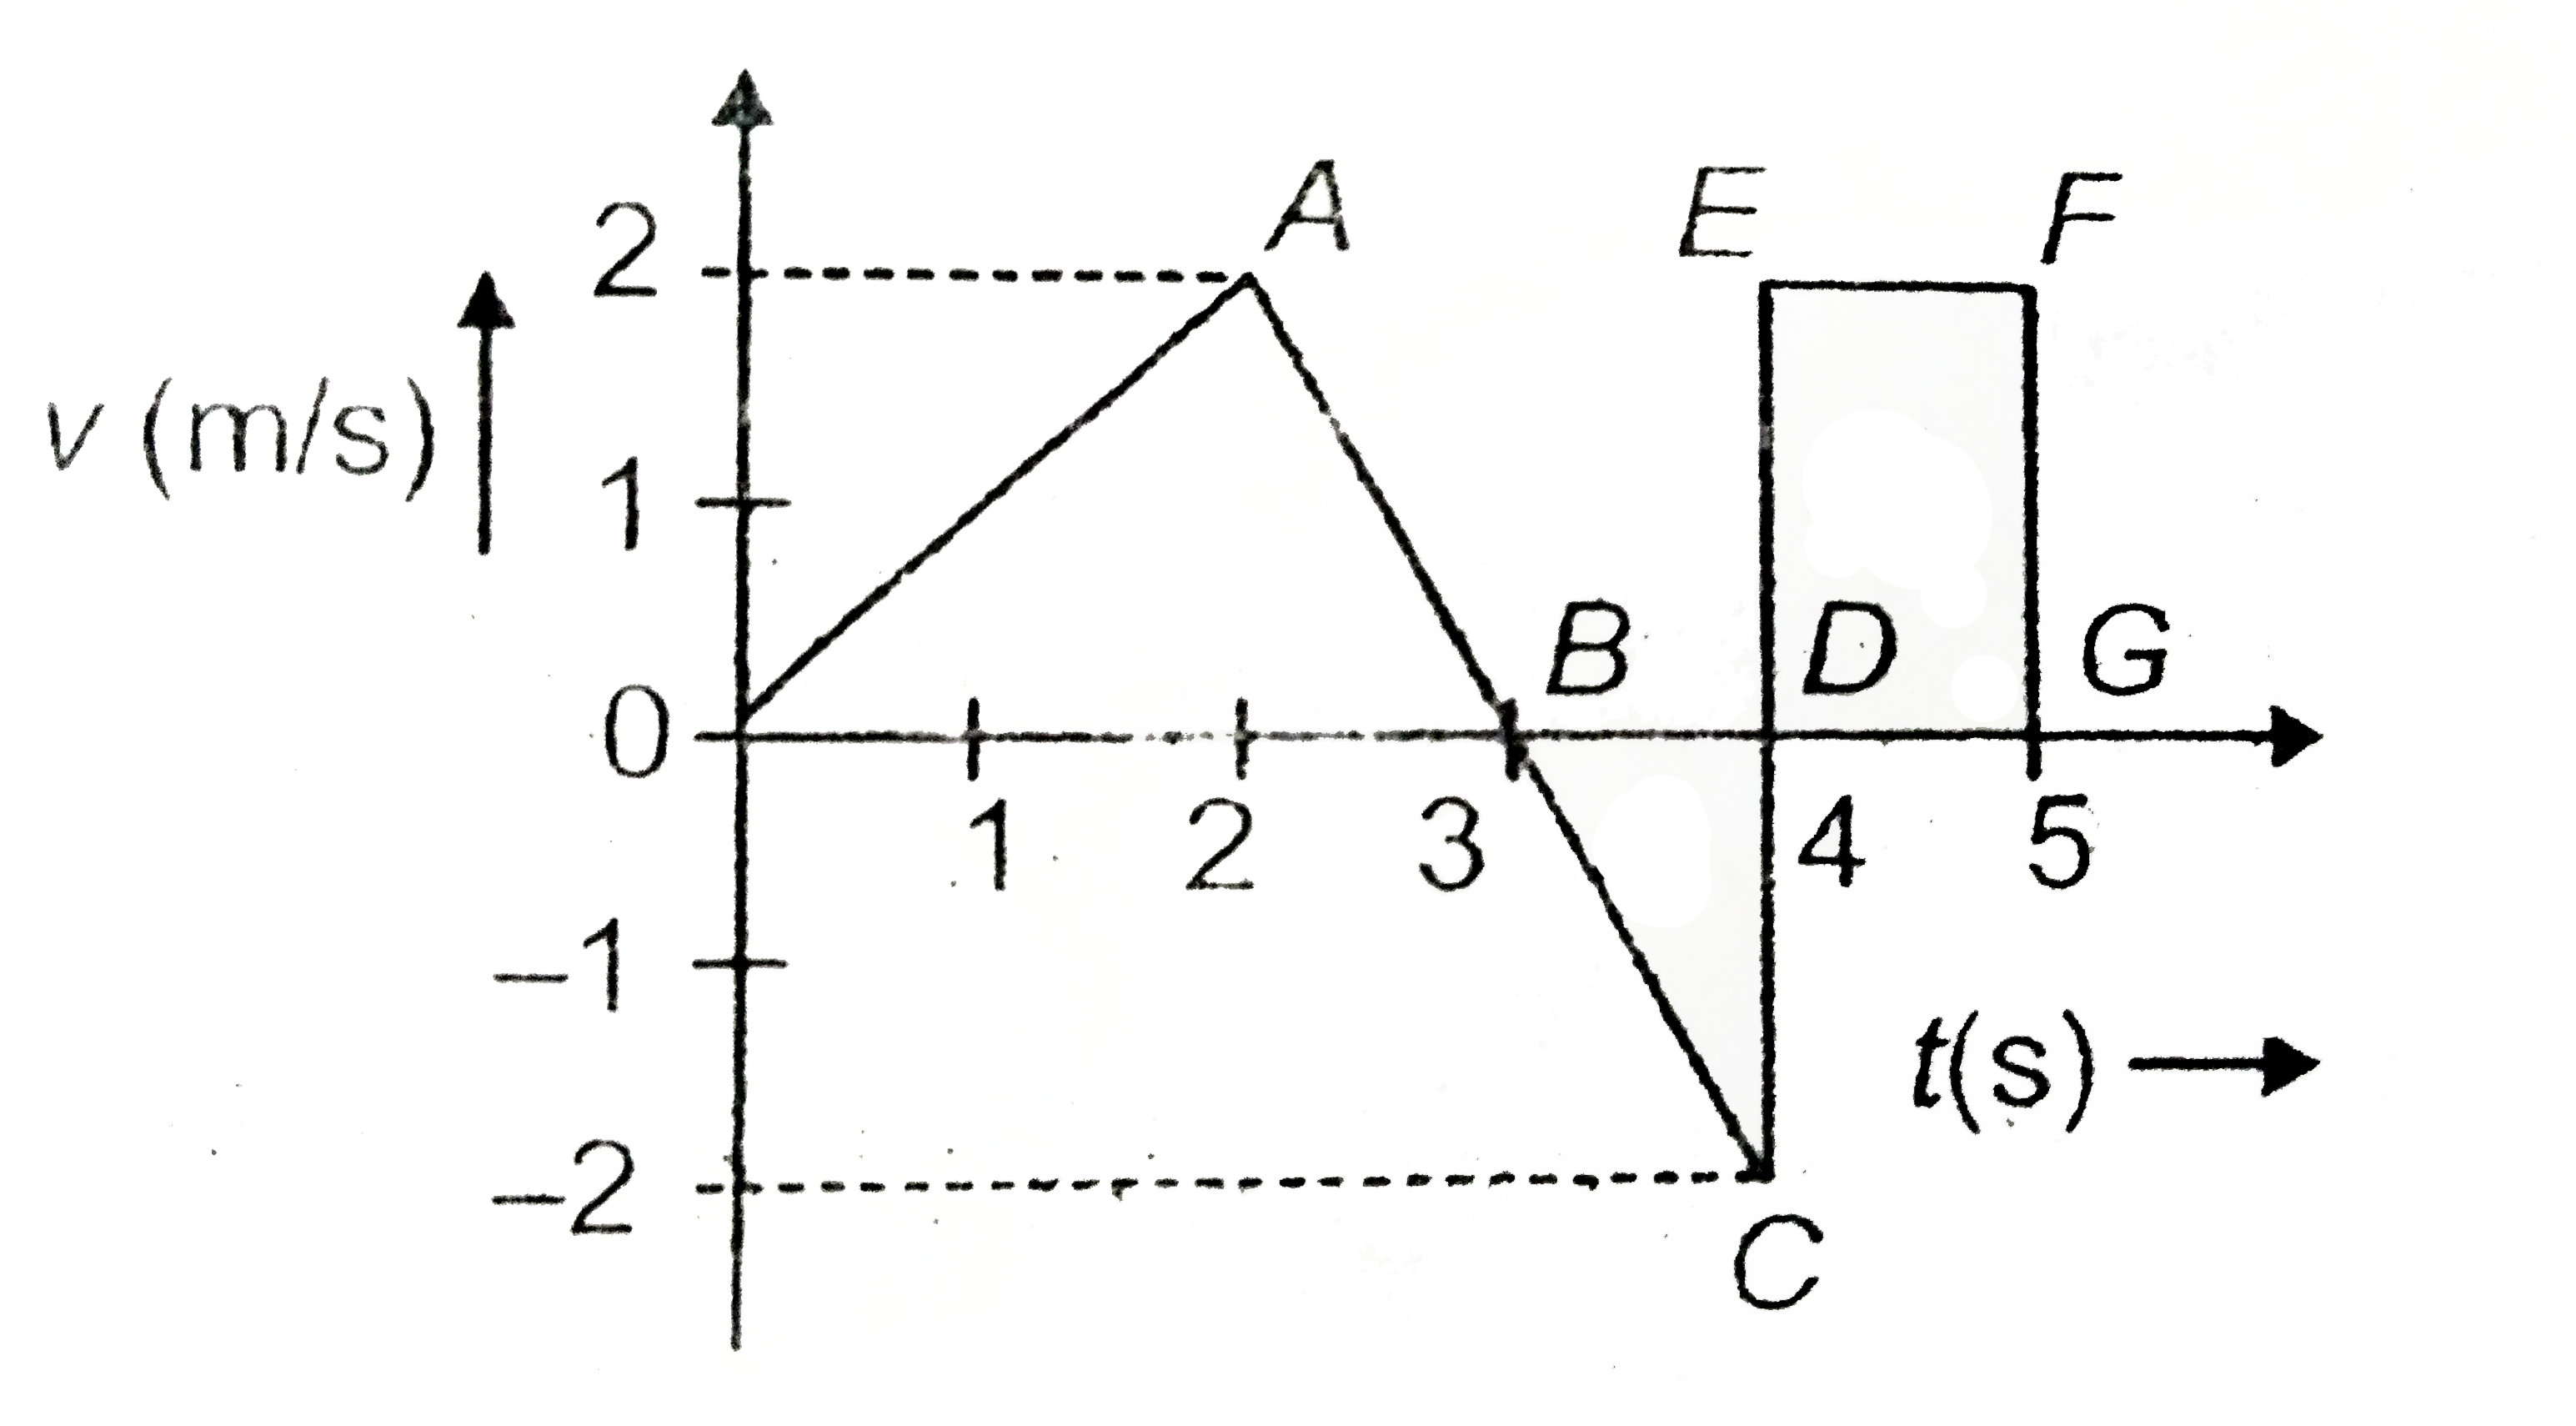
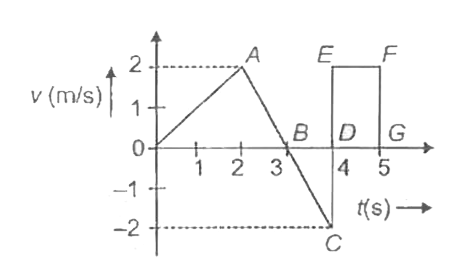
The velocity-time graph of a body moving in a straight line is shown in the figure.
A
8,16
B
16,8
C
16,16
D
8,8
Video Solution
Text Solution
The correct Answer is:A
area of v -t graph
|
Similar Questions
Knowledge Check
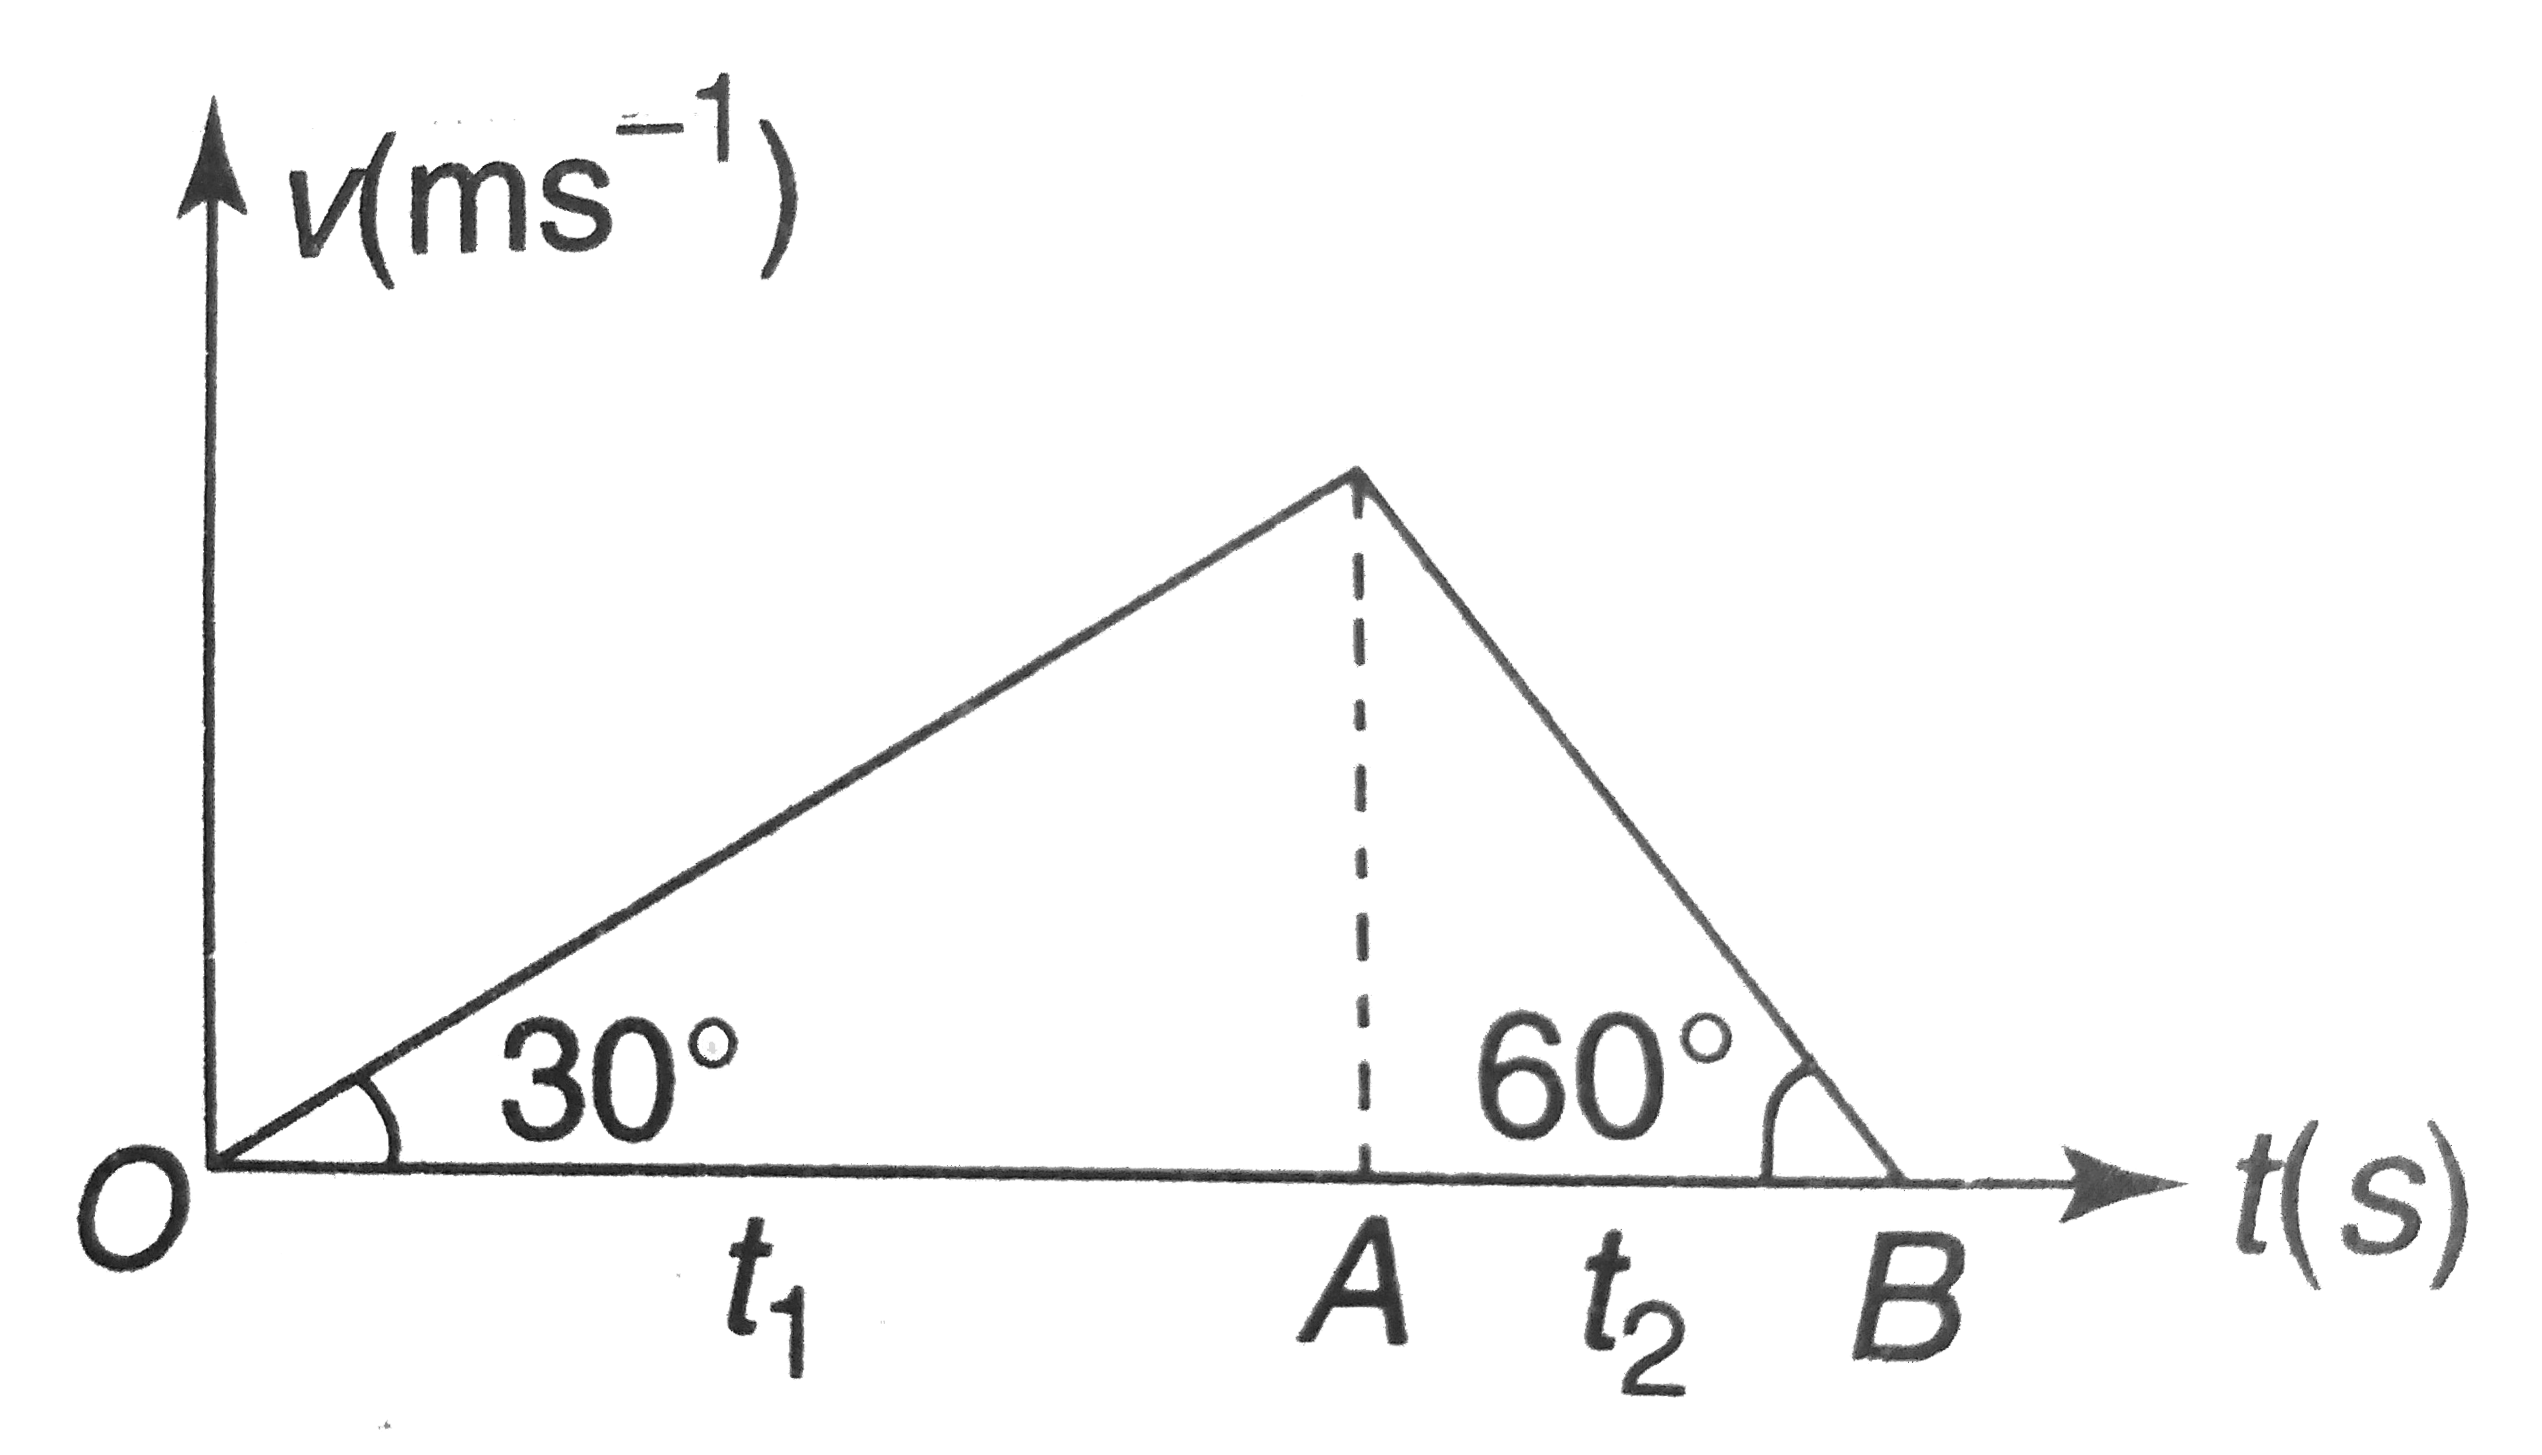
The velocity time graph of a body moving along a straight line is shown in figure. The ratio of the average velocities during the time t1 and t2 is.
 A1:1B2:1C3:1D1:3
The velocity versus time graph of a body moving in a straight line is as shown in the figure below
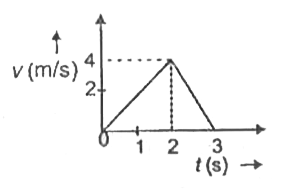 AThe distance covered by the body in 0 to 2s is 8mBThe acceleration of the body in 0 to 2s is 4ms−2CThe accelerationof the body in 2 to 3s is 4ms−2DThe distance moved by the body during 0 to 3 is 6 m
The velocity-time graph of a body moving in a straight line is shown below:

Which one of the following represents its acceleration time graph?A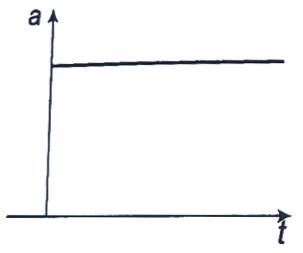 B
B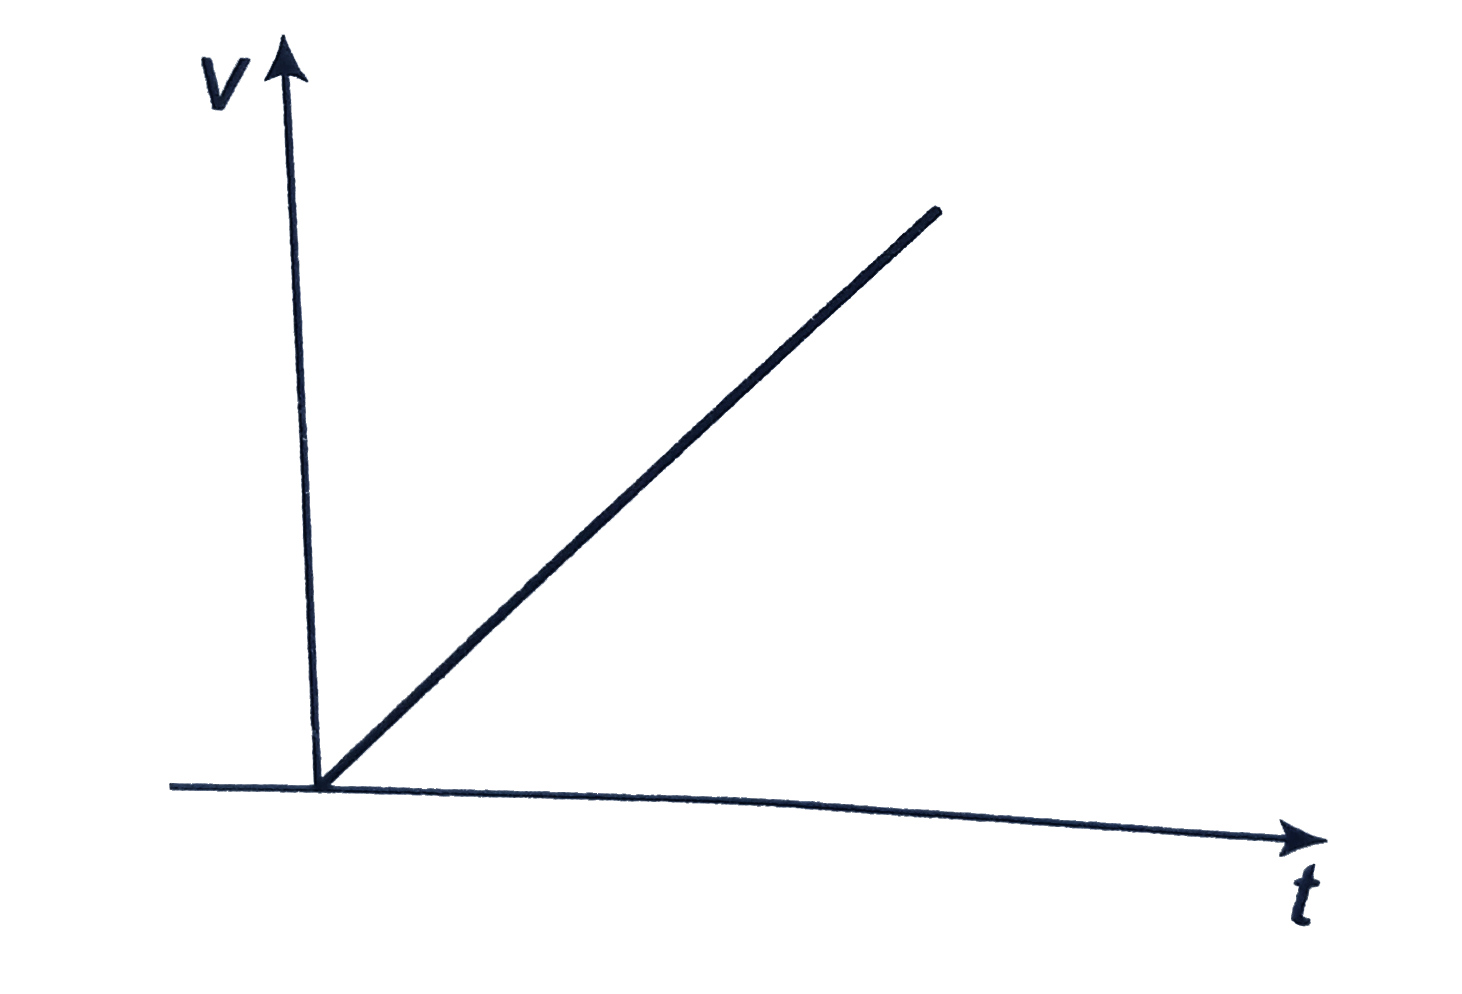 C
C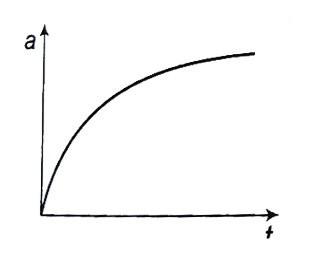 D
D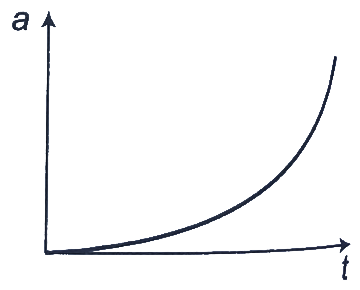
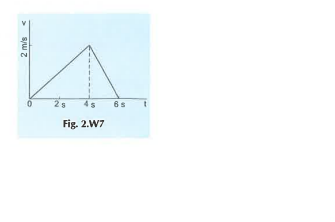
The velocity-time graph of a particle moving along a straight line is shown in Figure 2.W7.
Does the particle change its direction of motion ?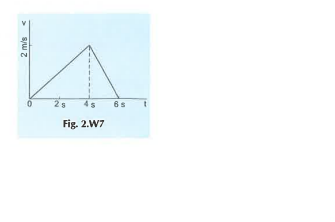
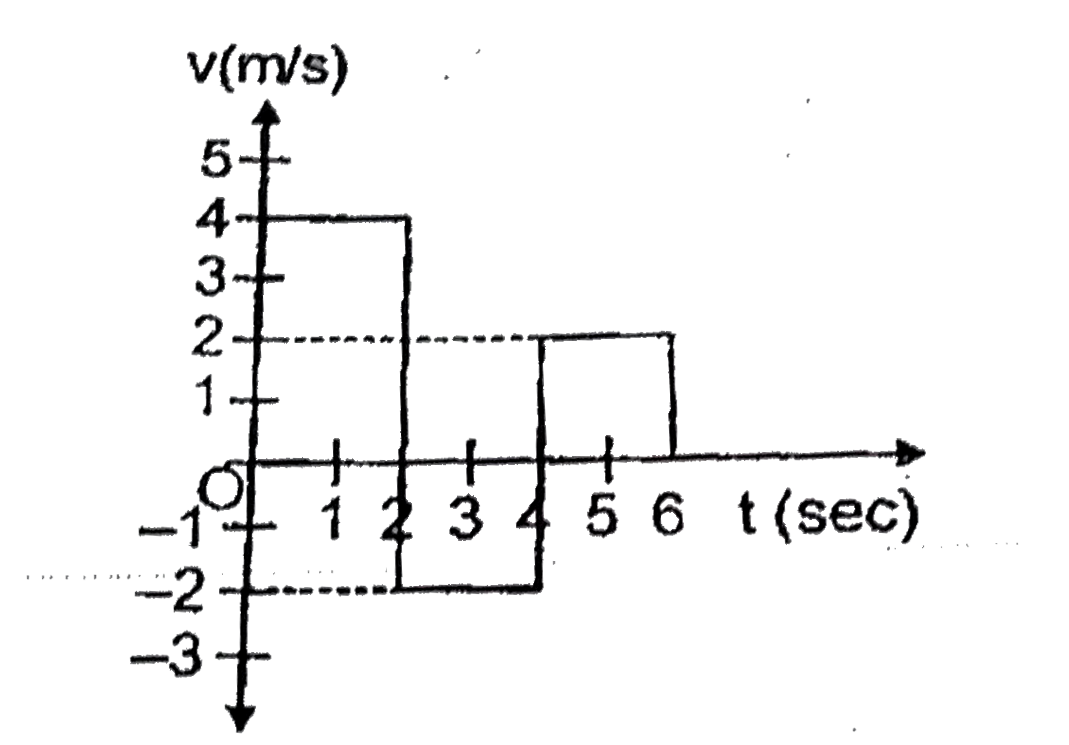
View SolutionThe velocity time graph of a body moving in a straight line is as follows. Find the magnitude of displacement of body and distance travelled by body during first 6 seconds.
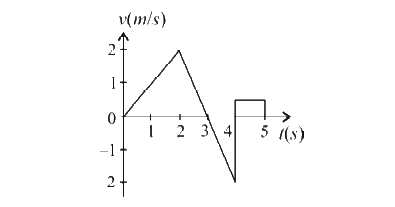
View SolutionThe velocity versus time graph of a body in a straight line is as shown in figure. The displacment of the body in five seconds is
View SolutionThe velocity-time plot for a particle moving on a straight line is shown in the figure, then
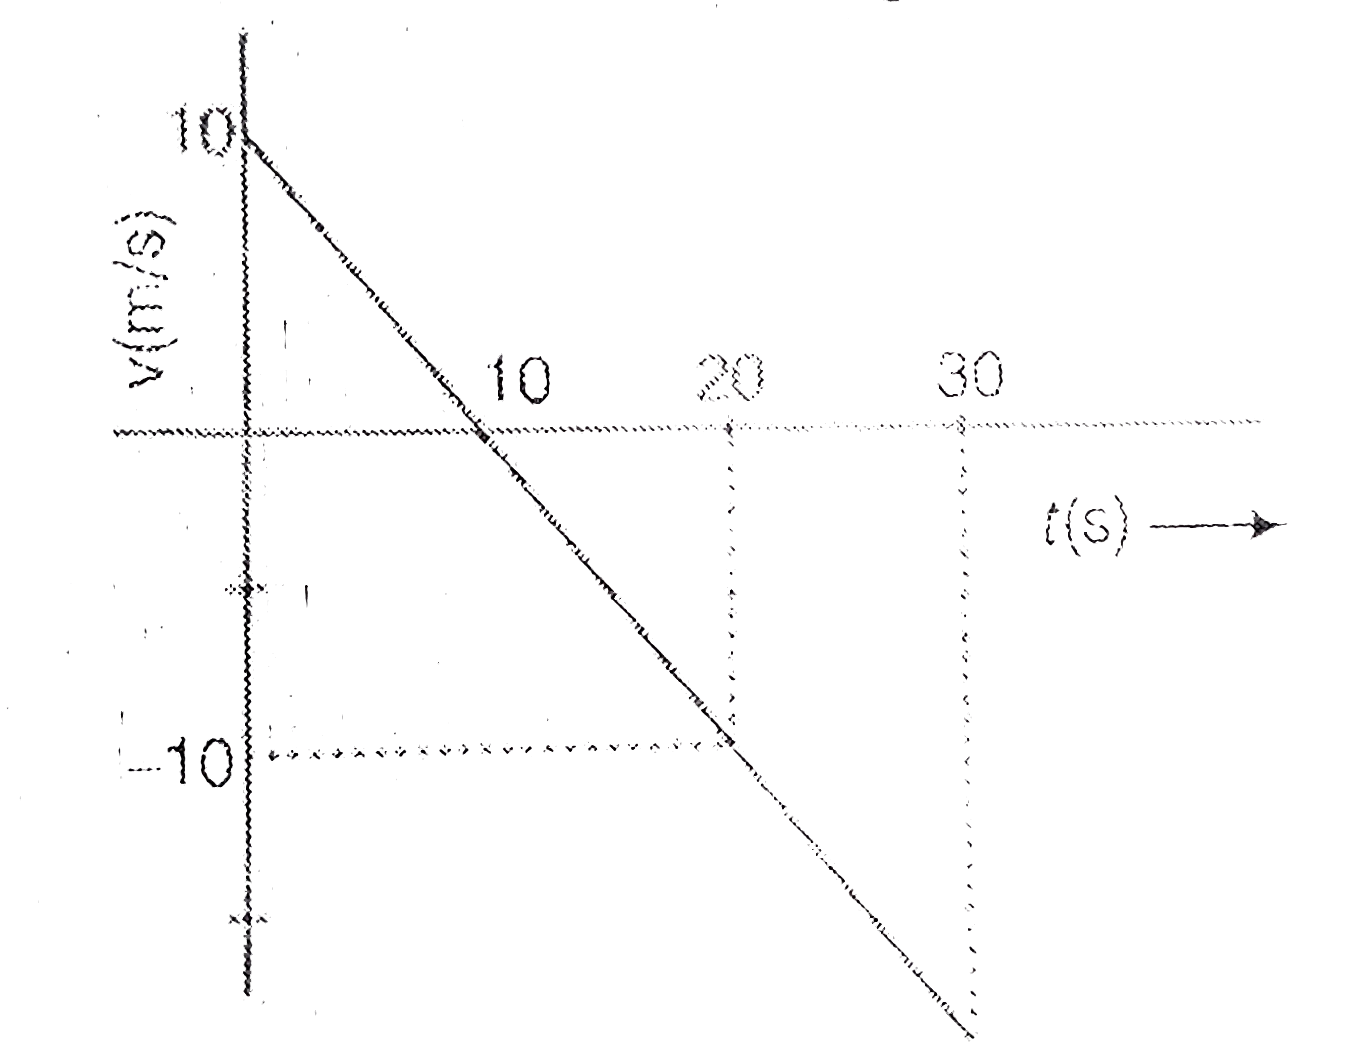
View SolutionThe velocity - time graph of a particle moving along a straight line is shown in the figure given below
The displacement of the particle in 5 second is
View Solution

