Given below is the bar graph showig the number of scooters produced in a factory during the first five months of a year.
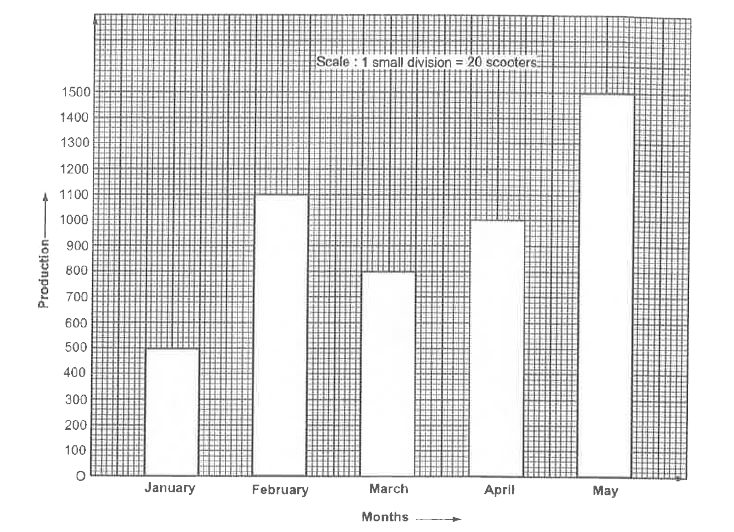
Read the above bar graph carefully nd answer the question given below:
How many scooters were produced in the month of March?
What was the increase in proudction in Feberuary over the production in January ?
What was teh decrease in proudction in March in comparison to the production in February ?
In which month was the production minimum and what was it ?
(i) 800 scooters
(ii) 600 scooters
(iii) 300 scooters less in March
(iv) Minimum production in january =500
(i) 700 scooters
(ii) 500 scooters
(iii) 300 scooters less in March
(iv) Minimum production in january =500
(i) 900 scooters
(ii) 600 scooters
(iii) 300 scooters less in March
(iv) Minimum production in january =200
(i) 750 scooters
(ii) 550 scooters
(iii) 300 scooters less in March
(iv) Minimum production in january =500
The correct Answer is:A
Step by step video, text & image solution for Given below is the bar graph showig the number of scooters produced in a factory during the first five months of a year. Read the above bar graph carefully nd answer the question given below: How many scooters were produced in the month of March? What was the increase in proudction in Feberuary over the production in January ? What was teh decrease in proudction in March in comparison to the production in February ? In which month was the production minimum and what was it ? by Maths experts to help you in doubts & scoring excellent marks in Class 6 exams.
Updated on:21/07/2023Topper's Solved these Questions
- BAR GRAPH BOOK - RS AGGARWALCHAPTER - BAR GRAPH EXERCISE - EXERCISE
4 Videos
- ANGLES AND THEIR MEASUREMENTBOOK - RS AGGARWALCHAPTER - ANGLES AND THEIR MEASUREMENTEXERCISE - EXERCISE D
13 Videos
- CIRCLESBOOK - RS AGGARWALCHAPTER - CIRCLESEXERCISE - C. WRITE T FOR TRUE AND F FOR FALSE FOR EACH OF THE STATEMENTS GIVEN BELOW:
1 Videos
Similar Questions
Knowledge Check
Examine the following graph carefully and answer the questions given below it :
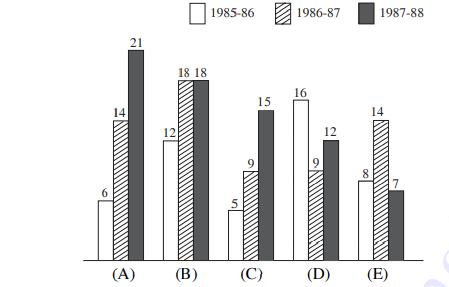
How many tonnes of cotton was produced by state E during the given period ?A2900B29000C290000D2900000Study the given bar graph carefully and answer the questions based on it.
Production (in lakh tonne) of wheat from 2005-10
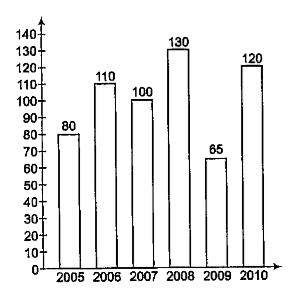
What is the mean production for all the years?A100.83 lakh tonneB110.5 lakh tonneC98.72 lakh tonneDNone of the aboveStudy the following graph carefully and answer the questions given below it -----
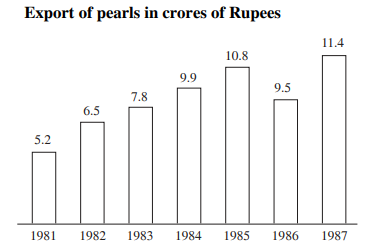
In how many years was the export above the average for the given period ?A2B3C4D5
Given here is a bar graph showing the number of cycles produced in a factory during five consecutive weeks.
Observe the graph and answer the questions based on this graph.
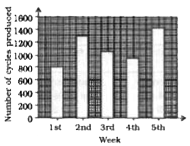
The number of cycles produced in the 5th week is
View SolutionRead the following graph carefully and answer the questions given below:
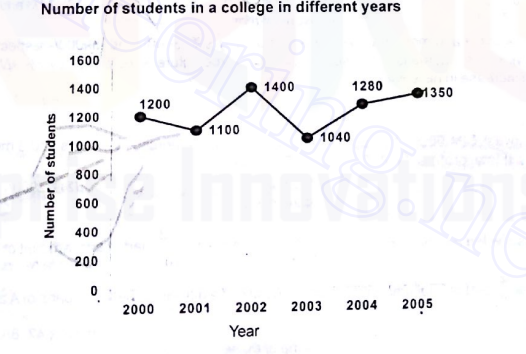
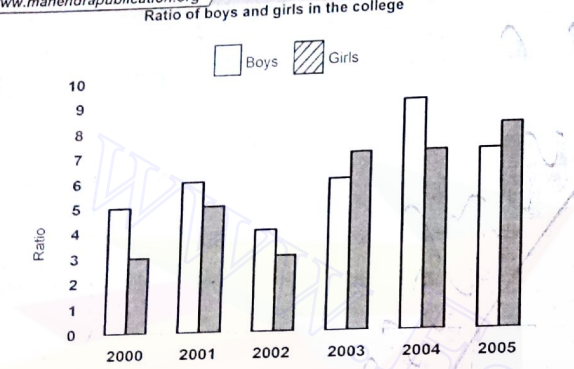
What is the difference between the number of boys and girls in the year 2004 ?
View SolutionStudy the following graph and answer the questions given below it.
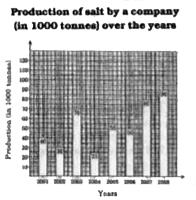
In how many of the given years was the production of salt more than the average production of the given years?
View SolutionThe bar-chart is showing the number of accidents in a city during the first six month of a year. Examine the bar chart and answer the following questions.
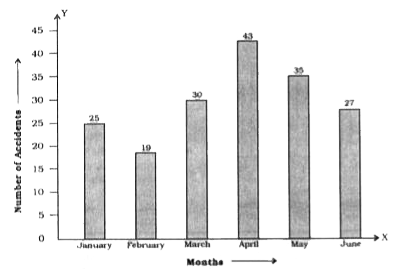
What is the percentage of accidents in the month of April to the total accidents in the city ?
View SolutionThe bar graph shows the number of toys produced by a factory during a certain week.
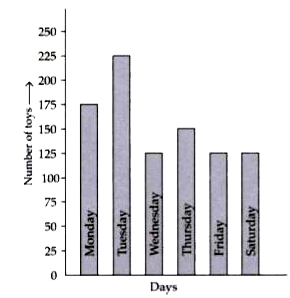
What is the total number of toys produced during the week ?
View Solution
