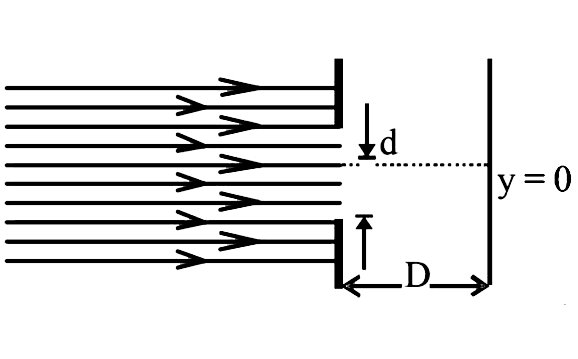
In an experiment, electrons are made to pass through a narrow slit of width d comparable to their de Broglie wavelength. They are detected on a screen at a distance D from the slit (see figure).<br>

Which of the following graphs can be expected to represent the number of electrons N detected as a function of the detector position y (y=0 corresponds to the middle of the slit ).
_E01_230_O01.png)
_E01_230_O02.png)
_E01_230_O03.png)
_E01_230_O04.png)
The correct Answer is:D
Step by step video, text & image solution for In an experiment, electrons are made to pass through a narrow slit of width d comparable to their de Broglie wavelength. They are detected on a screen at a distance D from the slit (see figure). Which of the following graphs can be expected to represent the number of electrons N detected as a function of the detector position y (y=0 corresponds to the middle of the slit ). by Physics experts to help you in doubts & scoring excellent marks in Class 12 exams.
Updated on:21/07/2023Topper's Solved these Questions
- SIMPLE HARMONIC MOTIONBOOK - ALLENCHAPTER - SIMPLE HARMONIC MOTIONEXERCISE - Exercise-05(B)
46 Videos
- SIMPLE HARMONIC MOTIONBOOK - ALLENCHAPTER - SIMPLE HARMONIC MOTIONEXERCISE - MCQ s
8 Videos
- SIMPLE HARMONIC MOTIONBOOK - ALLENCHAPTER - SIMPLE HARMONIC MOTIONEXERCISE - Exercise - 04[A]
25 Videos
- RACEBOOK - ALLENCHAPTER - RACEEXERCISE - Basic Maths (Wave Motion & Dopplers Effect) (Stationary waves & doppler effect, beats)
25 Videos
- TEST PAPERBOOK - ALLENCHAPTER - TEST PAPEREXERCISE - PHYSICS
4 Videos
Similar Questions
Knowledge Check
Wave property of electrons implies that they will show diffraction effects. Davission and Germer demonstrated this by diffracting electrons from crystals. The law governing the diffraction from a crystal is obtained by requiring that electron waves reflected from the planes of atoms in a crystal interfere constructively (see figure)

In an experiment, electrons are made to pass through a narrow slit of width 'd' comparable to either de-Broglie wavelength. They are detected on a screen at a distance 'D' from the slit

The following graphs that can be expected to represent the number of electrons 'N' detected as a function of the detector position 'y' (y=0 corresponds to the middle of the slit) isA B
B C
C D
D
In a double slit experiment, the distance between the slits is d. The screen is at a distance D from the slits. If a bright fringe is formed opposite to one of the slits, its order is
AdλBλ2dDCD22λDDd22DλIn double slit experiment , the distance between two slits is 0.6mm and these are illuminated with light of wavelength 4800Å. The angular width of dark fringe on the screen at a distance 120 cm from slits will be
A8×10−4 radianB6×10−4 radianC4×10−4 radianD16×10−4 radian
In experiment of Davisson-Germer, emitted electron from filament is accelerated through voltage V then de-Broglie wavelength of that electron will be _______m.
View SolutionA parallel beam of fast moving electrons is incident normally on a narrow slit. A fluorescent screen is placed at a large distance from the slit. If the speed of the electrons is increased, which of the following statements is correct?
View SolutionIn a Young's double slit experiment (slit distance d) monochromatic light of wavelength λ is used and the figure pattern observed at a distance L from the slits. The angular position of the bright fringes are
View SolutionIn a Young's double slit experiment, (slit distance d) monochromatic light of wavelength λ is used and the fringe pattern observed at a distance D from the slits. The angular position of the bright fringes are
View SolutionIn a double-slit experiment, the slits are separated by a distance d and the screen is at a distance D from the slits. If a maximum is formed just opposite to each slit, then what is the order or the fringe so formed?
View Solution
