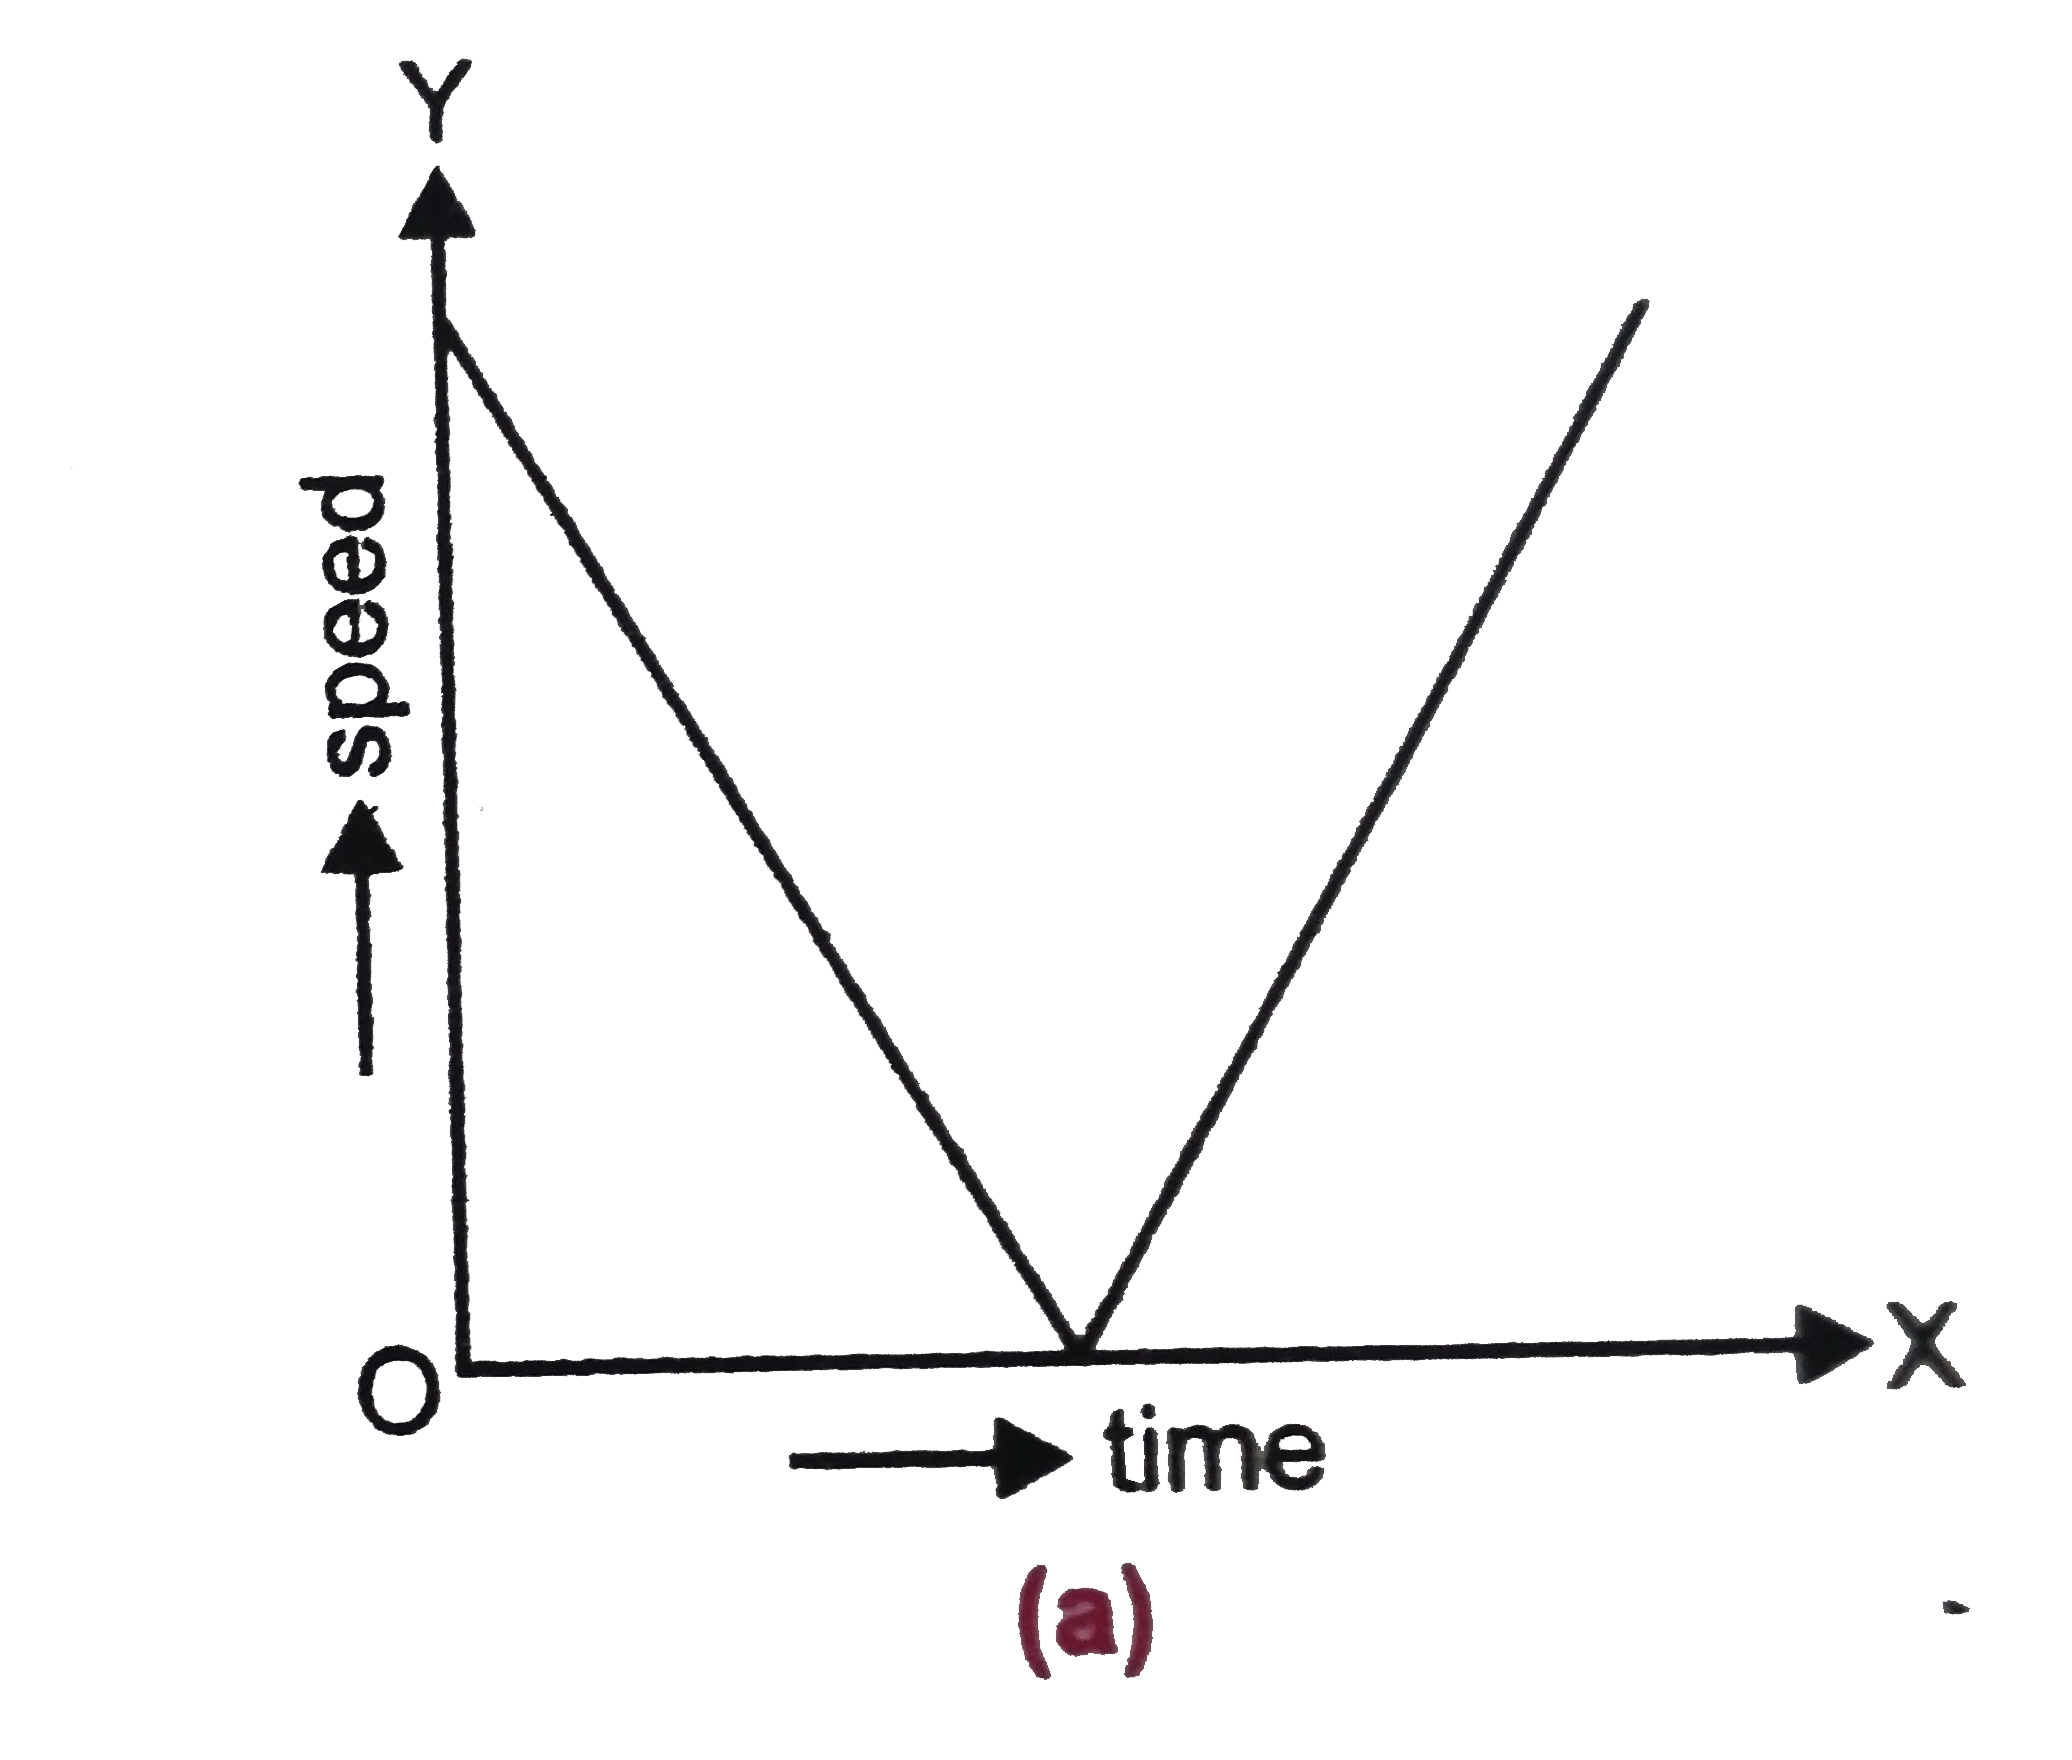
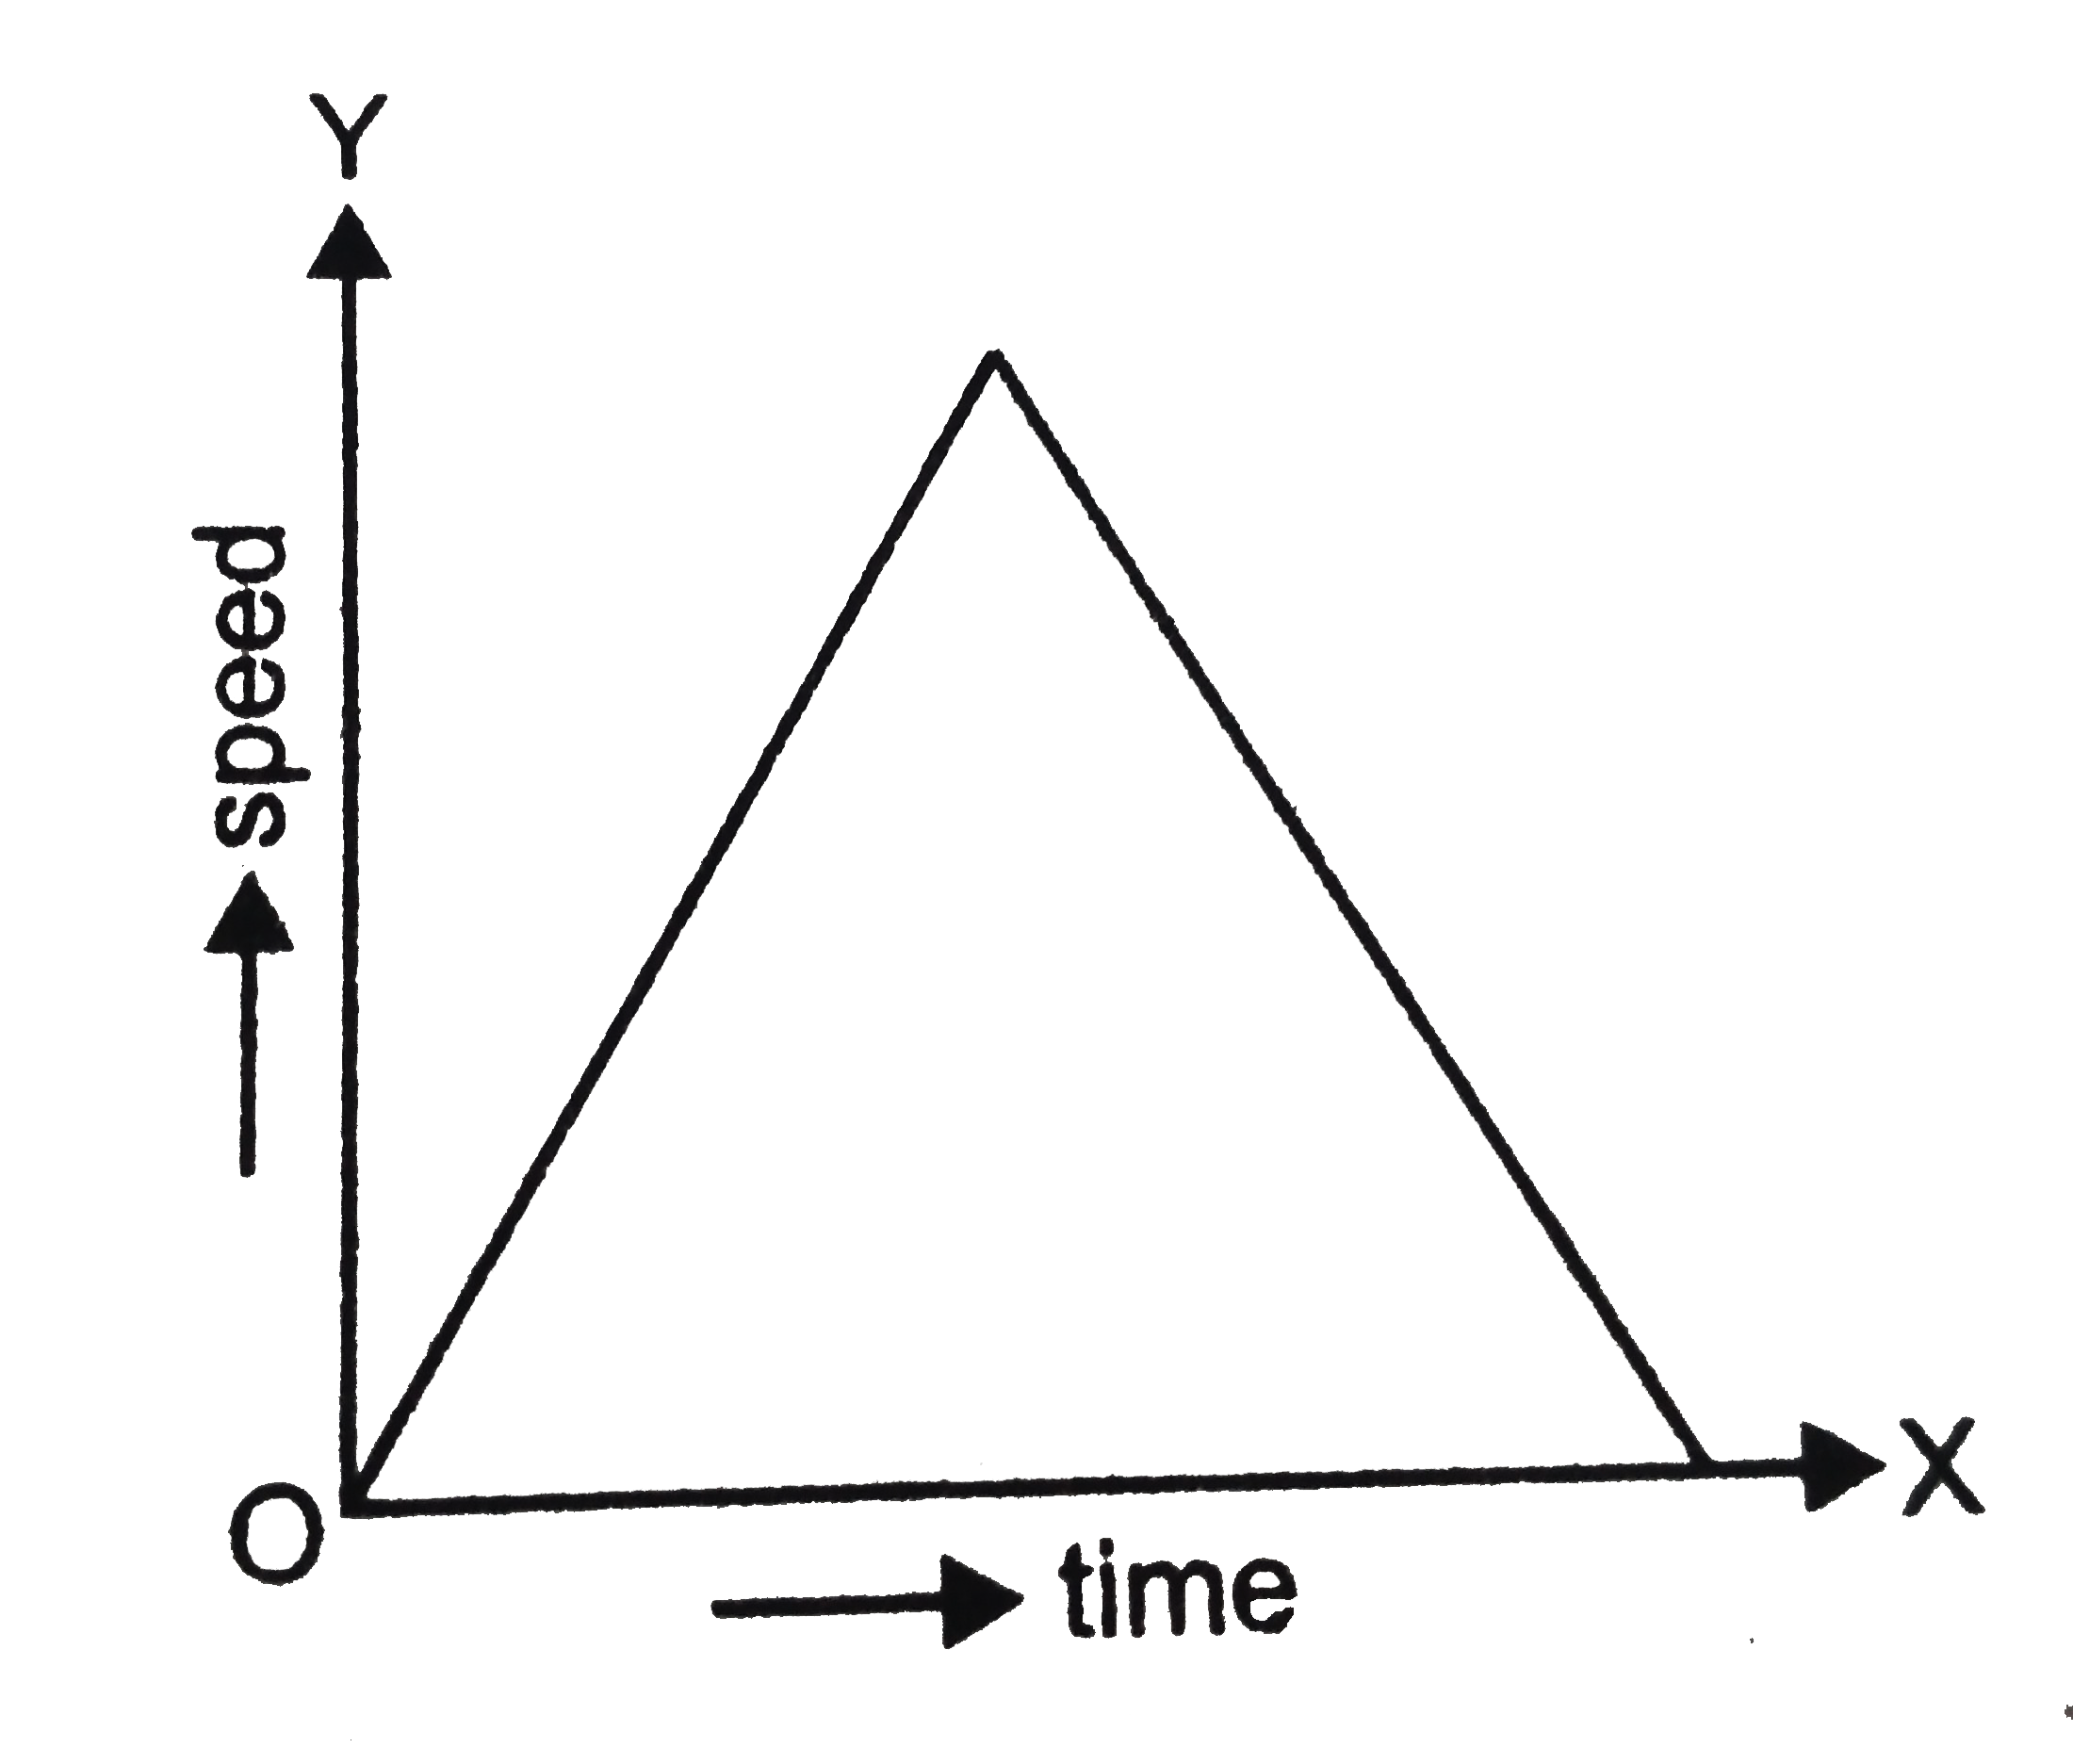
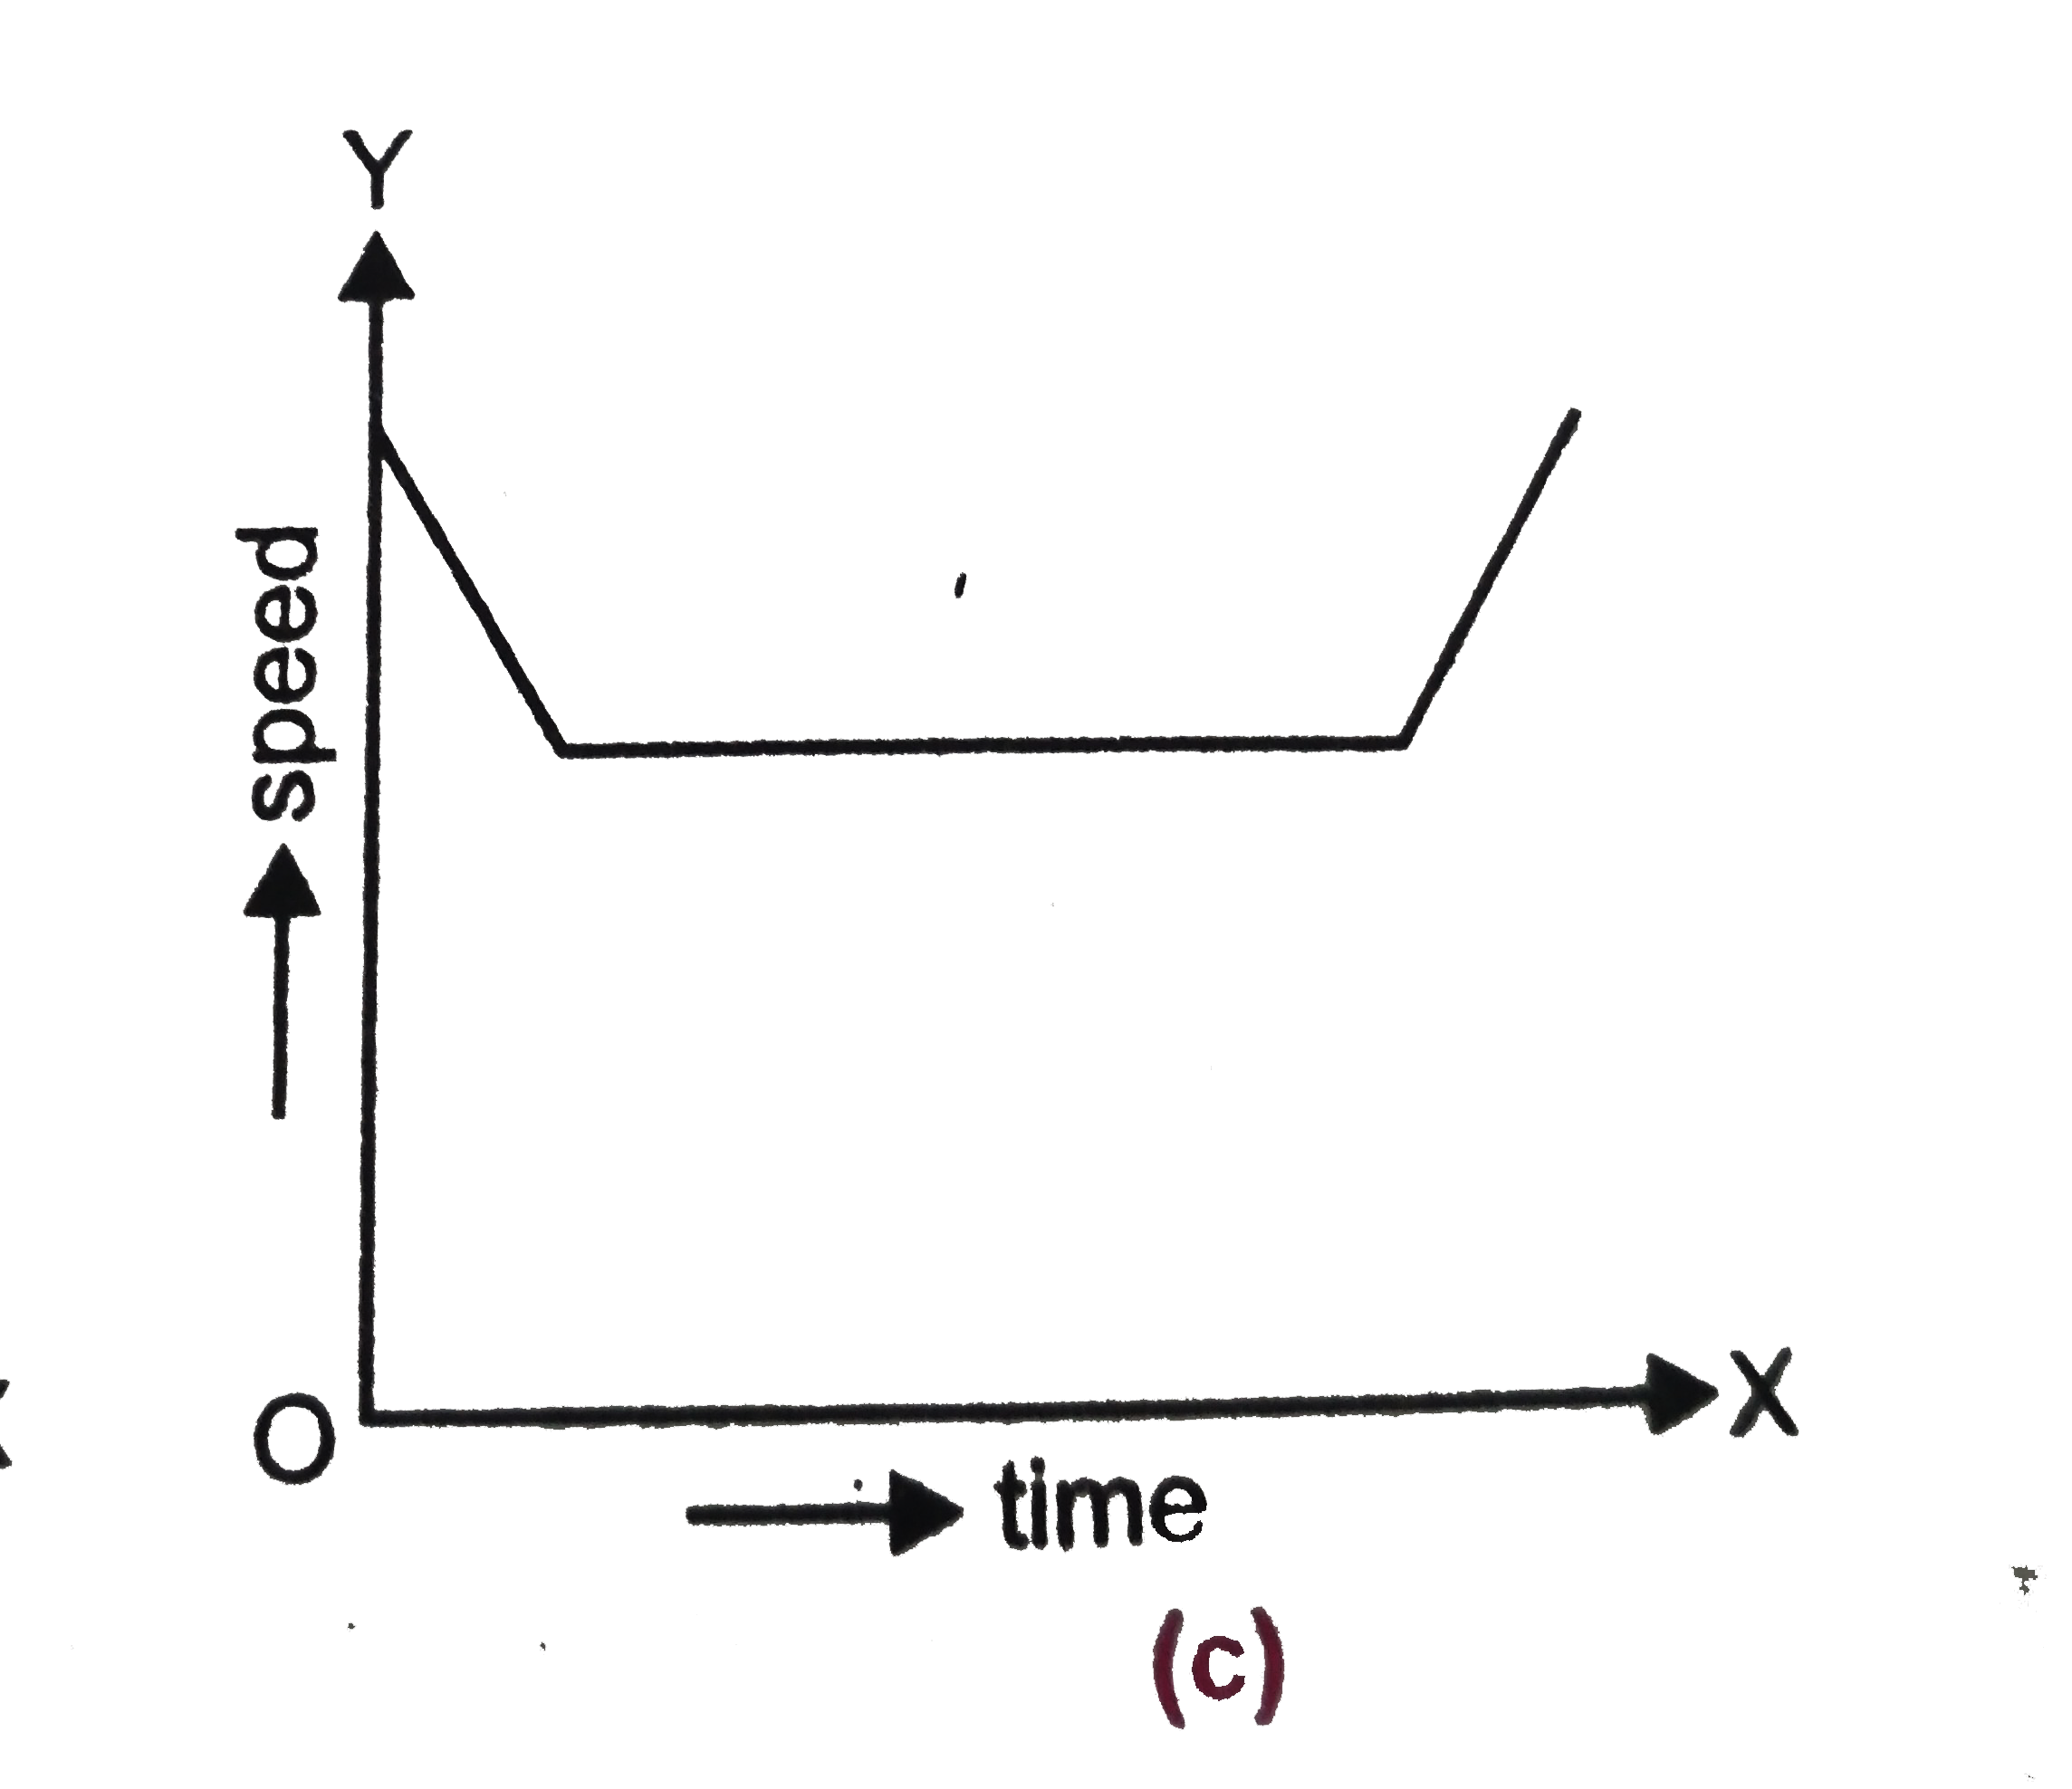
Three speed-time graphs are given below :

Which graph represents the case of :
(i) A cricket ball thrown vertically upwards and returning to the hands of the thrower ?
(ii) A trolley decelarating to a constant speed and then accelerating uniformly ?
(i) c (ii) a
Topper's Solved these Questions
- MOTION BOOK - LAKHMIR SINGH & MANJIT KAURCHAPTER - MOTION EXERCISE - SAMPLE PROBLEM
1 Videos
- MOTION BOOK - LAKHMIR SINGH & MANJIT KAURCHAPTER - MOTION EXERCISE - VERY SHORT ANSWER TYPE QUESTIONS
3 Videos
- MODEL TEST PAPER 5BOOK - LAKHMIR SINGH & MANJIT KAURCHAPTER - MODEL TEST PAPER 5EXERCISE - Section B
2 Videos
- SOUNDBOOK - LAKHMIR SINGH & MANJIT KAURCHAPTER - SOUNDEXERCISE - Value Based Questions
20 Videos
Similar Questions
Three speed-time graphs are shown below.
(i) A ball thrown vertically upwards and returning to the hand of the thrower ?
(ii) A body decelerating to a constant speed and accelerating.
View SolutionA ball thrown vertically upward returns to its starting point in 4 s. Find its initial speed.
View Solution
Knowledge Check
A ball throuwn vertically upwards with a speed of 19.6ms−1 from the top of a tower returns to the earth in 6s. Find the height of the tower.
A40 mB58.8 mC50 mD70 mA particle is thrown vertically upwards with a velocity v. It returns to the ground in time T. which of the following graphs correctly represents the motion ?
A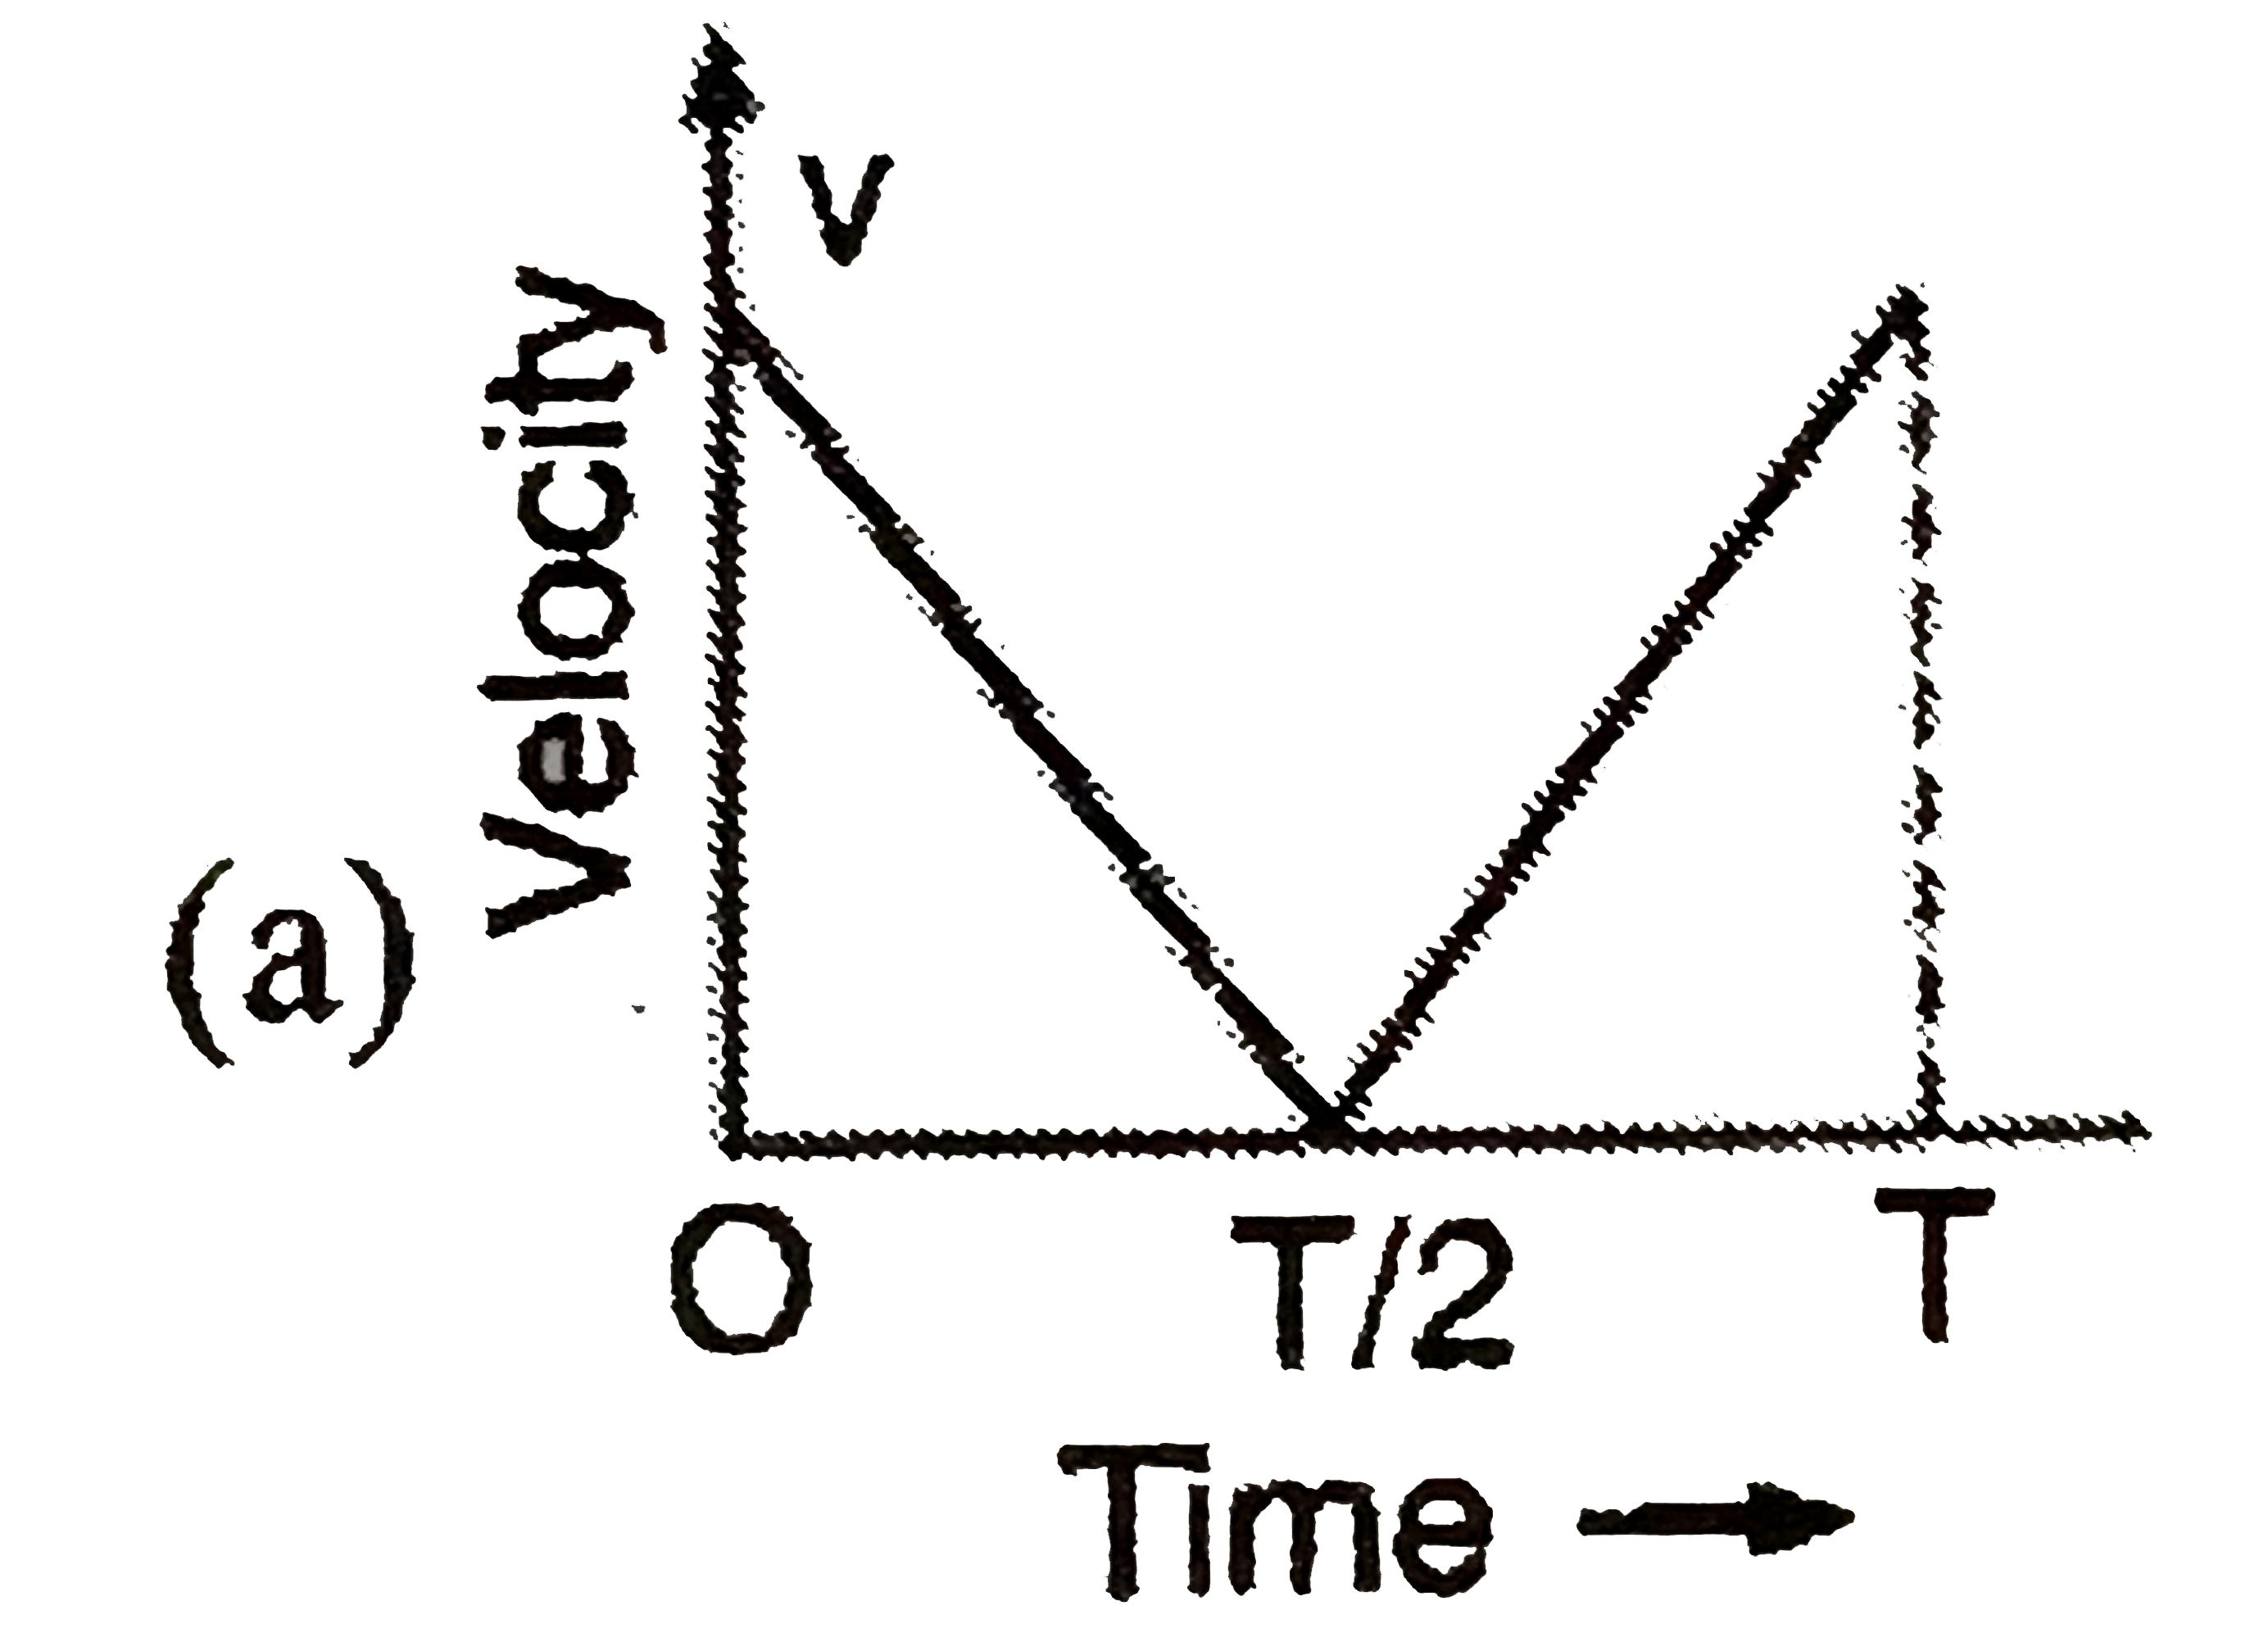 B
B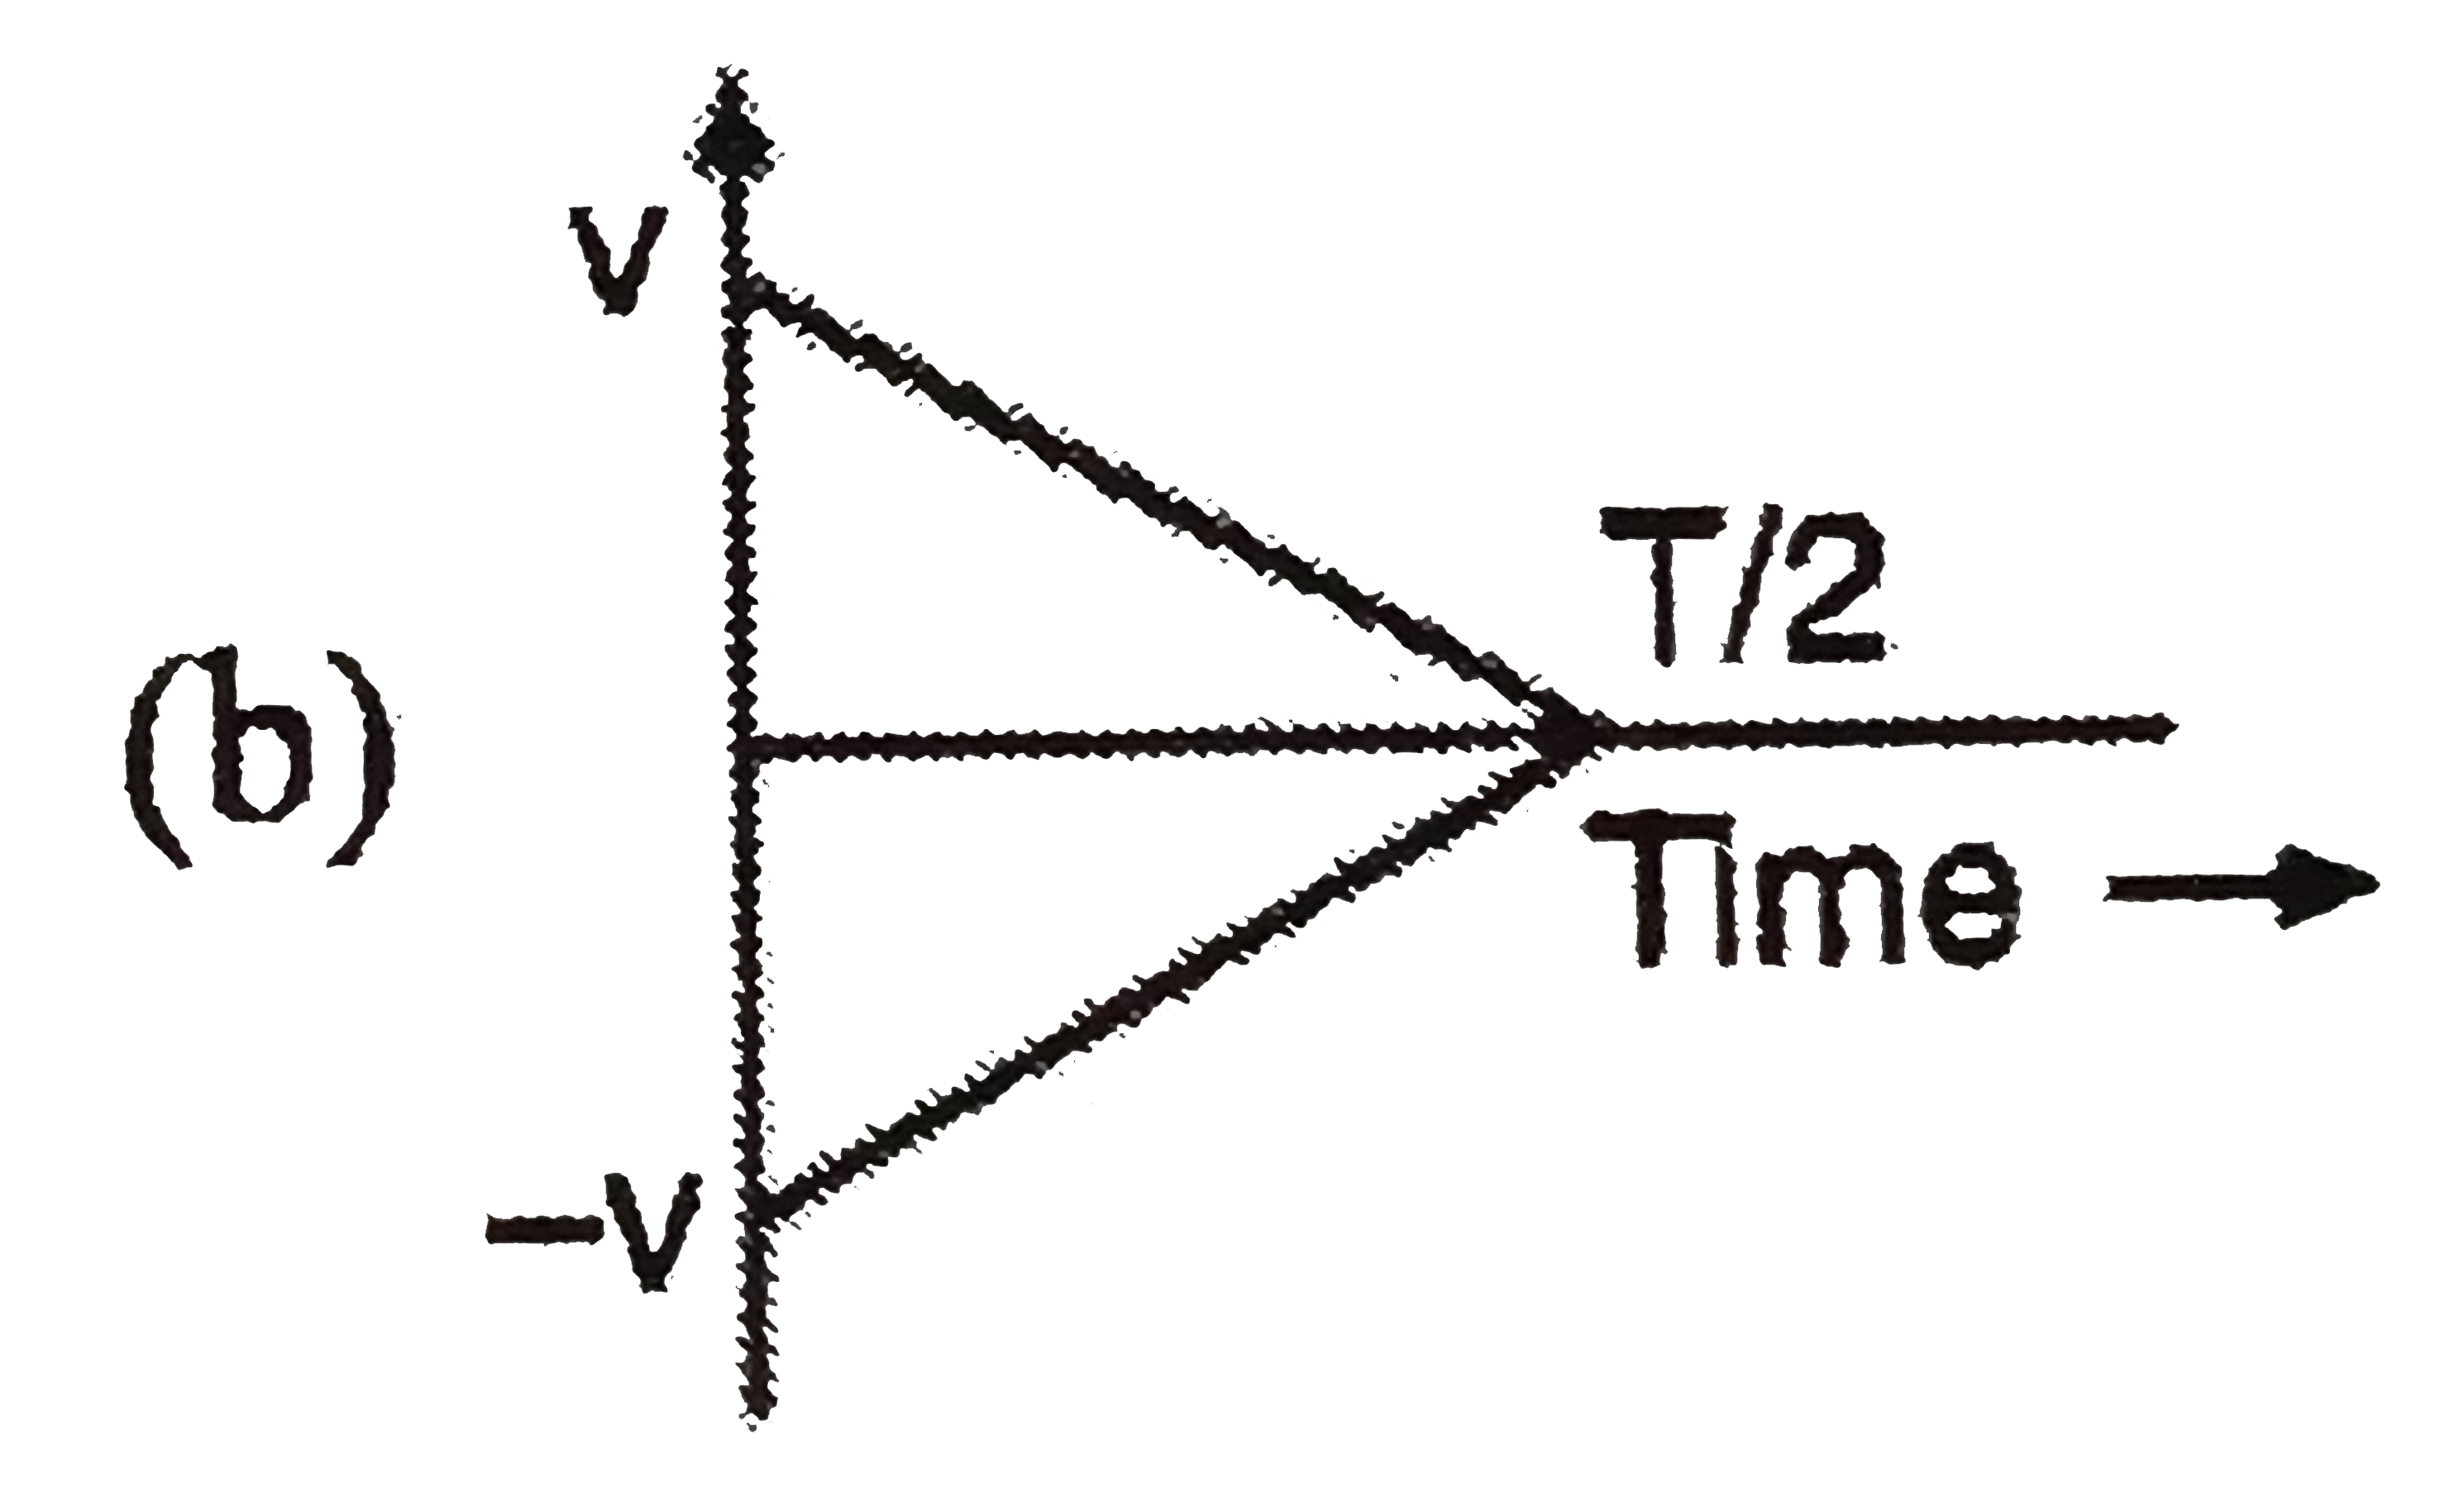 C
C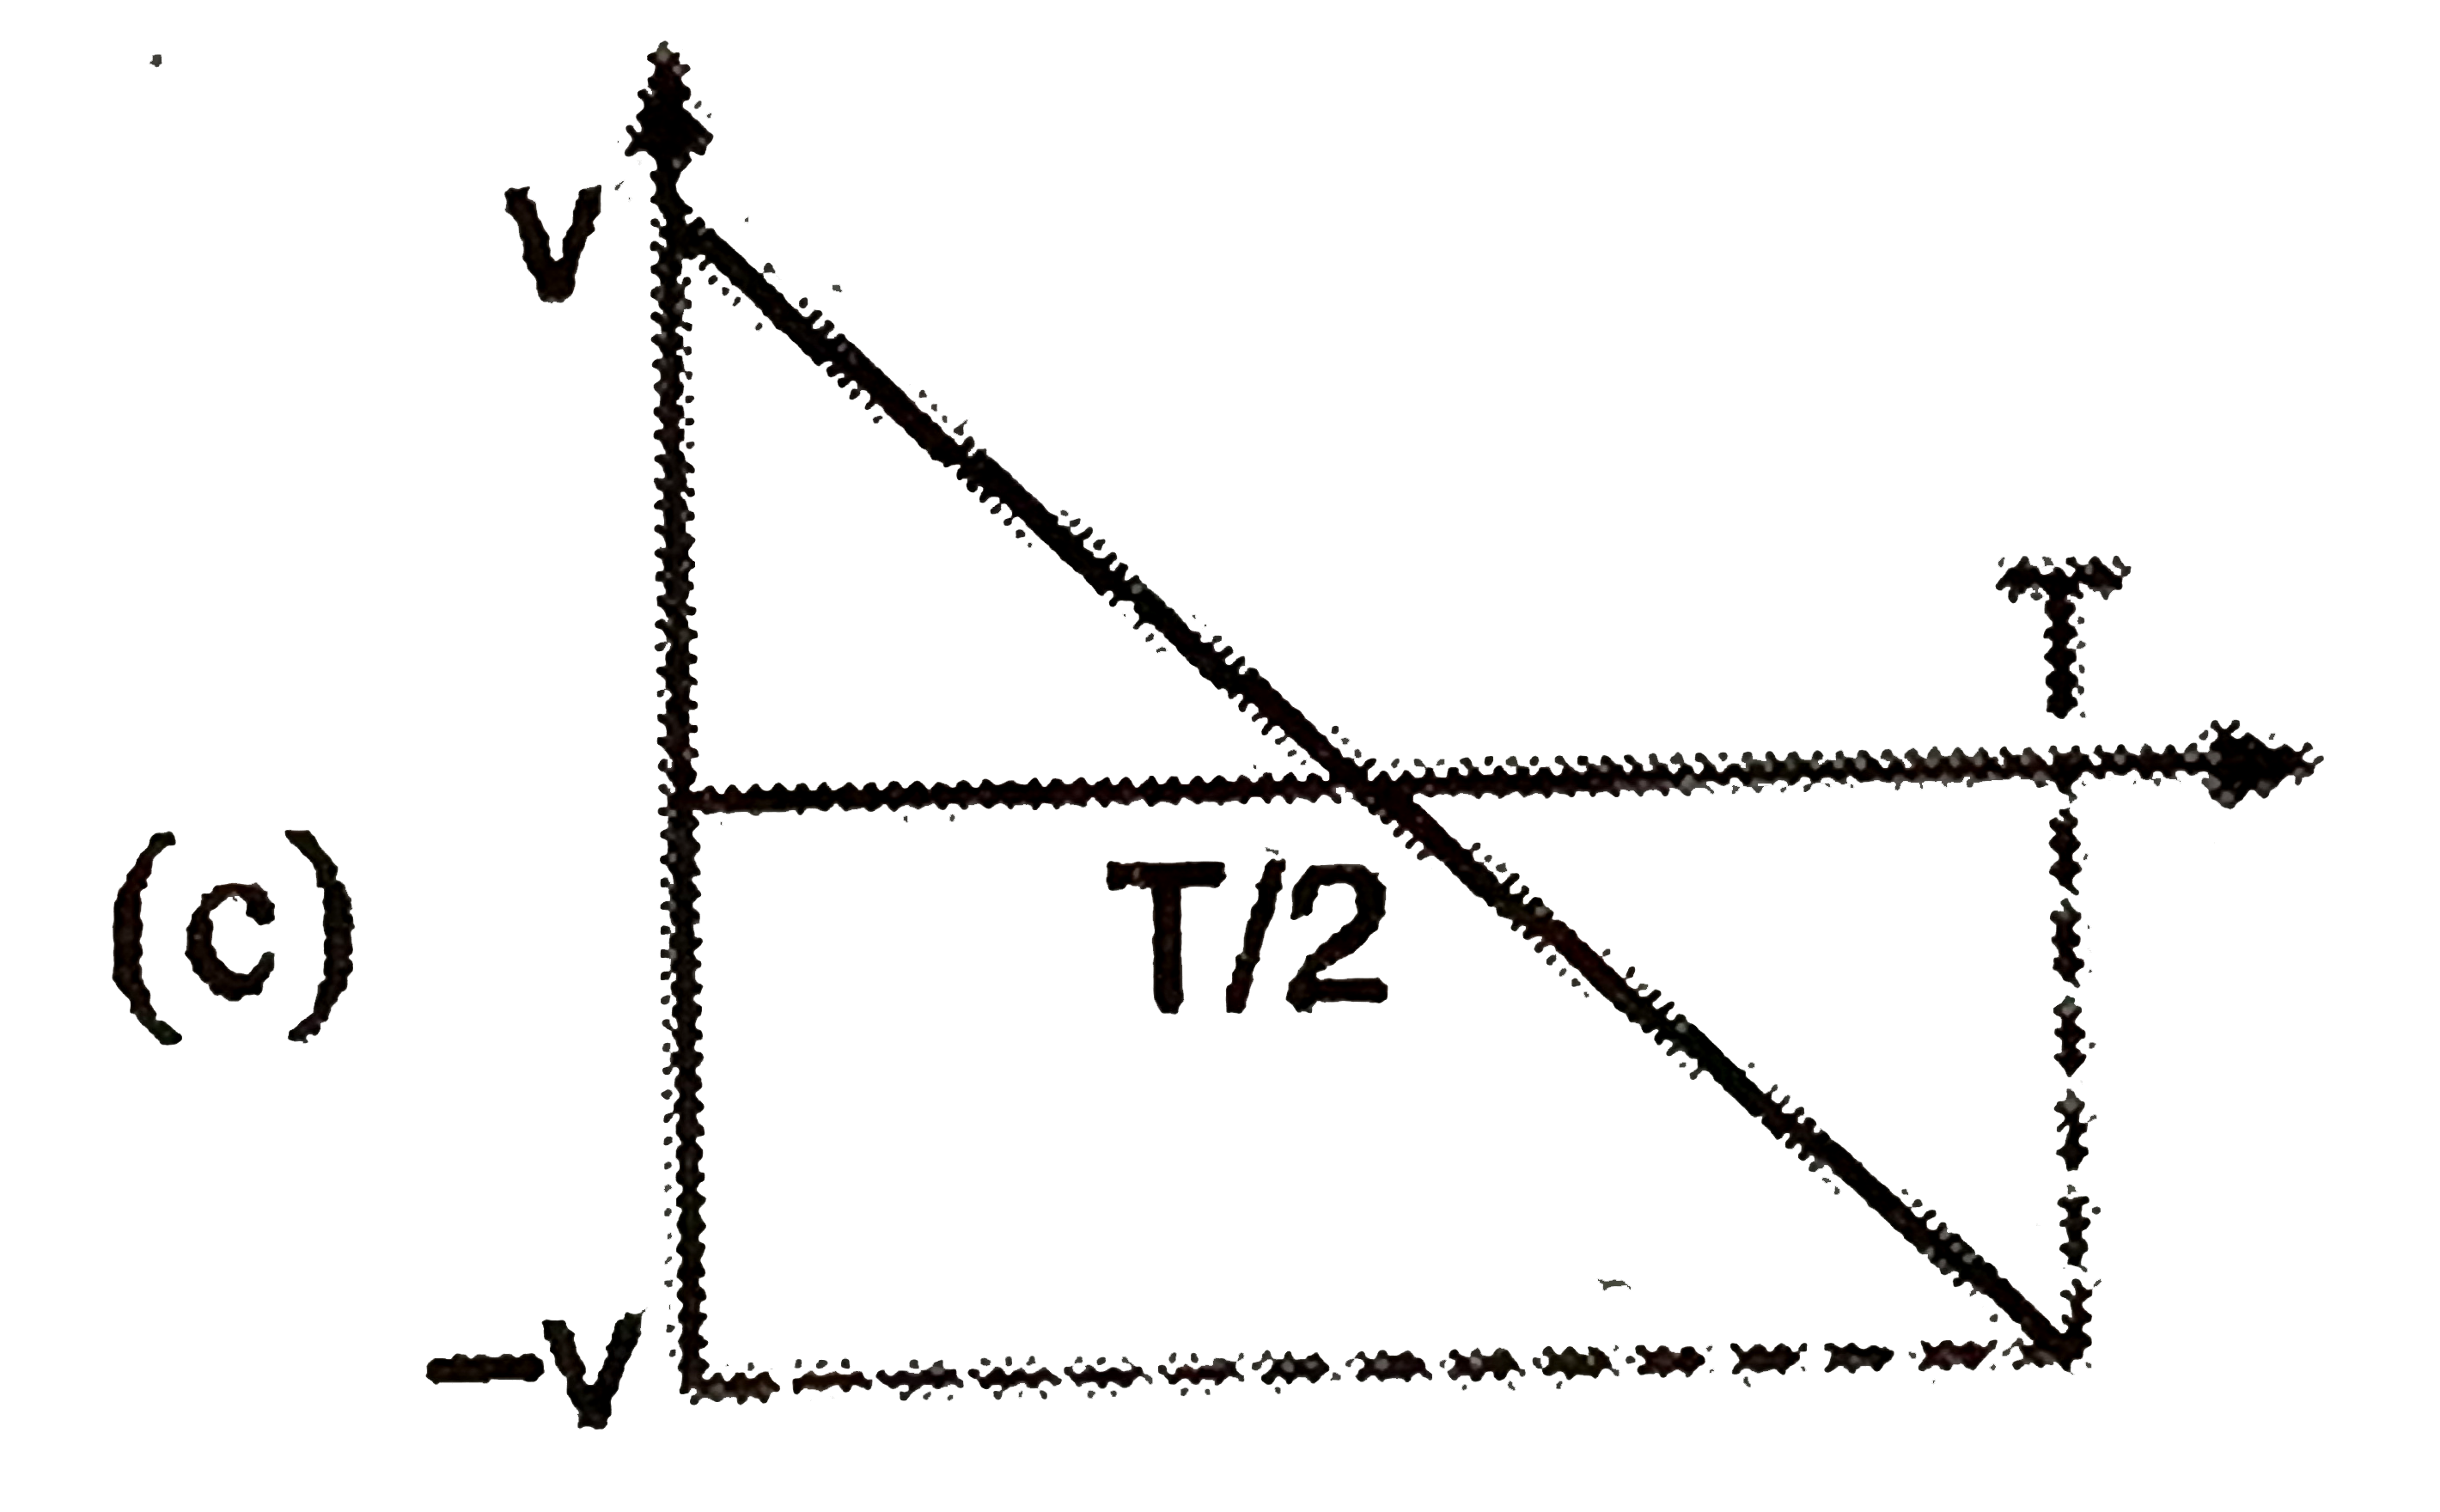 D
D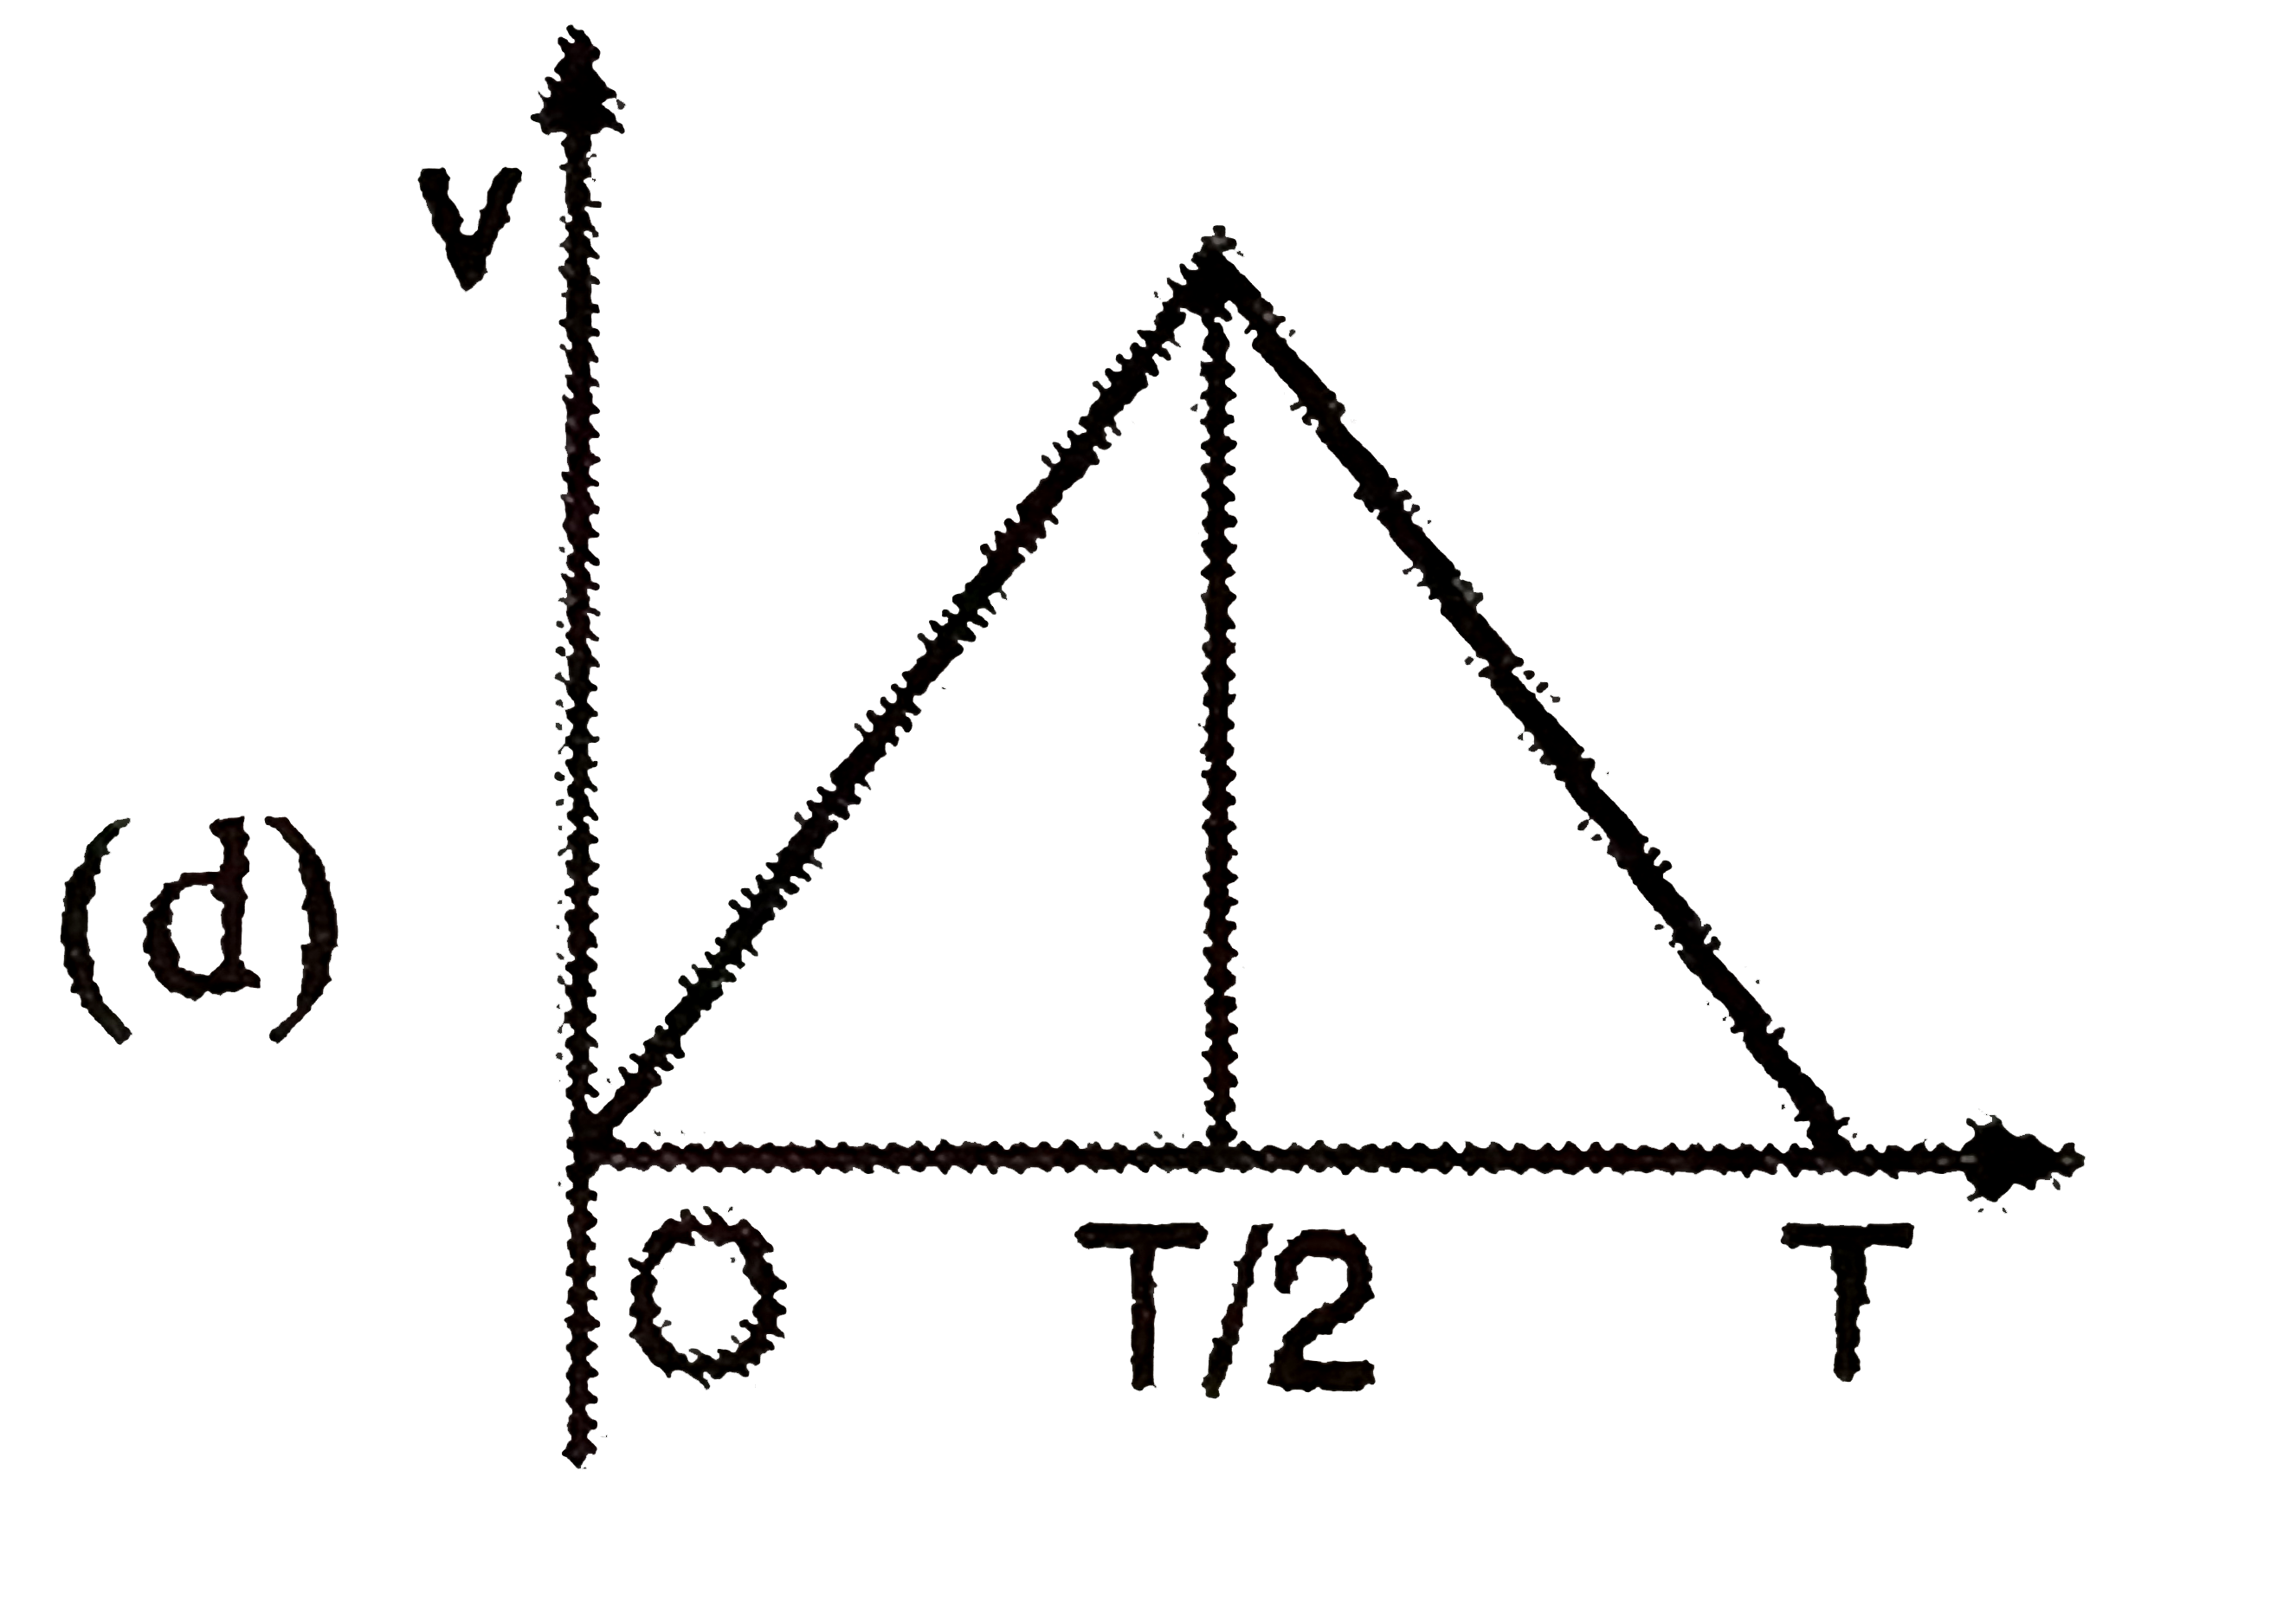
A particle is thrown vertically upwards. The correct graph between its speed (v) and time (t) is given by (neglecting air resistance)
A B
B C
C D
D
The approximate speeds of some objects are given below. Draw a bar graph to represent them:

View SolutionA stone is thrown vertically upwards and after ascending a height 'h' it comes back to the hands of the thrower. What is the (i) total distance covered and the (ii) net displacement of the stone?
View SolutionA ball is thrown vertically upwards. Which quantity remains constant among, speed, kinetic energy, velocity and acceleration?
View SolutionA ball is thrown vertically upwards under gravity. The velocity-time variation is represented by the graph
View SolutionA body is thrown vertically upwards which graph represents variation of velocity w.r.t time
View Solution
