Following data show the number of runs made by Sachin and Sourabh in different Innings. Find out who is a good scorer and who is a consister player?

The correct Answer is:Sachin is a good scorer and Sachin is a consistent player.
Step by step video, text & image solution for Following data show the number of runs made by Sachin and Sourabh in different Innings. Find out who is a good scorer and who is a consister player? by Economics experts to help you in doubts & scoring excellent marks in Class 11 exams.
Updated on:21/07/2023Topper's Solved these Questions
- MEASURES OF DISPERSIONBOOK - TARUN JAIN & VK OHRICHAPTER - MEASURES OF DISPERSIONEXERCISE - NCERT Questions (With Hints to Answers)
11 Videos
- MEASURES OF DISPERSIONBOOK - TARUN JAIN & VK OHRICHAPTER - MEASURES OF DISPERSIONEXERCISE - Learning by doing
30 Videos
- MEASURES OF DISPERSIONBOOK - TARUN JAIN & VK OHRICHAPTER - MEASURES OF DISPERSIONEXERCISE - LONG ANSWER TYPE QUESTIONS
4 Videos
- MEASURES OF CENTRAL TENDENCY MEDIAN AND MODEBOOK - TARUN JAIN & VK OHRICHAPTER - MEASURES OF CENTRAL TENDENCY MEDIAN AND MODEEXERCISE - NCERT Questions (With Hints to Answers)
5 Videos
- ORGANISATION OF DATABOOK - TARUN JAIN & VK OHRICHAPTER - ORGANISATION OF DATAEXERCISE - EXERCISE NCERT
13 Videos
Similar Questions
Following are the marks obtained ,out of 100, by two student Ravi and Hashina in 10 tests

Who is more intelligent and who is more consistent ?
View SolutionThe following piechart shows the number of students who failed in different subjects in an examination. Examine the chart and answer the questions 5 to the total number of students who have failed is 500.

Number of students who failed in Mathema tics is less than the students who did not qualify in language is -
View Solution
Knowledge Check
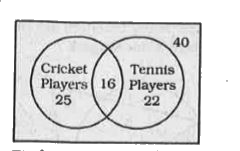
Find out the number of students who play only cricket.A25B18C9D41Find out the number of people who do not play any game.
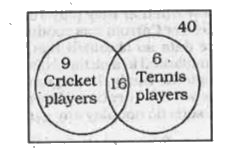 A9B18C15D24
The following pie-chart shows the number of students who failed in different subjects in an examination. Examine the chart and answer the following questions. The total number of students who have failed is 500.
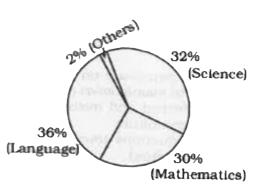
The central angle of the sector for the students who have failed in mathematics is :
View SolutionThe following piechart shows the number of students who failed in different subjects in an examination. Examine the chart and answer the questions 5 to the total number of students who have failed is 500.

Total number of students who did not qualify in Mathematics or Language or Science, is
View SolutionDirection :- The following pie-chart shows the number of students who failed in different subjects in an examination. Examine the chart and answer the following questions. The total number of students who have failed is 500.
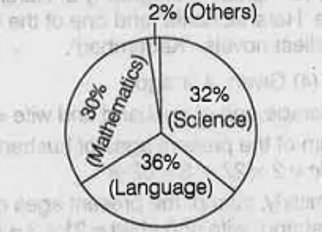
The number of students failed in Science is less than the number of student failed in all other subects by
View SolutionThe following pie-chart shows the number of students who failed in different subjects in an examination. Examine the chart and answer the following questions. The total number of students who have failed is 500.
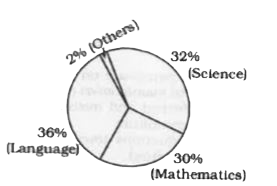
The number of students failed in science is less than the number of students failed in all other subjects by :
View SolutionThe following data shows the number of students who attended the school on weekdays. Draw a bar graph to represent information by using appropriate scale.

View SolutionThe following bar graph shows the number of students (in hundreds) who have opted for different courses A, B, C and D in 3 years in a college. Study the graph and answer the question.
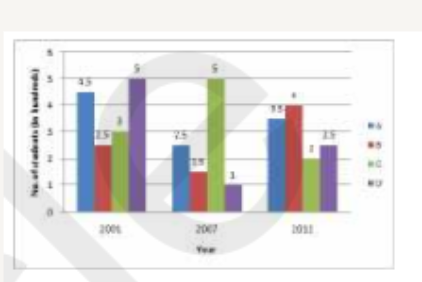 What is the ratio of the number of students who were admitted to course A in the year 2007 to that
of students who were admitted to course C in the year 2012?
View Solution
