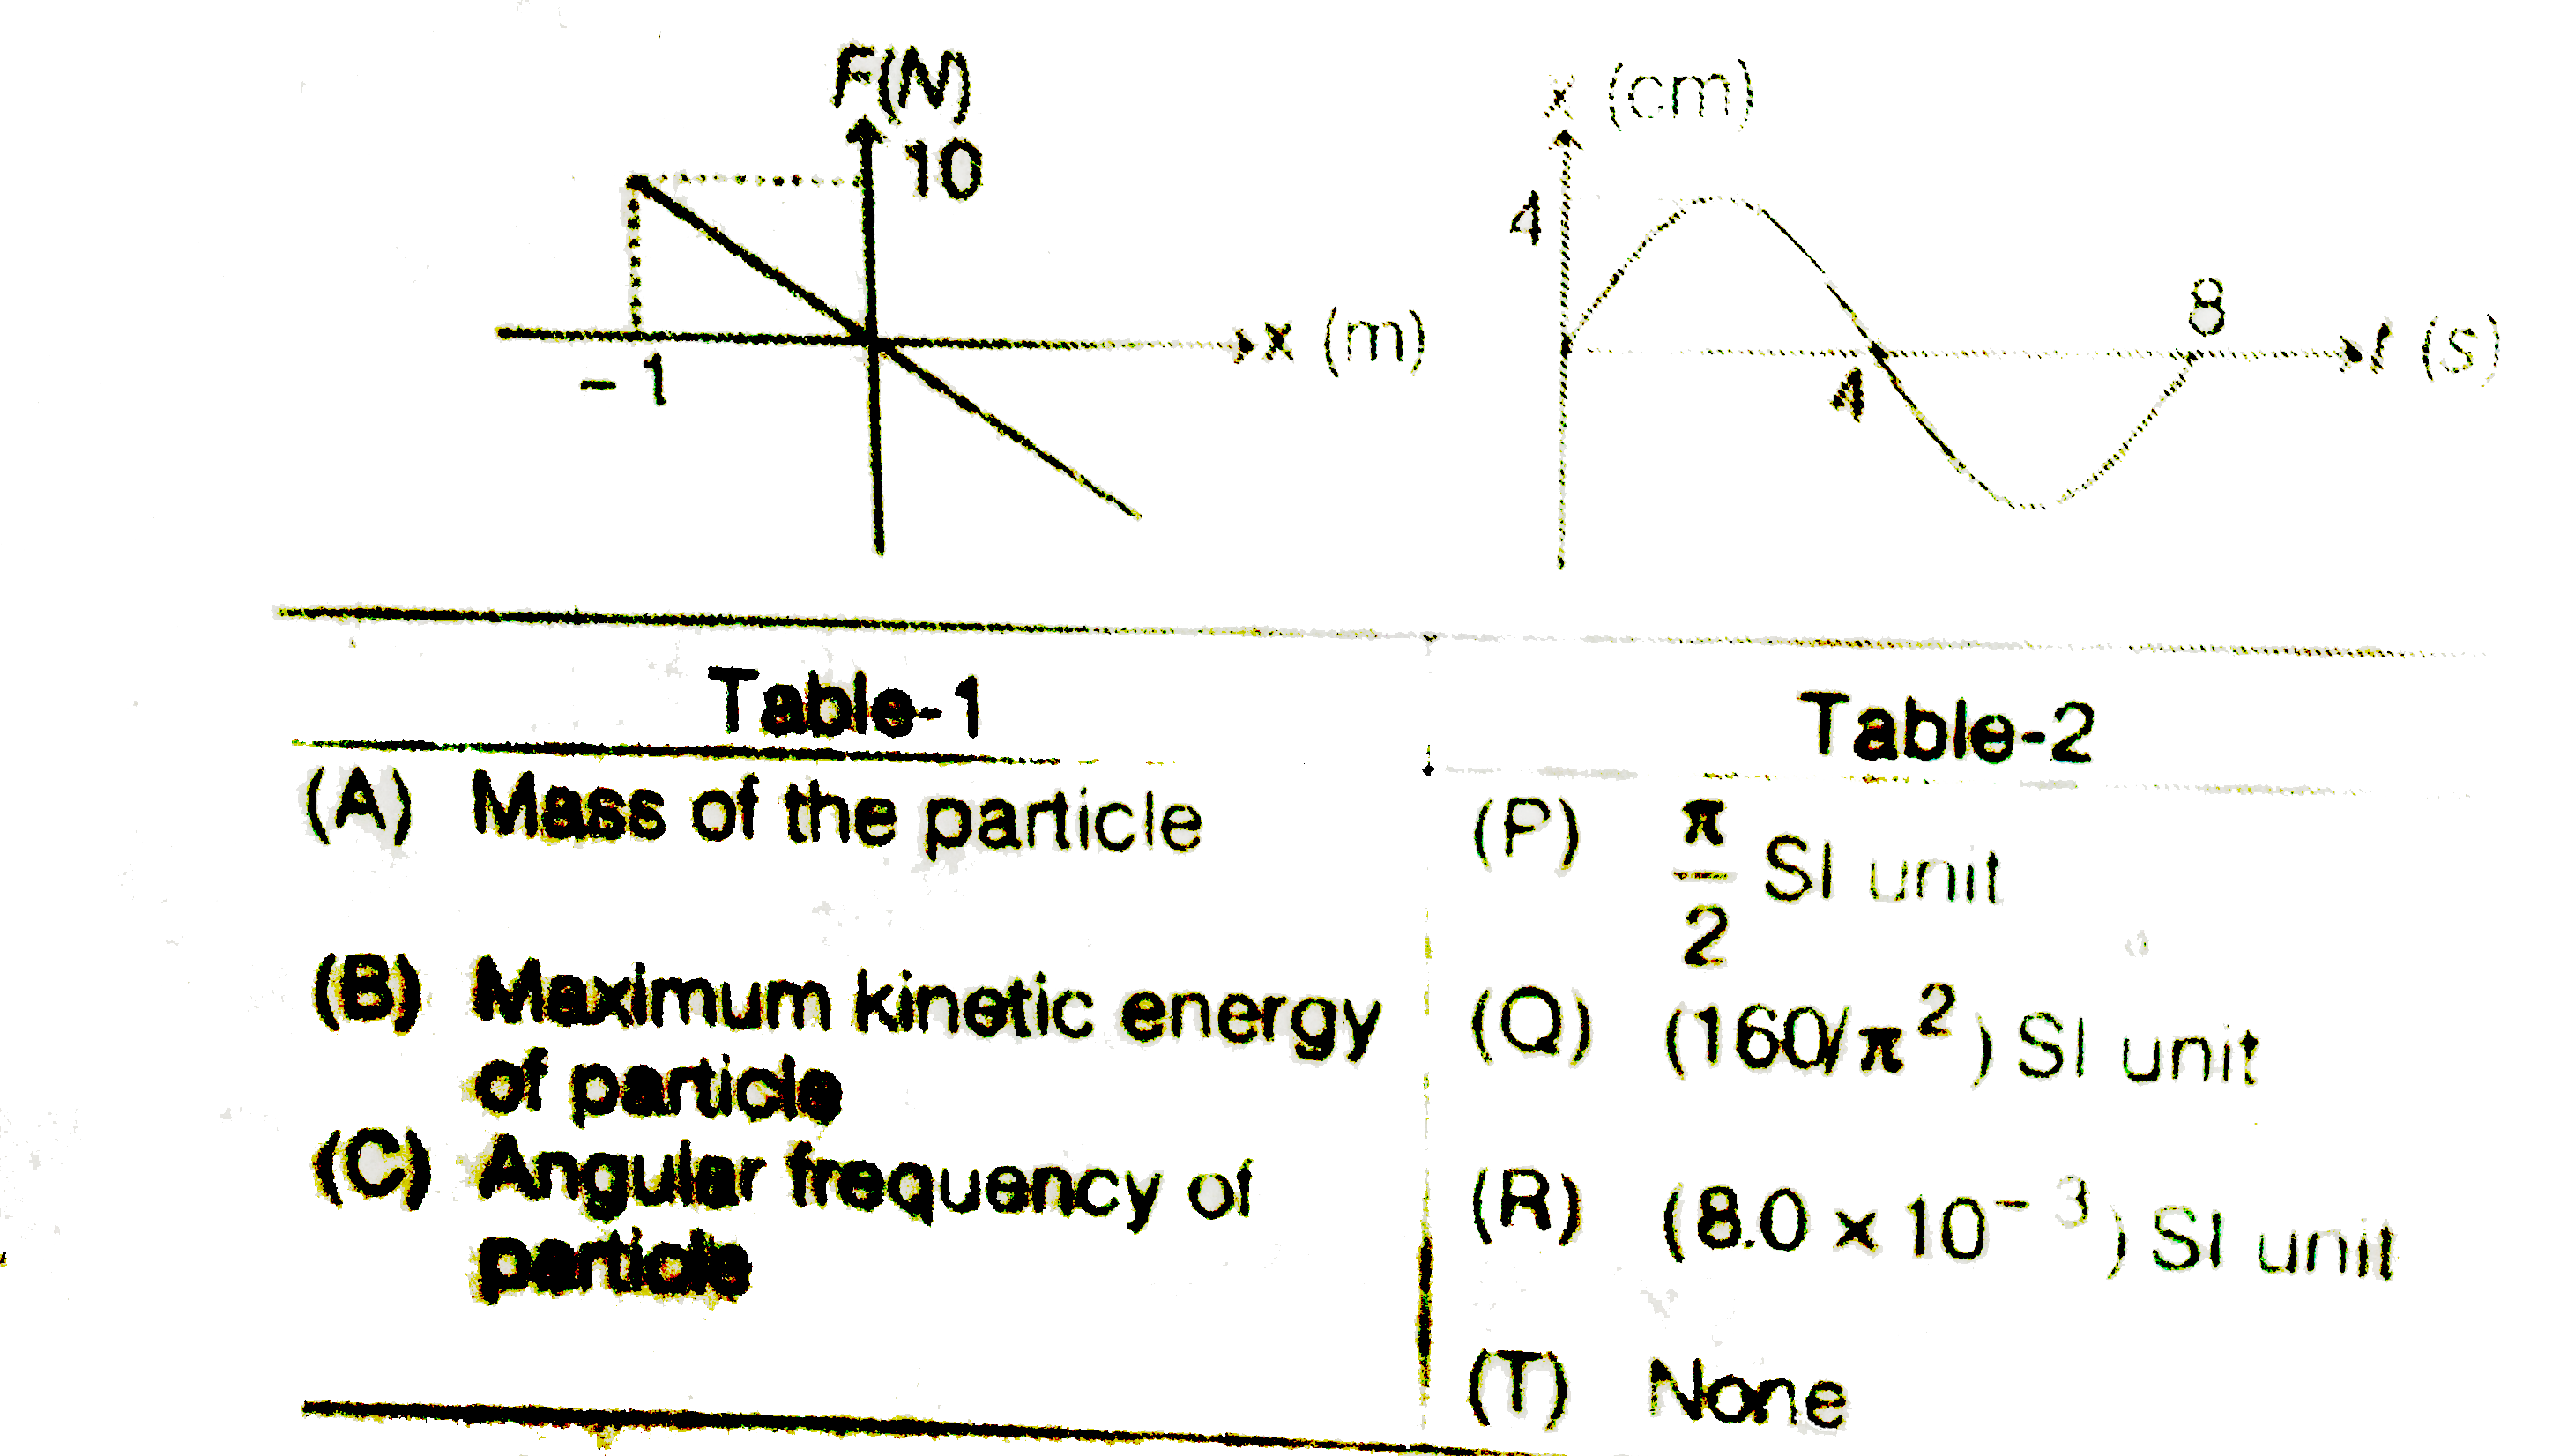
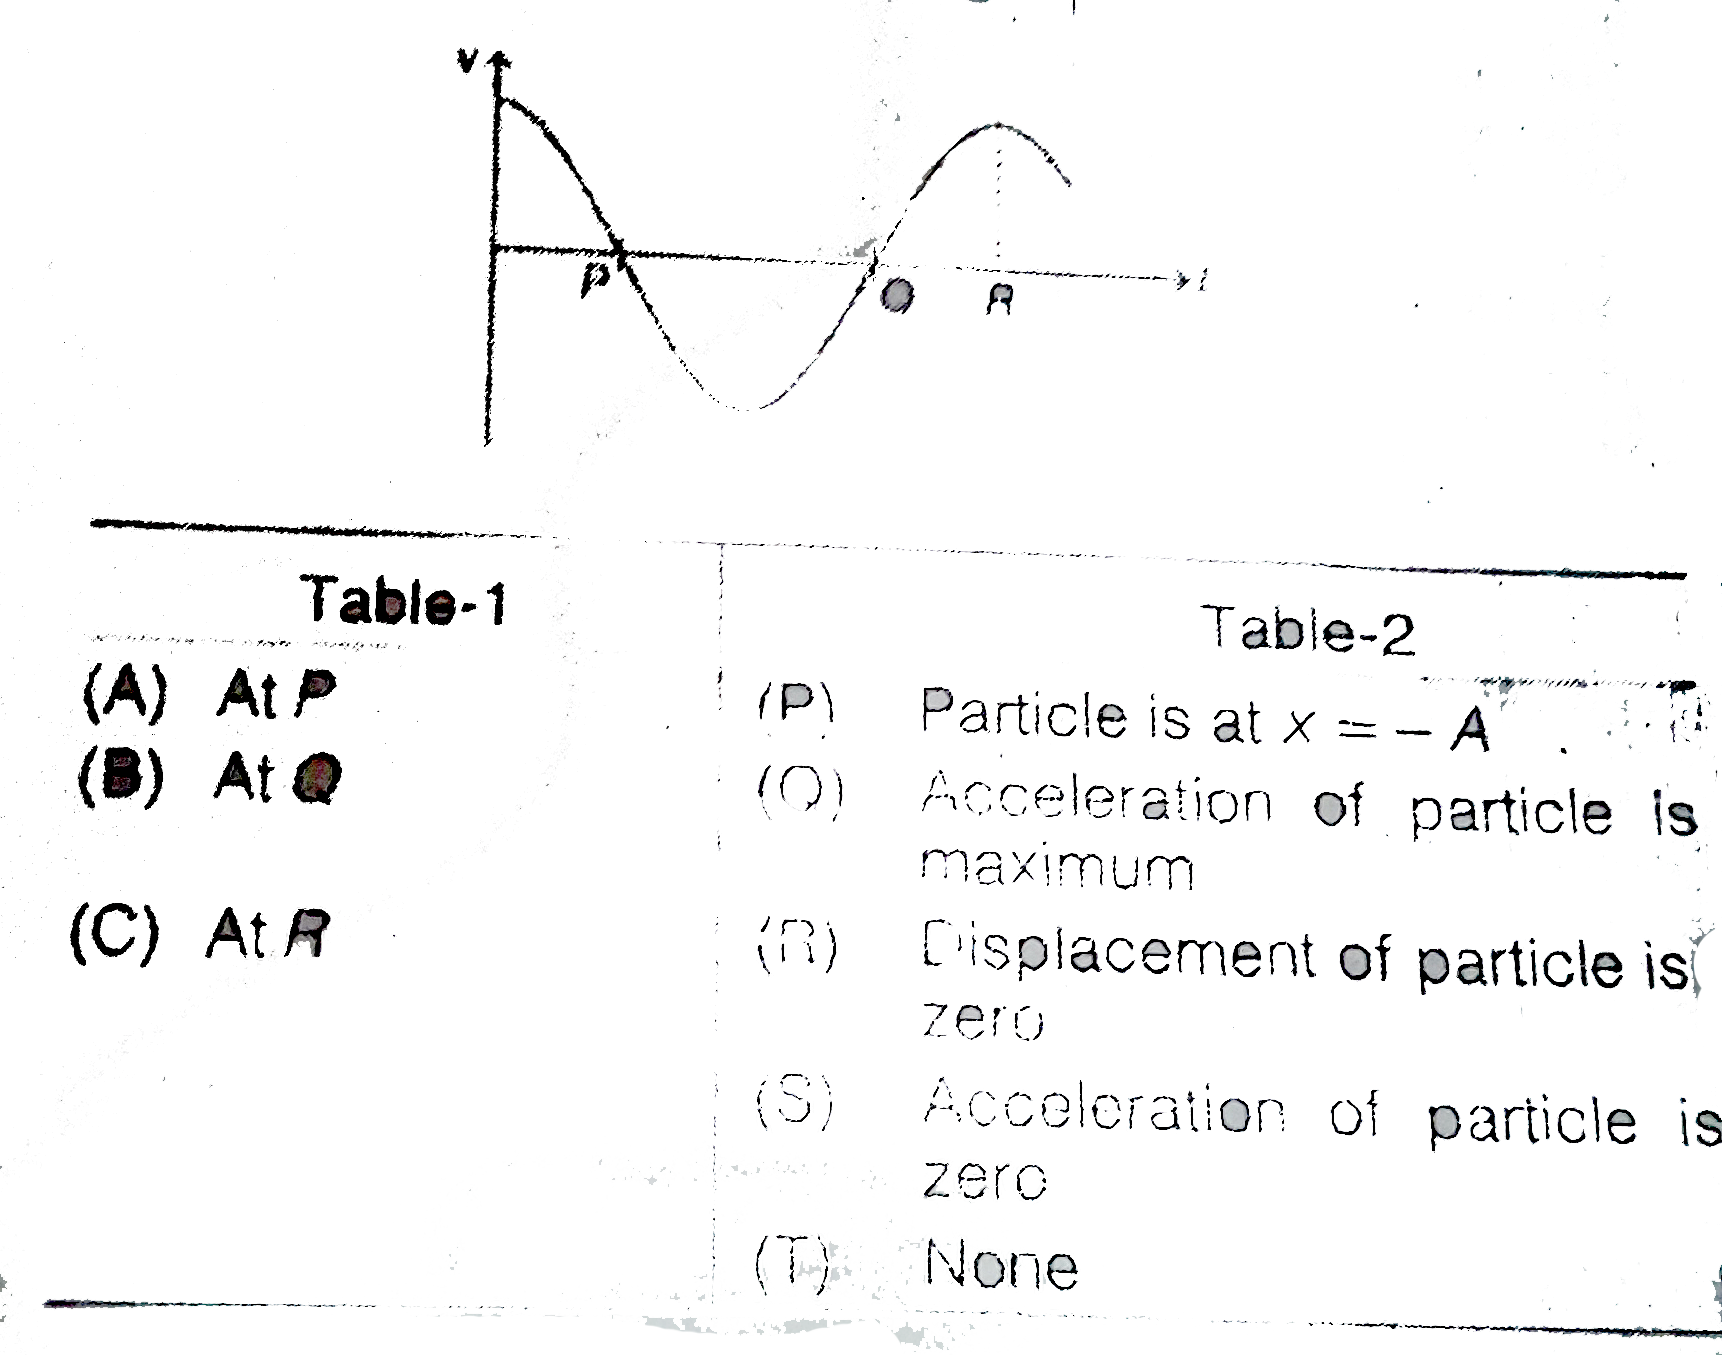
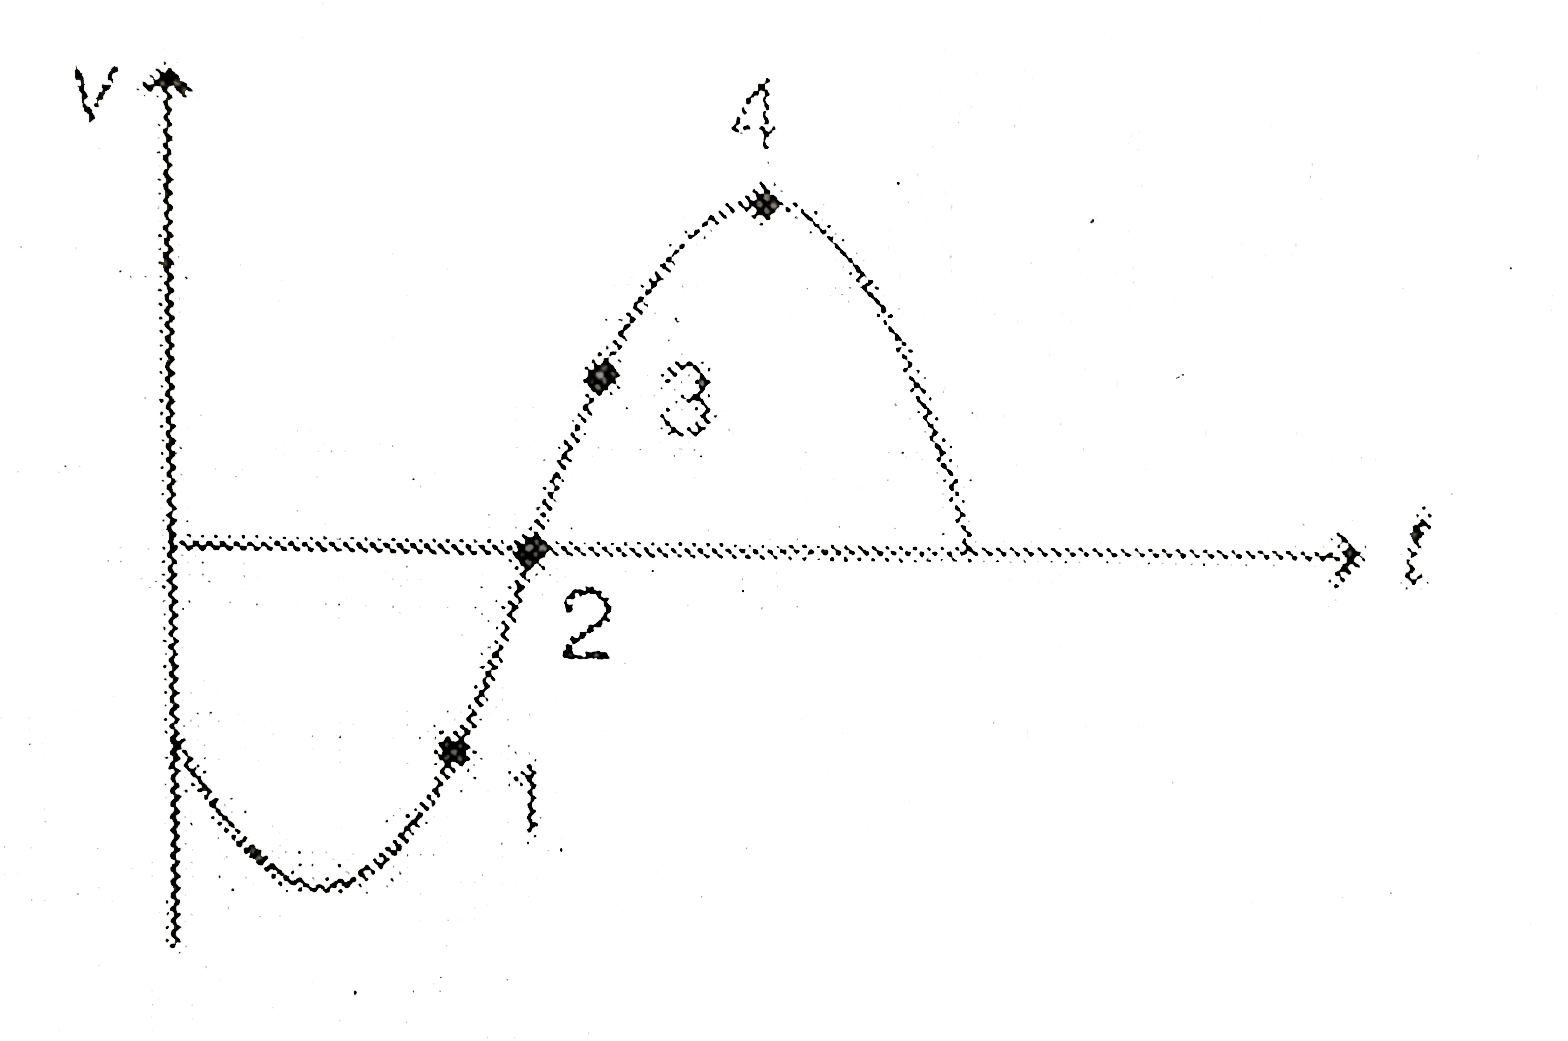
Velocity-time graph of a particle in SHM is as shown in figure. Match the following
Video Solution
Text Solution
The correct Answer is:(A→q,B→p,q,C→r,s)
At P, velocity is zero, but just after few seconds velocity is negative . Therefore , at P particle is at x=+A. At this point acceleration of the particle will be maximum .On similar ground we can say that
At Q,x=−A
At R, v is maximum , i.e., paritcle is at mean position, where acceleration is also zero.
|
Similar Questions
Knowledge Check
The velocity − time graph of a particle is as shown in figure
 AIt moves with a constant acceleration throughoutBIt moves with an acceleration of constant magnitude but changing direction at the end of every two secondCThe displacement of the particle is zeroDThe velocity becomes zero at t=4 second
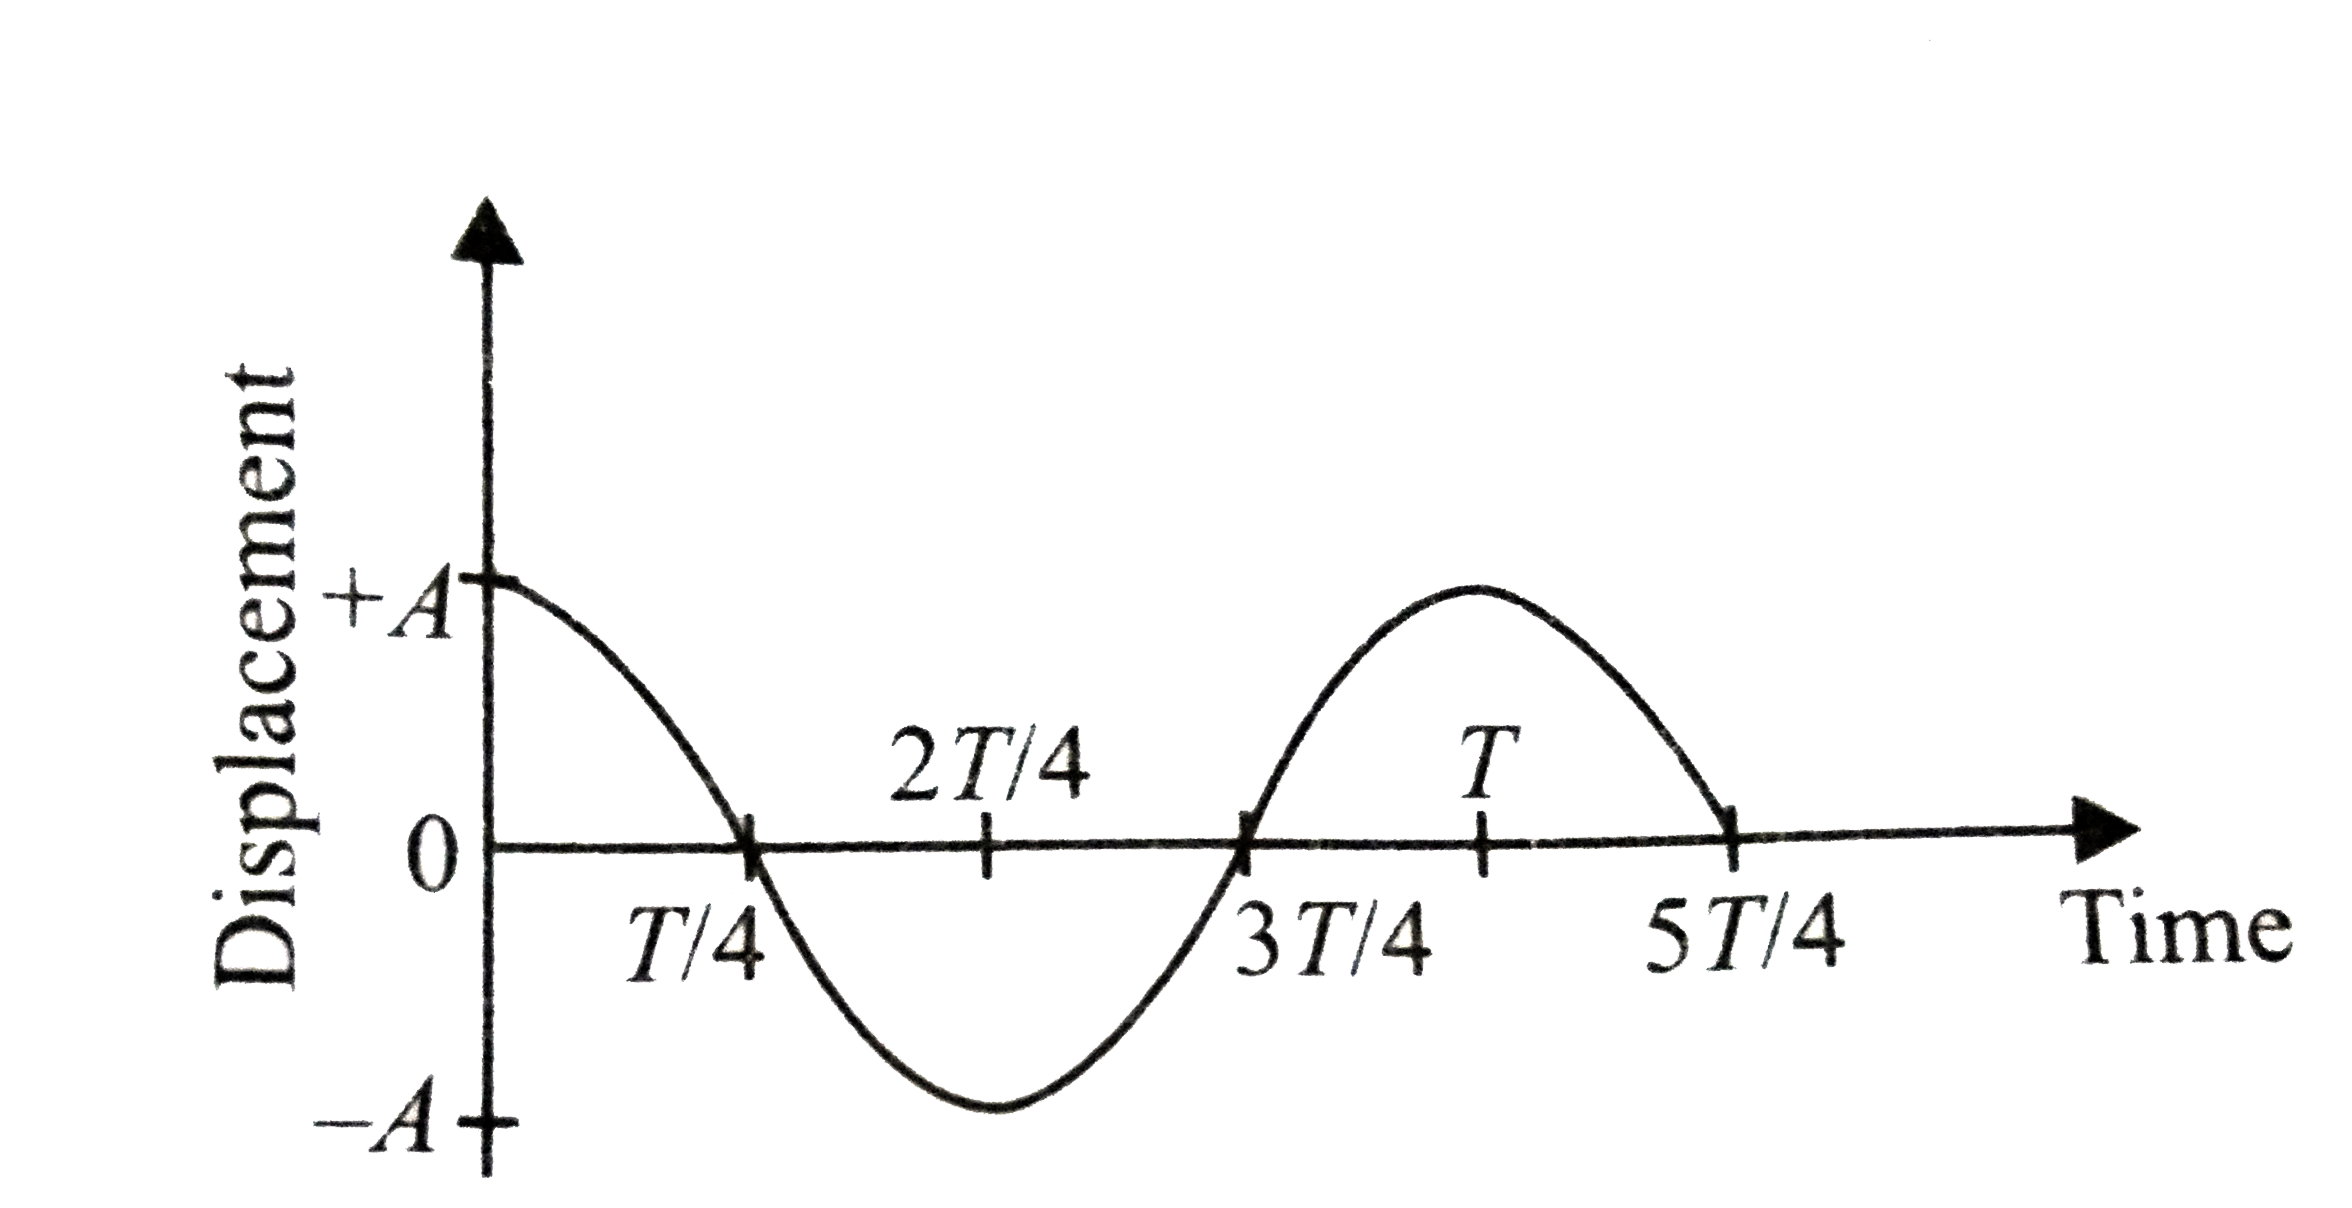
The displecement-time graph of a particle execting SHM is shown in figure. Which of the following statements is false?
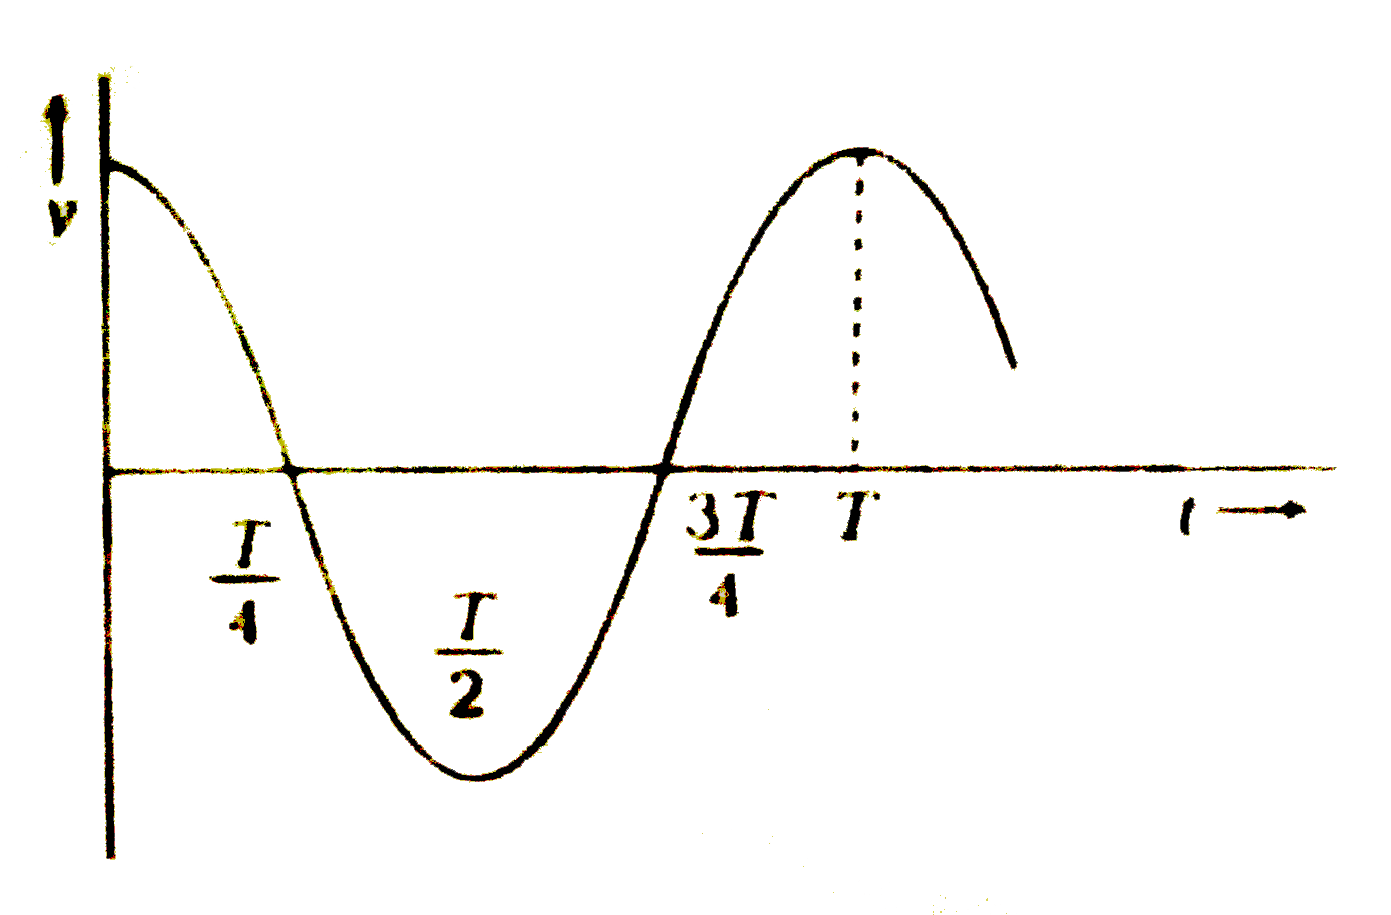 AThe acceleration is maximuym at t=TBTh force is zero at t=3T4CThe potential energy equals the total oscillation energy at t=T2DNone of the above
The displacement-time graph of a particle executing SHM is shown in figure. Which of the following statement is/are true ?
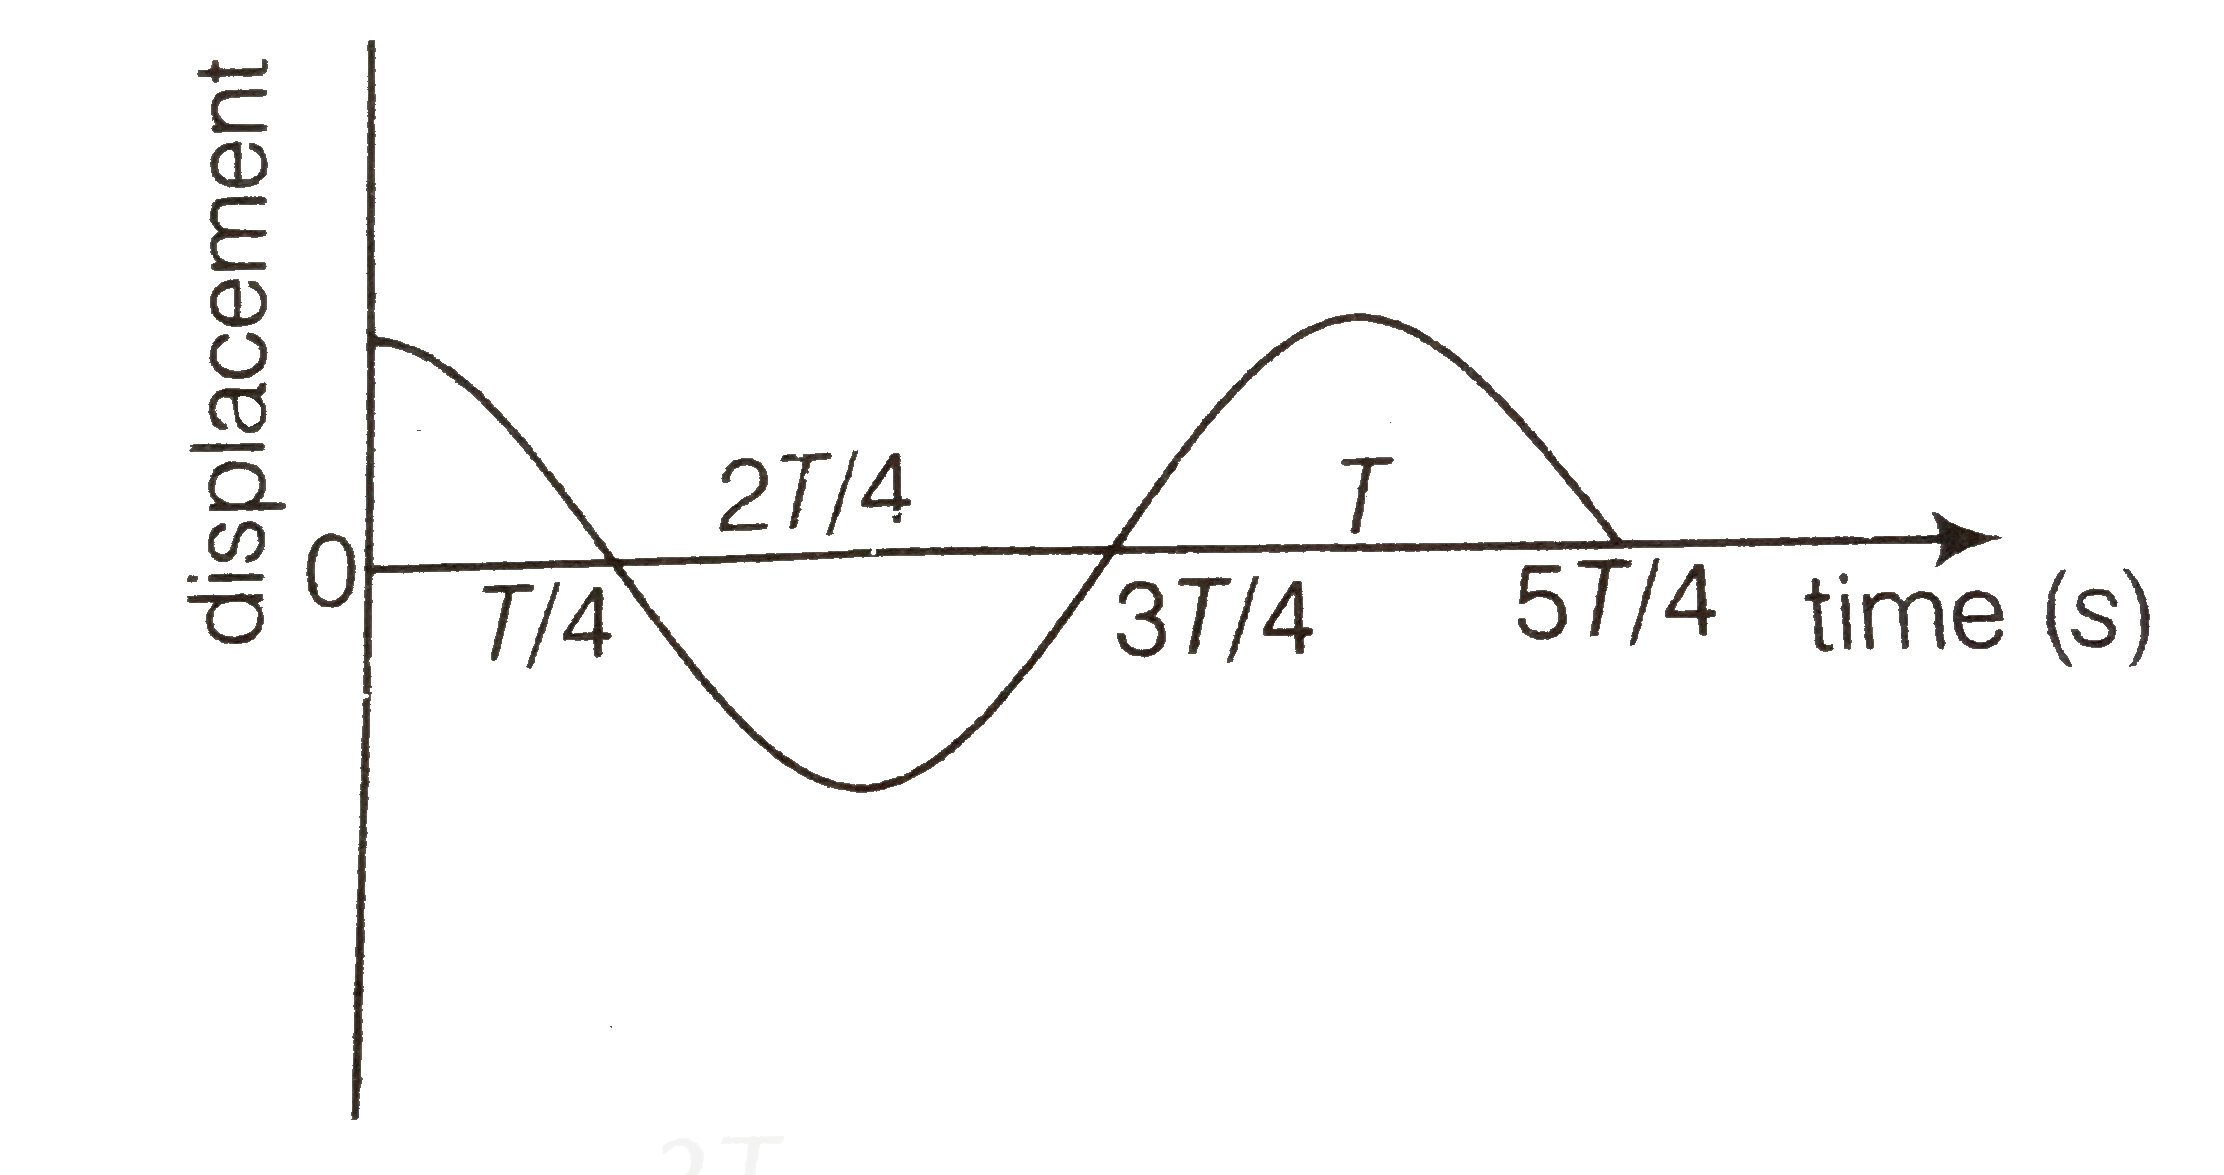 AThe focrce is zero at t=3T4BThe acceleration is maximum at t=4T4CThe velocity is maximum at t=T4DThe PE is equal to KE of oscillation at t=T2
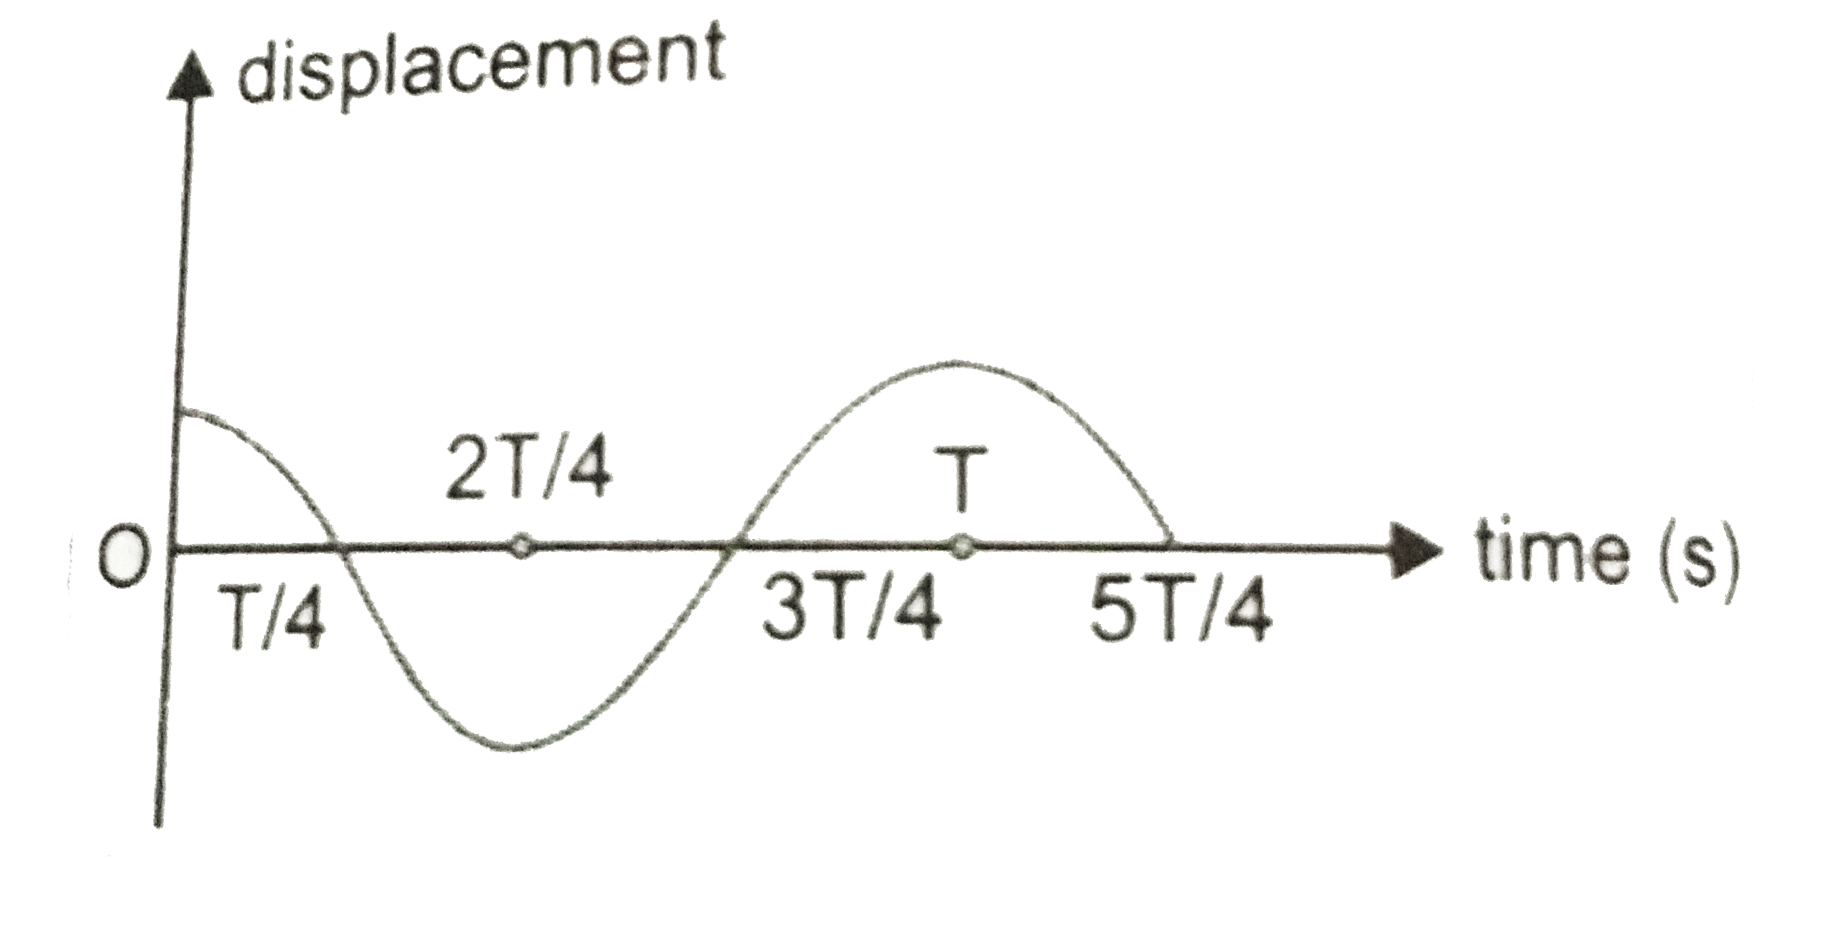
The displacement -time graph of a particle executing SHM is shown in figure. Which of the following statements is/are true ?
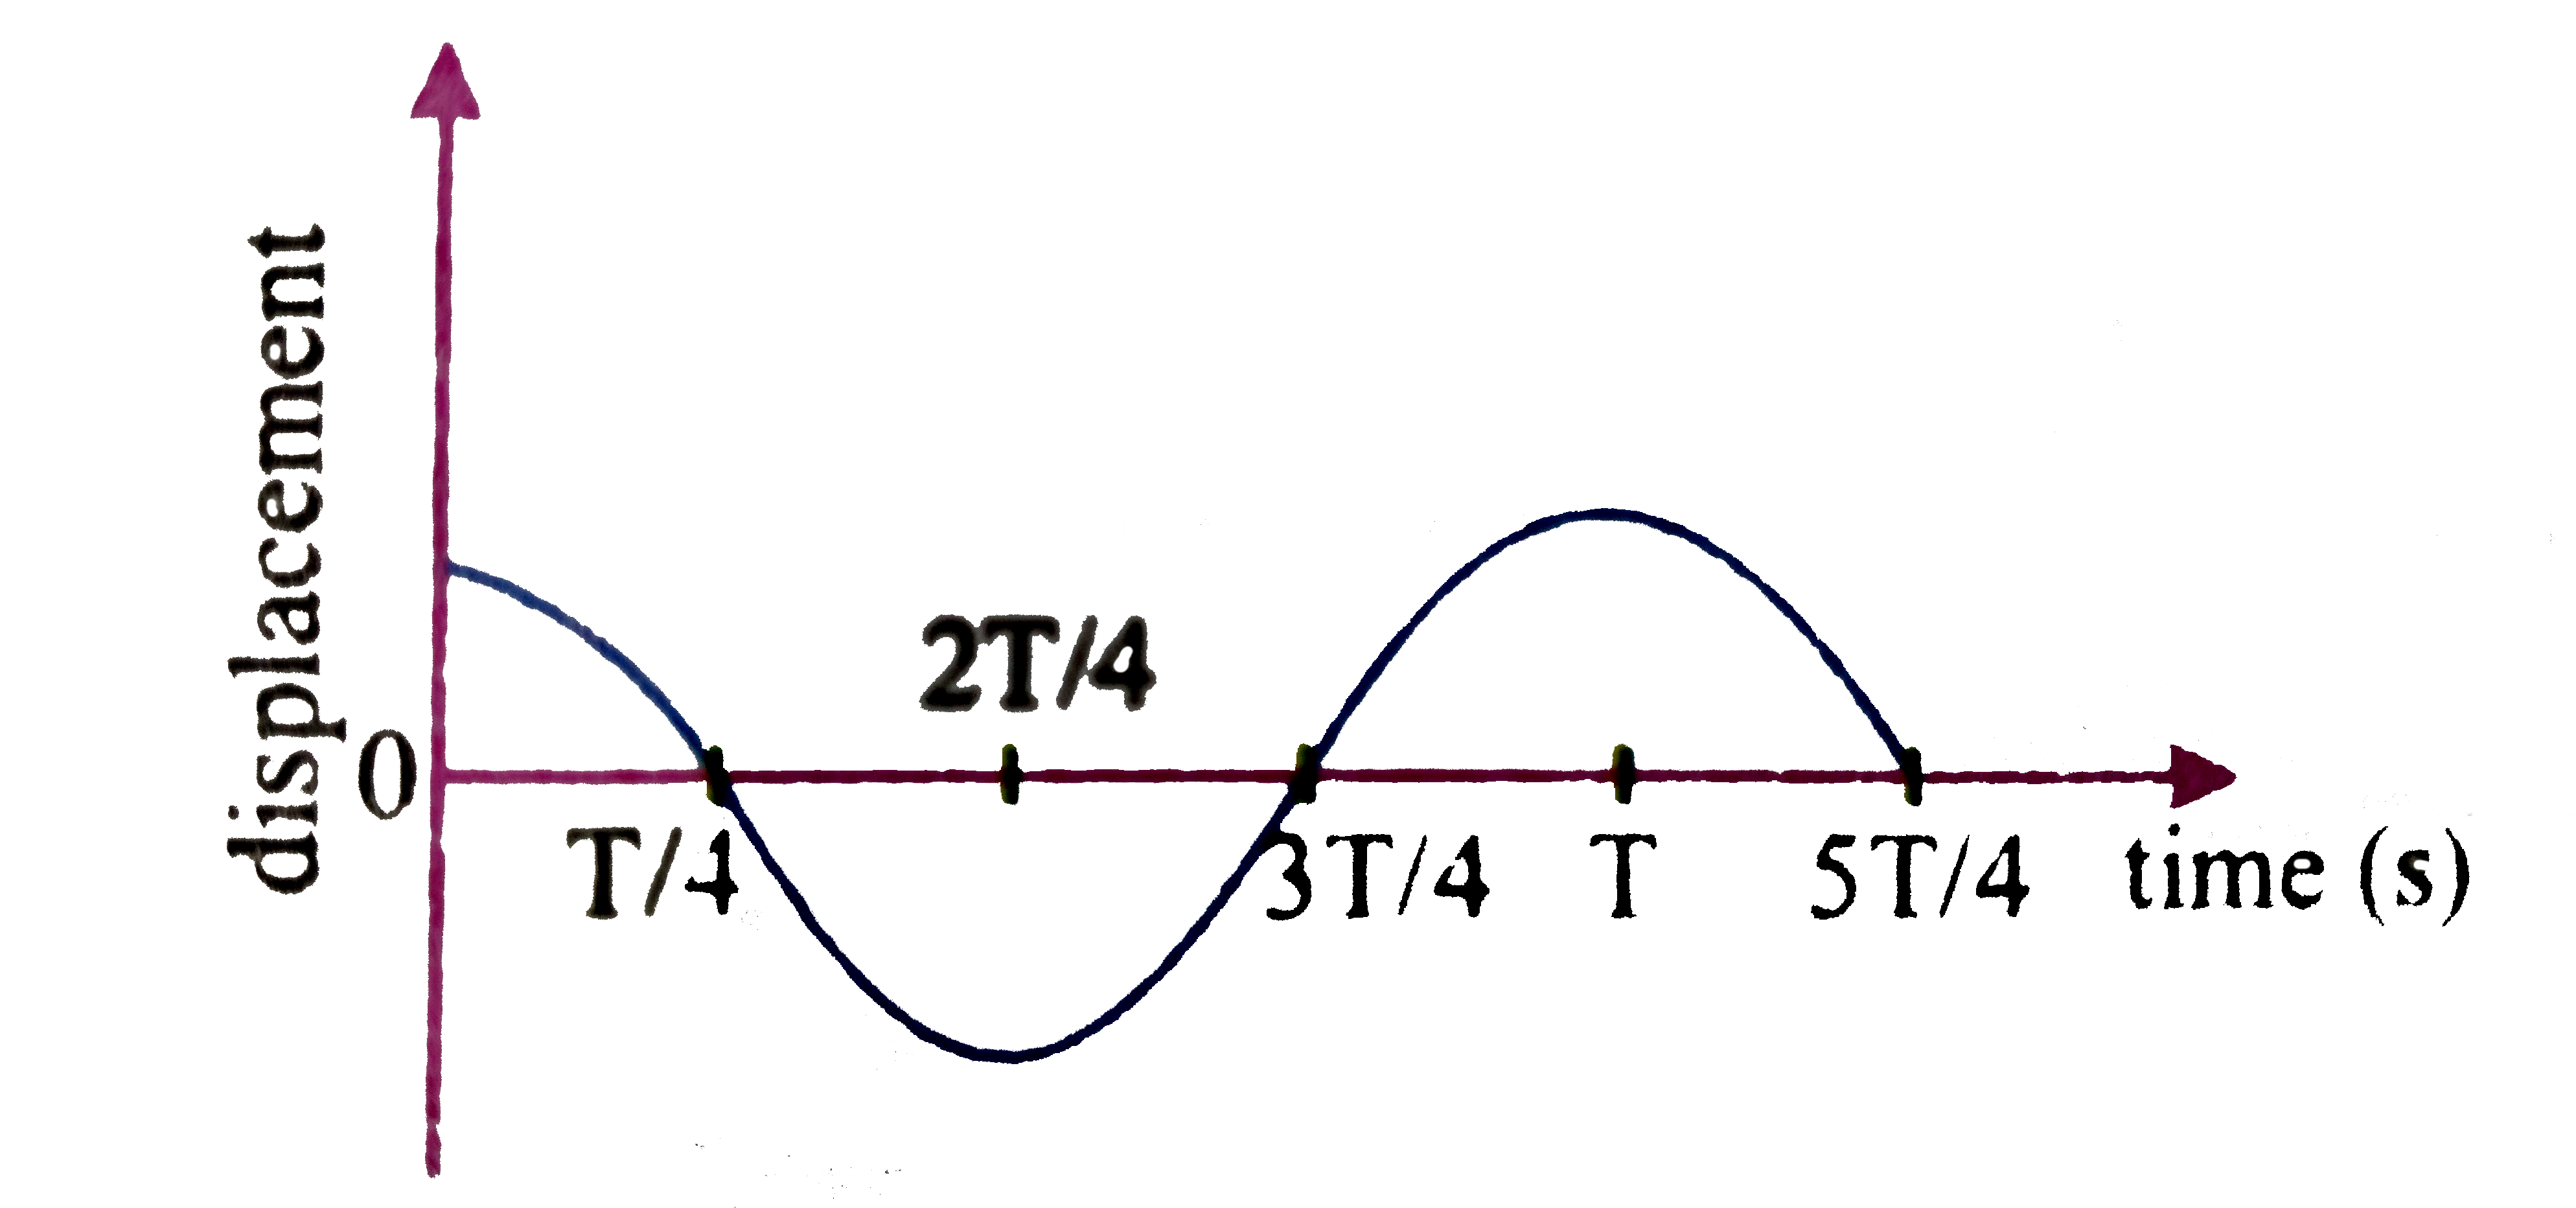
View SolutionThe displacement - time graph of a particle executing SHM is shown in figure. Which of the following statements is//are true ?
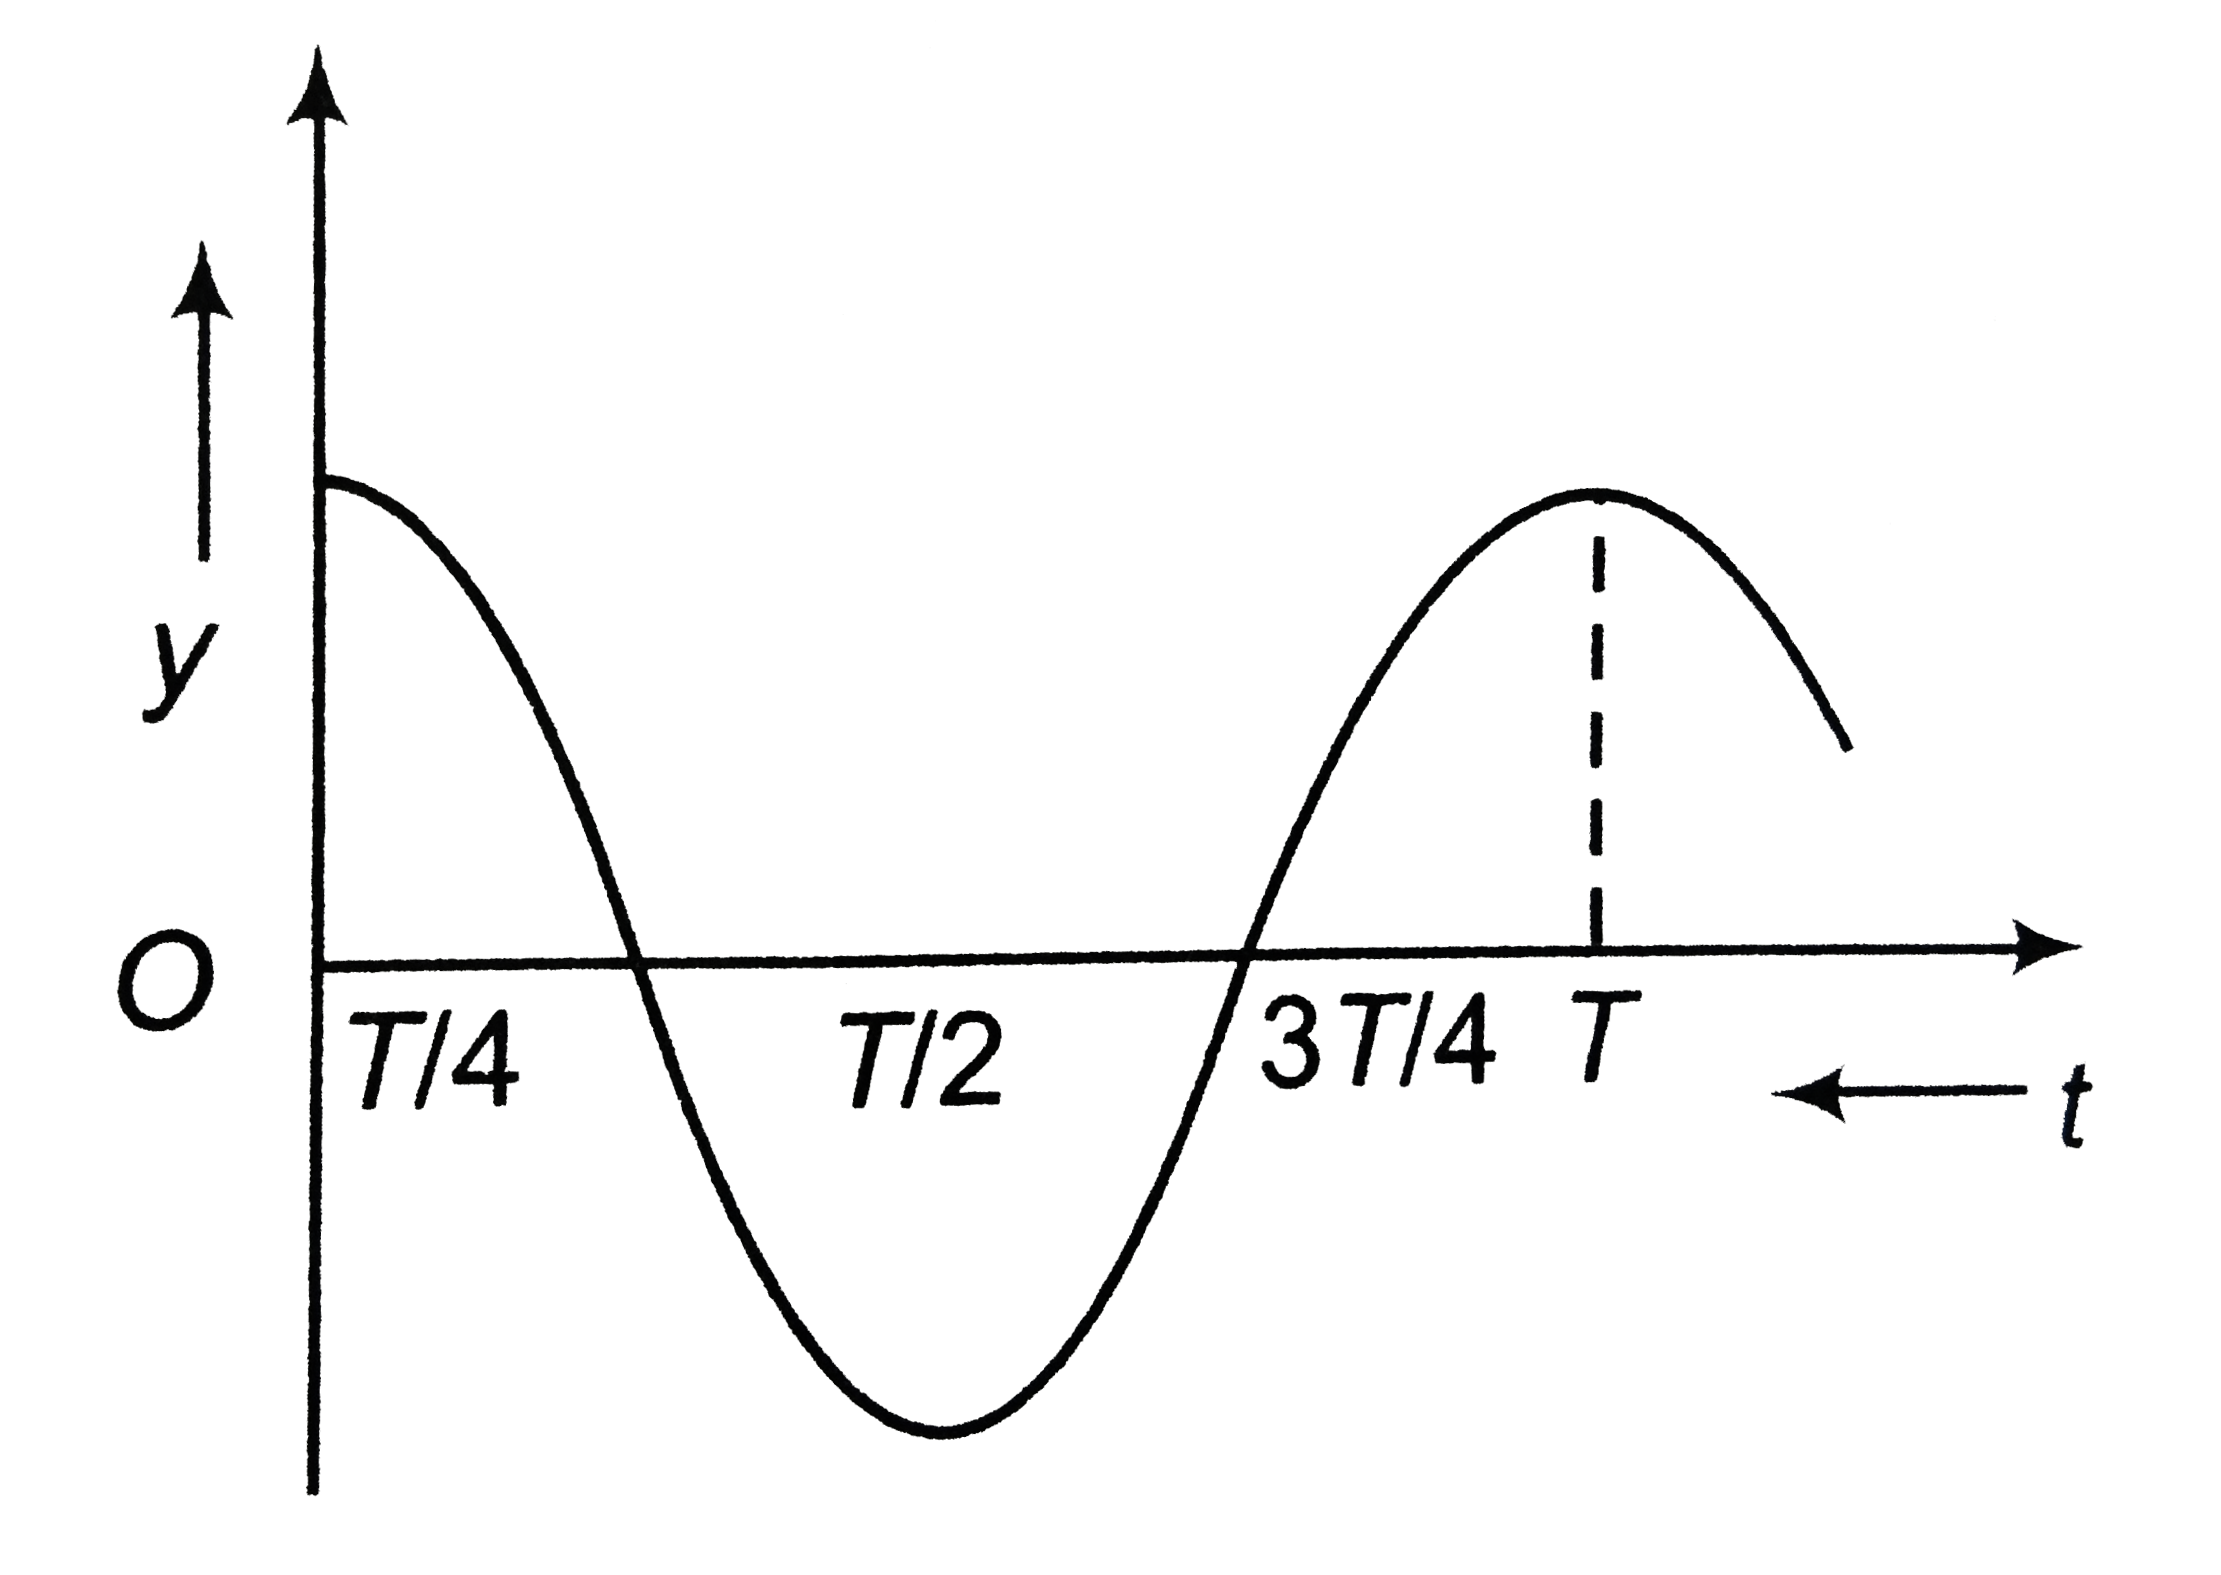
View SolutionThe velocity-time graph of a particle executing SHM is as shown in the figure. The amplitude and maximum acceleration of the particle respectively are
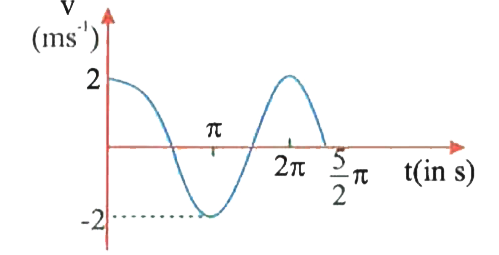
View SolutionVelocity-time graph of a particle executing SHM is shown in figure. Select the correct alternative(s).
View SolutionThe displacement time graph of a particle executing S.H.M. is shown in figure. Which of the following statement is / are true ?
View Solution

