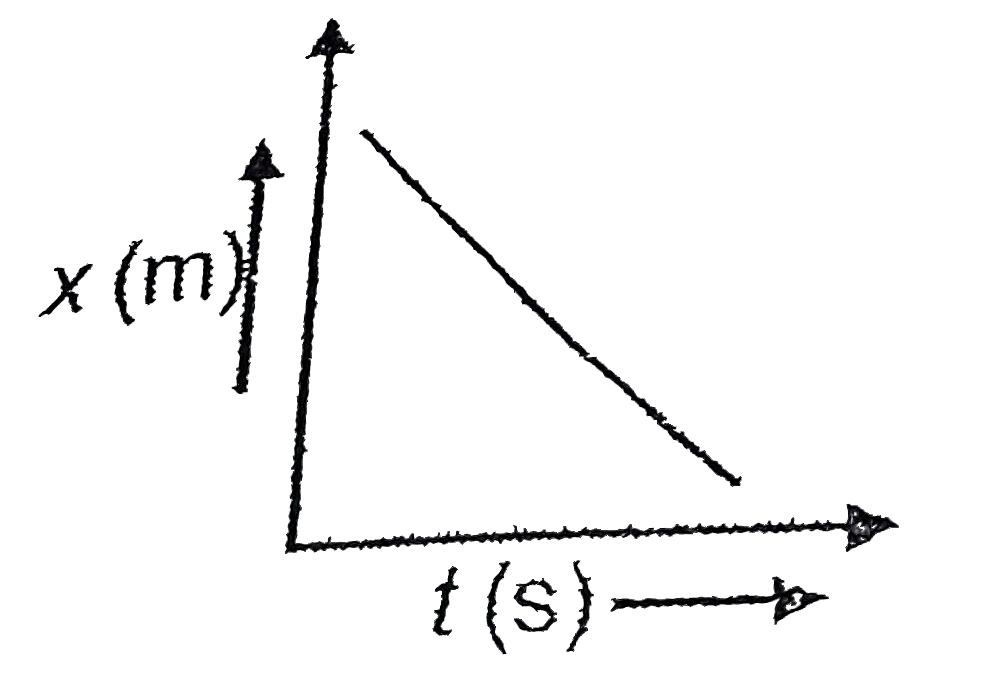
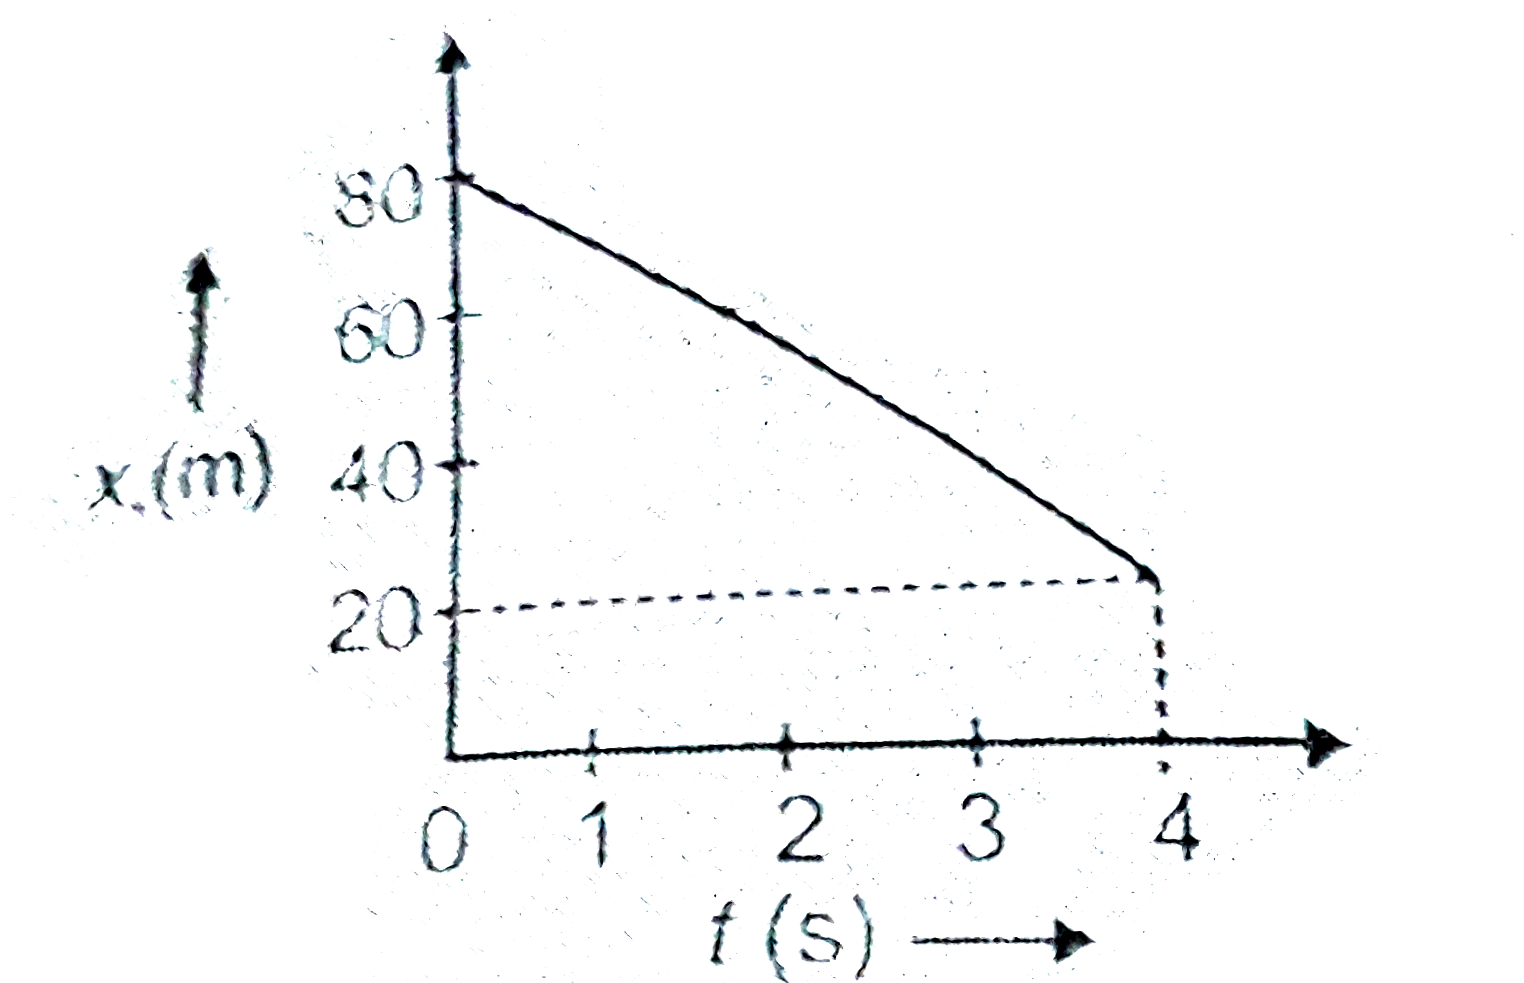
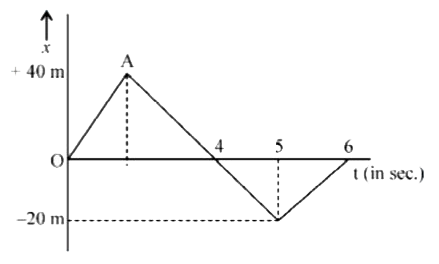
The position-time (x-t) graph of an object in uniform motion is shown below. Calculate the velocity with which the object is moving.
Video Solution
Text Solution
The correct Answer is:−15m/s
Calculate the slope of the given x−t graph.
|
Topper's Solved these Questions
- MOTION IN A STRAIGHT LINEBOOK - AAKASH INSTITUTECHAPTER - MOTION IN A STRAIGHT LINEEXERCISE - EXERCISE
30 Videos
- MOTION IN A STRAIGHT LINEBOOK - AAKASH INSTITUTECHAPTER - MOTION IN A STRAIGHT LINEEXERCISE - ASSIGNMENT (SECTION - A)
60 Videos
- MOTION IN A STRAIGHT LINEBOOK - AAKASH INSTITUTECHAPTER - MOTION IN A STRAIGHT LINEEXERCISE - ASSIGNMENT (SECTION - D)
15 Videos
- MOTION IN A PLANEBOOK - AAKASH INSTITUTECHAPTER - MOTION IN A PLANEEXERCISE - Assignement section -J (Aakash Challengers Questions)
4 Videos
- MOTION IN STRAIGHT LINEBOOK - AAKASH INSTITUTECHAPTER - MOTION IN STRAIGHT LINEEXERCISE - Assignment (SECTION - J)
2 Videos
Similar Questions
Knowledge Check
The position - time (x−t) graph of an object in uniform motion is shown below, the velocity of object is
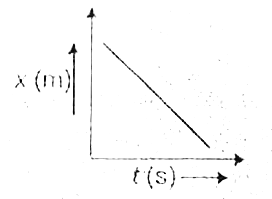 APositiveBNegativeCZeroDNone of these
The position-time graph of an object moving in a straight line is shown below. The object has zero velocity at
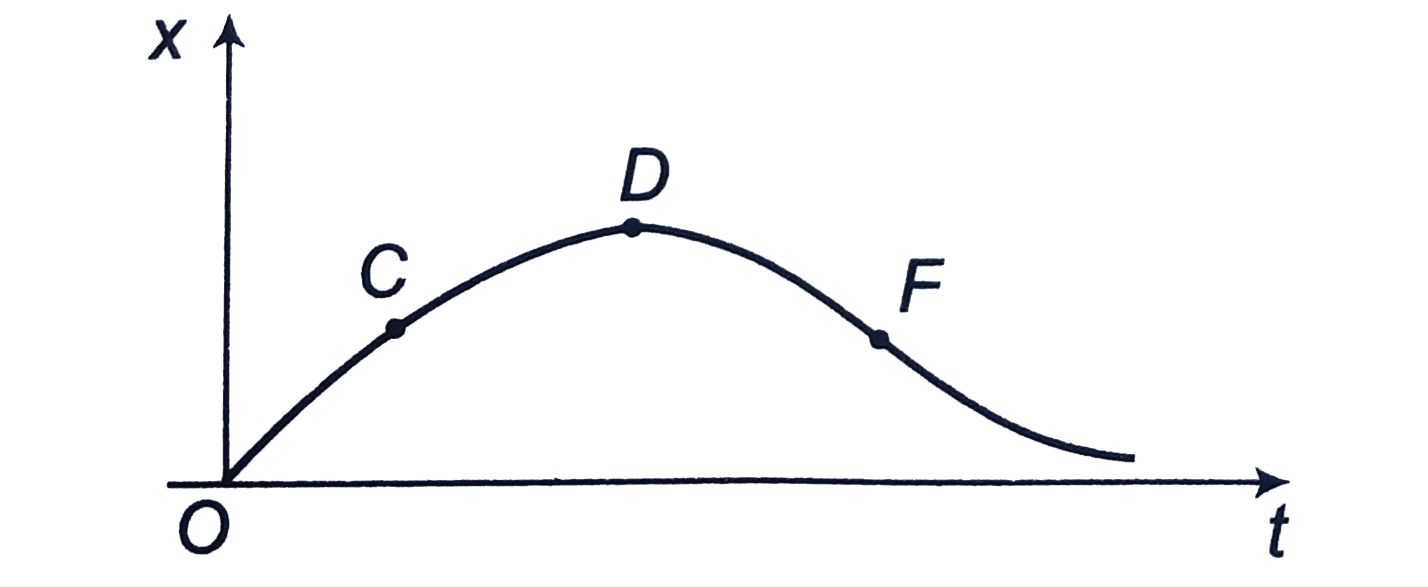 AOBCCDDF
The relation between the acceleration and time for an object is given below. Calculate the velocity with which the object is moving at t = 1 s.
a=3t−4t2
View Solutions-t graph of a particle in motion is shown in Fig. Calculate
Average velocity
View SolutionWrite some uses of velocity-time graph of an object in uniform motion.
View SolutionDraw the position-time graph for an object in uniform motion. Show that the slope of the position-time graph gives the velocity of the object.
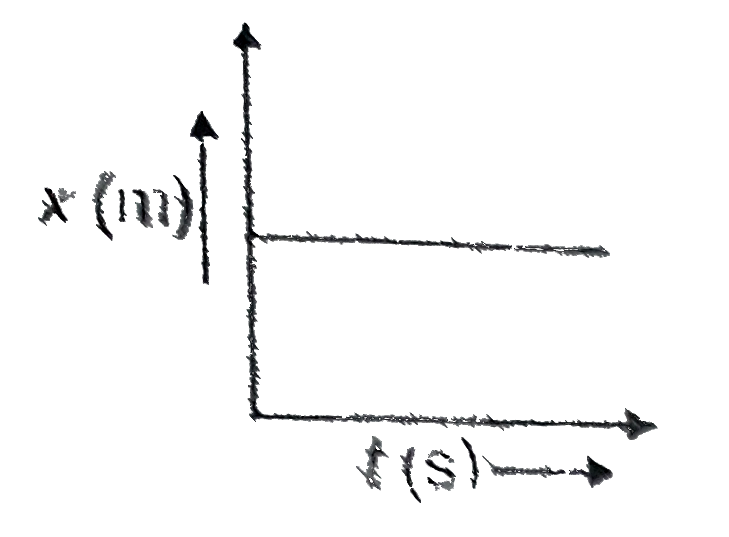
View SolutionThe position-time graph of an object is given below. What is the velocity of the object?
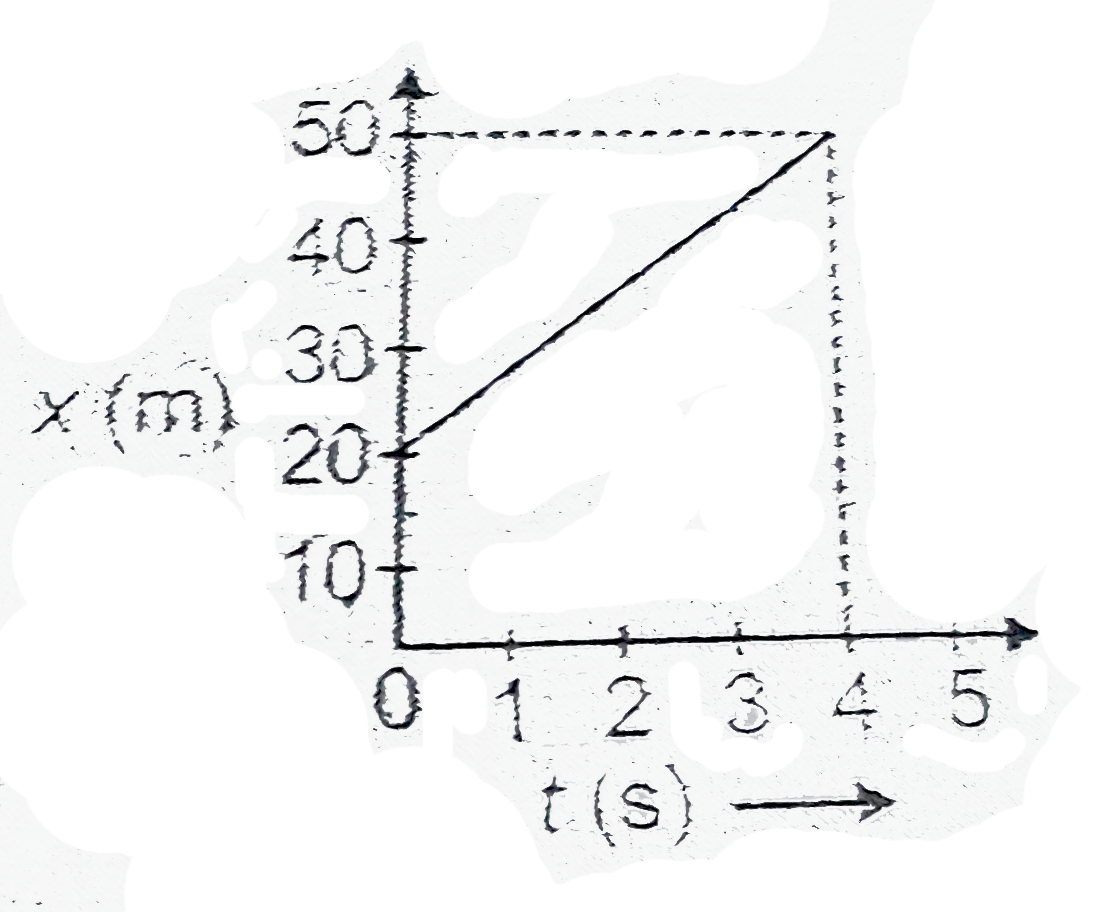
View SolutionThe position-time graph of an object is given below. What is the velocity of the object?
View Solution

