Show graphically the variation of magnetic field due to a straight conductor of uniform cross-section or radius ‘a’ and carrying steady currently as a function of distance r (a > r) from the axis of the conductor.
To show graphically the variation of the magnetic field due to a straight conductor of uniform cross-section (radius ‘a’) carrying a steady current as a function of distance ‘r’ from the axis of the conductor (where a > r), we can break down the solution into several steps:
1. Understanding the Setup:
- We have a straight conductor with a uniform cross-section and radius ‘a’ carrying a steady current ‘I’.
- We need to analyze the magnetic field at different distances ‘r’ from the center of the conductor.
2. Magnetic Field Inside the Conductor (r < a):
- For points inside the conductor (where r < a), the magnetic field can be calculated using Ampere's Law.
- The formula for the magnetic field at a distance ‘r’ from the center of the wire is given by:
B=μ0Ir2πa2
- Here, B is directly proportional to the distance ‘r’. As ‘r’ increases from 0 to ‘a’, the magnetic field increases linearly.
3. Magnetic Field on the Surface of the Conductor (r = a):
- At the surface of the conductor (where r = a), the magnetic field is given by:
B=μ0I2πa
- This is the maximum magnetic field value for the given current and radius.
4. Magnetic Field Outside the Conductor (r > a):
- For points outside the conductor (where r > a), the magnetic field can be calculated as:
B=μ0I2πr
- Here, the magnetic field is inversely proportional to the distance ‘r’. As ‘r’ increases, the magnetic field decreases.
5. Graphical Representation:
- On the graph, we will plot the magnetic field B on the y-axis and the distance r on the x-axis.
- For r<a, the graph will show a linear increase from the origin (0,0) to the point (a, B=μ0I2πa).
- At r=a, the graph will have a peak value.
- For r>a, the graph will show a hyperbolic decrease, approaching zero as r approaches infinity.
6. Final Graph:
- The graph will consist of three distinct regions:
- A linear increase for r<a.
- A peak at r=a.
- A hyperbolic decrease for r>a.
- We have a straight conductor with a uniform cross-section and radius ‘a’ carrying a steady current ‘I’.
- We need to analyze the magnetic field at different distances ‘r’ from the center of the conductor.
- For points inside the conductor (where r < a), the magnetic field can be calculated using Ampere's Law.
- The formula for the magnetic field at a distance ‘r’ from the center of the wire is given by:
B=μ0Ir2πa2
- Here, B is directly proportional to the distance ‘r’. As ‘r’ increases from 0 to ‘a’, the magnetic field increases linearly.
- At the surface of the conductor (where r = a), the magnetic field is given by:
B=μ0I2πa
- This is the maximum magnetic field value for the given current and radius.
- For points outside the conductor (where r > a), the magnetic field can be calculated as:
B=μ0I2πr
- Here, the magnetic field is inversely proportional to the distance ‘r’. As ‘r’ increases, the magnetic field decreases.
- On the graph, we will plot the magnetic field B on the y-axis and the distance r on the x-axis.
- For r<a, the graph will show a linear increase from the origin (0,0) to the point (a, B=μ0I2πa).
- At r=a, the graph will have a peak value.
- For r>a, the graph will show a hyperbolic decrease, approaching zero as r approaches infinity.
- The graph will consist of three distinct regions:
- A linear increase for r<a.
- A peak at r=a.
- A hyperbolic decrease for r>a.
Topper's Solved these Questions
- UNIT–III & UNIT–IV MAGNETIC EFFECTS OF CURRENT AND MAGNETISM & E.M.I. AND ALTERNATING CURRENTBOOK - CBSE COMPLEMENTARY MATERIALCHAPTER - UNIT–III & UNIT–IV MAGNETIC EFFECTS OF CURRENT AND MAGNETISM & E.M.I. AND ALTERNATING CURRENTEXERCISE - SHORT ANSWER QUESTIONS (2 Marks)
41 Videos
- UNIT–III & UNIT–IV MAGNETIC EFFECTS OF CURRENT AND MAGNETISM & E.M.I. AND ALTERNATING CURRENTBOOK - CBSE COMPLEMENTARY MATERIALCHAPTER - UNIT–III & UNIT–IV MAGNETIC EFFECTS OF CURRENT AND MAGNETISM & E.M.I. AND ALTERNATING CURRENTEXERCISE - SHORT ANSWERS QUESTIONS (3 Marks)
27 Videos
- SAMPLE QUESTION PAPER 2019BOOK - CBSE COMPLEMENTARY MATERIALCHAPTER - SAMPLE QUESTION PAPER 2019EXERCISE - Section C
19 Videos
Similar Questions
Knowledge Check
The magnetic field due to a conductor of uniform cross section of radius a and carrying a steady current is represented by
A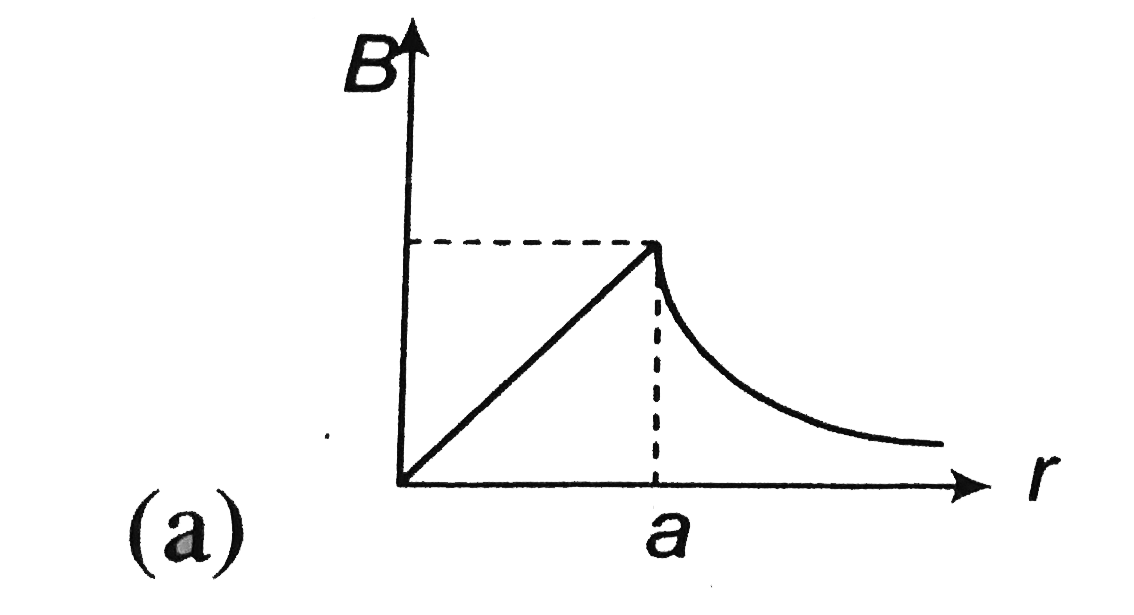 B
B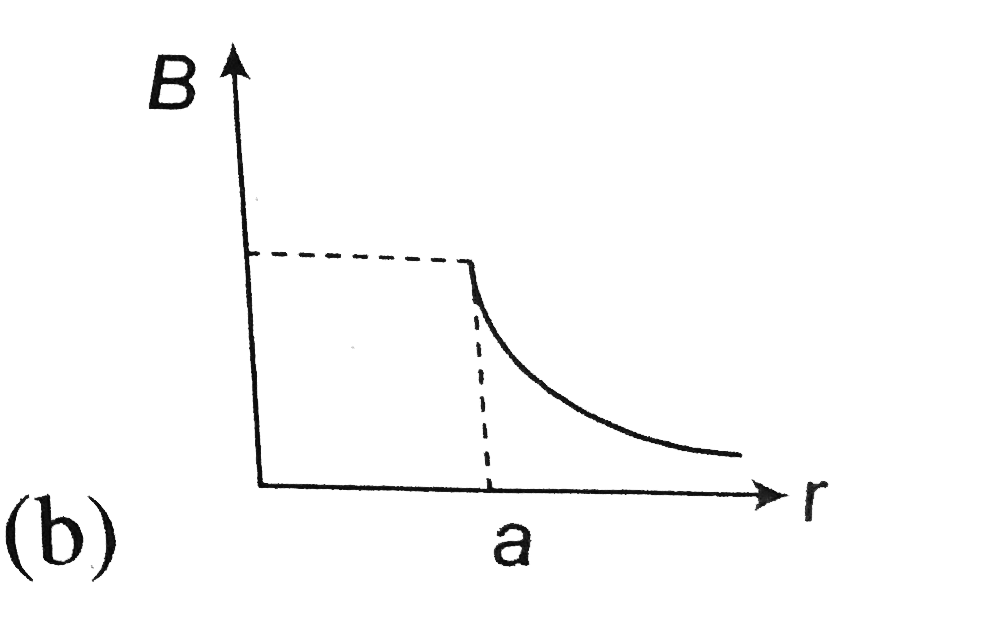 C
C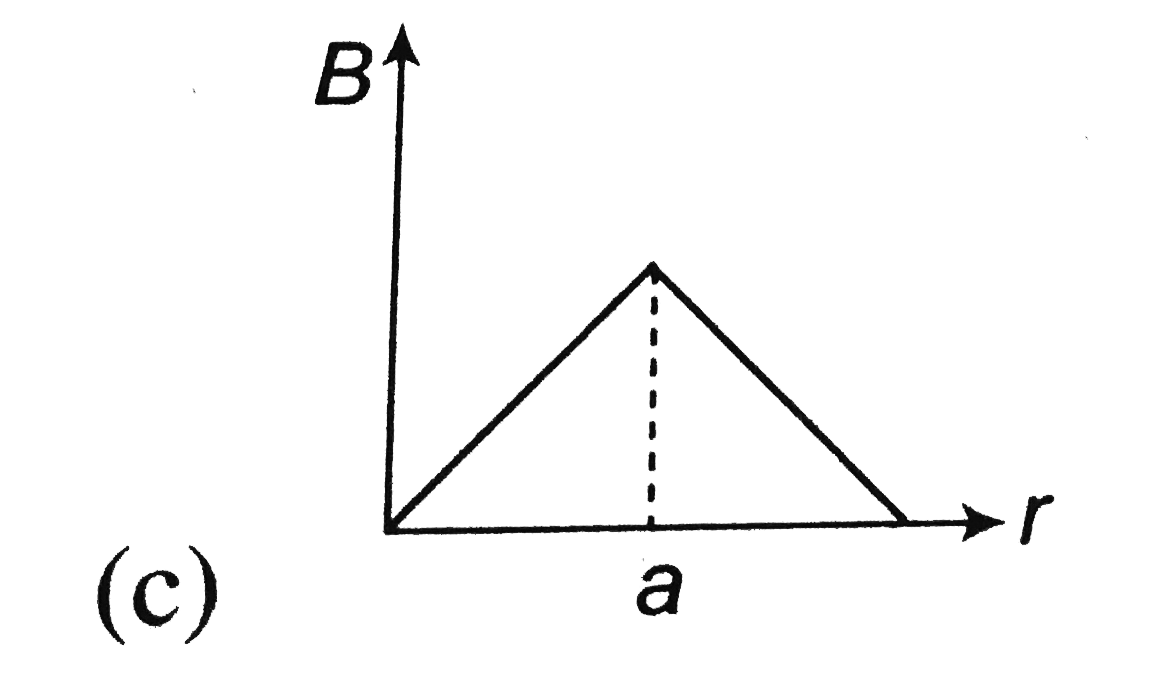 D
D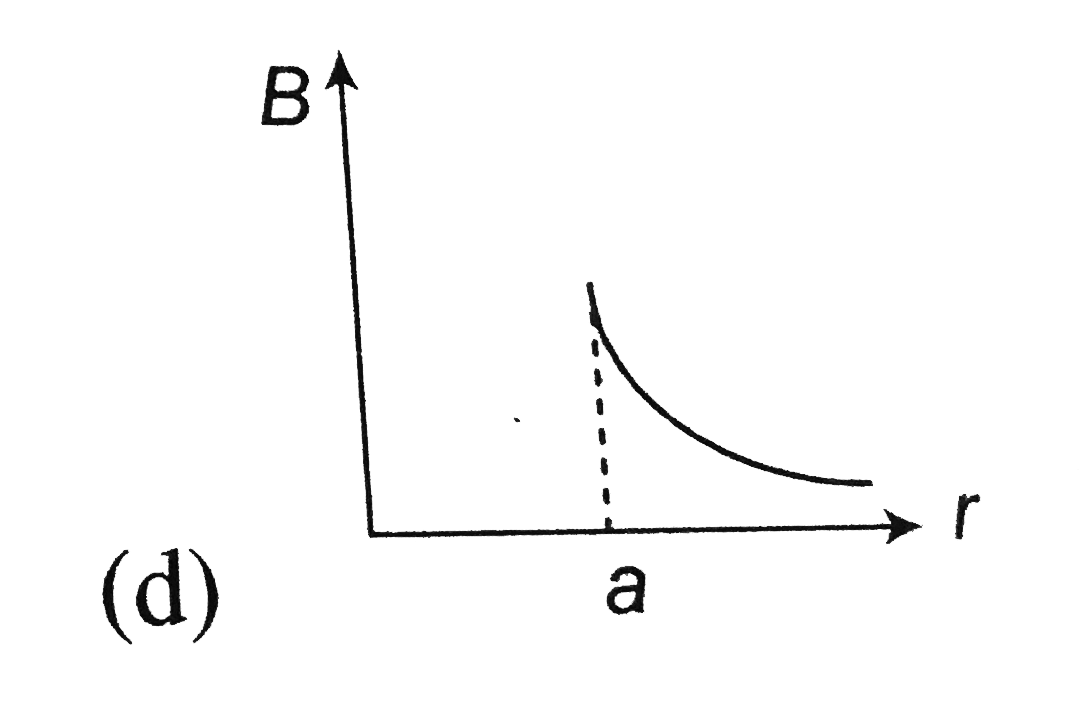
The magnetic field B due to a straight conductor of uniform cross-section of radius 'a' and carrying a steady current varies with the distance 'r' from the centre of conductor as shown in graph .
A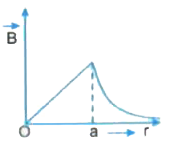 B
B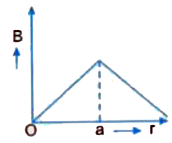 C
C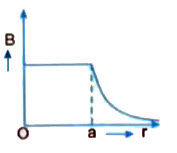 D
D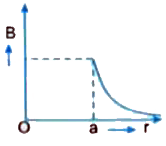
The direction of magnetic field lines close to a straight conductor carrying current will be
Aalong the length of the conductorBradially outwardCcircular in a plane perpendicular to the conductorDhelical
What is the form of magnetic field lines due to a straight current-carrying conductor?
View SolutionWhat is the form of magnetic field lines due to a straight current-carrying conductor?
View SolutionThe direction of magnetic field lines due to straight conductor carrying current is given by……………….. .
View SolutionWhat is the shape of magnetic field lines due to a straight current - carrying conductor ?
View SolutionVariation of magnetic field with distance from current carrying conductor is:
View Solution
